This document is the master's thesis of Tesfay Aregay submitted to the University of Twente in 2014. The thesis defines research conducted to identify highly influential ranking factors for search engines. It presents two approaches - calculating correlation between ranking factors and webpage rank, and training ranking models to select important features. The thesis provides results analyzing ranking factors for a Dutch web dataset and a Learning to Rank benchmark dataset. It evaluates the approaches and identifies ranking factors that positively impact search engine rankings.


![List of Tables
1.1 List of ”Related Searches” suggestion given for a search term ”Jaguar”
on Google.nl and Google.com . . . . . . . . . . . . . . . . . . . . . . . . . 5
3.1 Basic statistics on the dataset used by Bifet et al. [1], Su et al. [2] and [3] 28
3.2 Comparing the factors used by Bifet et al. [1], Su et al. [2] and Evans [3]
in their study. . . . . . . . . . . . . . . . . . . . . . . . . . . . . . . . . . . 28
3.3 Basic statistics on the dataset used by SearchMetrics, Moz and Netmark . 32
3.4 Comparison of the top 10 factors suggested by SearchMetrics, Moz and
Netmark for Google.com in 2013 . . . . . . . . . . . . . . . . . . . . . . . 33
3.5 Characteristics of publicly available benchmark datasets for learning to
rank . . . . . . . . . . . . . . . . . . . . . . . . . . . . . . . . . . . . . . . 34
4.1 Count of search terms grouped by the number of words they contain . . . 38
4.2 On-page factors, content related . . . . . . . . . . . . . . . . . . . . . . . 49
4.3 Backlinks and outlinks related factors . . . . . . . . . . . . . . . . . . . . 51
5.1 Example of calculating Spearman rho on sample data. . . . . . . . . . . . 54
5.2 Example of calculating Rank Biserial correlation coefficient on sample data. 57
5.3 Example of handling NaN and tie occurrences on input data. . . . . . . . 60
6.1 Basic statistics on the final dataset used in this research . . . . . . . . . . 66
B.1 Example of NDCG calculation explained. . . . . . . . . . . . . . . . . . . 92
B.2 Mean of Spearman Rank Correlation Coefficient Vs Coordinate Ascent
Feature Weight, LETOR4.0-MQ2008-list . . . . . . . . . . . . . . . . . . . 94
B.3 Mean of Spearman Rank Correlation Coefficient Vs Coordinate Ascent
Feature Weight, DUTCH-WEB Dataset . . . . . . . . . . . . . . . . . . . 96
C.1 Basic statistics on the SET1 and SET2 sets . . . . . . . . . . . . . . . . . 100
C.2 Backlink related data . . . . . . . . . . . . . . . . . . . . . . . . . . . . . . 112
ix](https://image.slidesharecdn.com/0349a89b-200f-4dd4-9263-3fd4633b1f75-161007132937/85/Aregay_Msc_EEMCS-10-320.jpg)


![Chapter 1. Introduction 2
particular search engine. There are several companies, that follow this approach and
produce analysis[4] [5] [6] on SEO and SEM3 to provide advice on which ranking factors
should be used, and how it should be implemented. Similarly there are a number of
commercial and free SEO tools4567 that help website owners look into their websites
and identify elements of a site that search engines deem as important.
The best example for such tools is the Webmaster Tools, which is a free service offered
by Google that helps you monitor and maintain your site’s presence in Google Search
results. This tool helps to monitor your website traffic, optimize your ranking, and
make informed decisions about the appearance of your site’s search results[7]. Similarly
Indenty, has built a tool called LeadQualifier8 that perform initial analysis on a website
by quickly scanning several online marketing elements. Although they are few in number,
the factors checked by the LeadQualifier lie into different categories (technical, content,
popularity and social signal) of ranking factors. Some of the checks the tool makes are :
• It checks if a website is accessible to search engines by checking the setting on the
Robots.txt file.
• It checks if a website has a sitemap.
• It checks if a website is built with/without frames and flash components.
• It checks if a website has an associated Facebook fan page.
• It also checks the popularity of a website using Google’s PageRank9 and the num-
ber of Backlinks10 it has.
The second approach is, to train a ranking model(also referred as ranker and ranking
function) using machine learning techniques, on datasets and select the features that
contributed most for a better performing ranker. In the area of machine learning feature
selection is the task of selecting a subset of factors to be considered by the learner. This
is important since learning with too many features is wasteful and even worse, learning
from the wrong features will make the resulting learner less effective[8]. Learning to rank
(see Section 2.8) is a relatively new field of study aiming to learn a ranking function
from a set of training data with relevance labels [9]. Dang and Croft [8] conducted
3
Search Engine Marketing
4
http://moz.com/
5
http://www.screamingfrog.co.uk/seo-spider/
6
https://chrome.google.com/webstore/detail/check-my-links/ojkcdipcgfaekbeaelaapakgnjflfglf?
hl=en-GB
7
http://offers.hubspot.com/
8
http://www.leadqualifier.nl/
9
http://en.wikipedia.org/wiki/PageRank
10
Currently LeadQualifier gets the Backlinks for a website from other service provider.](https://image.slidesharecdn.com/0349a89b-200f-4dd4-9263-3fd4633b1f75-161007132937/85/Aregay_Msc_EEMCS-13-320.jpg)
![Chapter 1. Introduction 3
an experiment on the LETOR learning to rank dataset with different learning to rank
algorithms aiming to select the most important features for document ranking.
The motivation for this research comes from the problems and drawbacks we observed in
both of these two approaches. We observe some common limitations with the LeadQual-
ifier in particular and most of the other SEO tools we came across in general. Likewise
we have identified a number of limitations regarding the SEO analysis which are pub-
lished by SEO companies and the dataset used to generate their reports. In-addition,
we have noted some drawbacks of the datasets used in learning to rank to train ranking
systems . The limitations are discussed below, categorized in to three topics.
1. Limitations of SEO Tools :
(a) The LeadQualifier needs to implement a check for more factors to give a better
advice on how to improve a website’s search engines visibility, currently it
has implemented less than 20 checks. There are over 200 different factors (or
signals) used by Google[10] to rank webpages, although it is not known what
these factors are.
(b) The most important factors should be given a priority when performing the
checks, therefore knowing which factors are more important is necessary.
(c) The LeadQualifier should be less dependent on external tools such as the
PageRank. Google used to have a publicly available SOAP API to retrieve the
PageRank of URL but not any more. As a result there is a growing concern
that the PageRank may cease to exist eventually, leaving the LeadQualifier
and other similar SEO tools at risk.
2. Limitations of SEO Companies’ Analysis :
(a) There is huge difference among the claims being made by different parties
concerning which factors are the most influential ones for ranking better on
search engines.
(b) There is no guarantee that the ranking factors suggested by different SEO
companies (e.g. SearchMetrics11, Moz12) and experts are valid since most of
them are not scientifically supported rather are based on survey, on a non-
representative sample dataset analysis and experience.
(c) Moreover, there is no enough research carried out to approve or disapprove
that the generic ranking factors suggested by experts and SEO companies
are applicable to searches originating from specific region. For instance we
11
http://www.searchmetrics.com/en/
12
http://moz.com/](https://image.slidesharecdn.com/0349a89b-200f-4dd4-9263-3fd4633b1f75-161007132937/85/Aregay_Msc_EEMCS-14-320.jpg)
![Chapter 1. Introduction 4
are not sure if the ranking factors suggested by NetMark[5] are applicable for
search quires submitted on The Netherlands version of Google(i.e. Google.nl).
Sometimes search results of same search query on Google.nl and Google.com is
different. We found it very interesting, to see the different ”Related Searches”
suggestion Google provided for exactly same query (i.e. ”Jaguar”13 submitted
to Google.nl and Google.com at the same time. Table 1.1 shows, out of the 8
suggestion only one (i.e ”jaguar f type”) was suggested by both Google.nl and
Google.com as a ”Related Searches” for the query ”Jaguar”. This implicates
that the ranking algorithm used in one data center is subtly different from
the ranking algorithm used in another, thus the factors used might also be
different.
(d) Some previous studies on Google’s ranking algorithm have not concluded
whether or not correlation is causal. For instance SearchMetrics have clearly
pointed out that : correlation = causation . Which means higher correlation
does not necessary show that, having that particular factor will bring a lead on
search results. Instead a correlation should be interpreted as a characteristics
of well ranked pages.
(e) SEO Companies are too reluctant to clearly define the methodology they
follow while producing their correlation studies, and only few of them have
provided the full dataset (query, url, feature) openly for the public.
3. Limitations of the Learning To Rank Datasets:
(a) Most of the common learning to rank benchmark datasets do not disclose the
set of queries, documents, factors they used (e.g. Microsoft and Yahoo!).
13
Jaguar : Jaguar Cars is a brand of Jaguar Land Rover, a British multinational car manufacturer
(http://en.wikipedia.org/wiki/Jaguar_Cars, July 04, 2014). At the same time Jaguar is a big cat,
a feline in the Panthera genus, and is the only Panthera species found in the Americas (http://en.
wikipedia.org/wiki/Jaguar, July 04, 2014).](https://image.slidesharecdn.com/0349a89b-200f-4dd4-9263-3fd4633b1f75-161007132937/85/Aregay_Msc_EEMCS-15-320.jpg)


![Chapter 2
Background : Web Search and
Ranking
The main goal of this chapter is to provide a background knowledge related to web search
and ranking. It includes the definition and explanation of the key aspects and concepts
that are discussed through out the rest of the document. This chapter is supposed to
help reader define the key terms, so that he/she can have a clear picture of the intention
of the research.
2.1 Web Search
Web search is the act of looking for webpages on search engines such as Google or
Bing. Webpages are web documents which can be located by an identifier called a uni-
form resource locator (URL) for example: http://www.utwente.nl/onderzoek/ (see
Section 4.2.1). Webpages are usually grouped into websites, sets of pages published
together for example: http://www.utwente.nl[11]. The entire collection of all inter-
linked webpages located around the planet is called the Web, also known as the World
Wide Web (WWW)1. In 2014, Google announced2 the web is made up of 60 trillion
(60,000,000,000,000) individual pages with makes an index of over 100 million giga-
bytes, and it is constantly growing. According to WorldWideWebSize.Com3 the Dutch
indexed web alone is estimated to be at least 204.36 million pages until 05 June, 2014.
When someone perform a web search on search engines he will get back a list of hyper-
links to prospective webpages. This list may have a hundred or more links. They are
1
http://en.wikipedia.org/wiki/World_Wide_Web(01,May,2014)
2
http://www.google.com/insidesearch/howsearchworks/thestory/(05,June,2014)
3
http://worldwidewebsize.com/index.php?lang=NL(05,June,2014)
12](https://image.slidesharecdn.com/0349a89b-200f-4dd4-9263-3fd4633b1f75-161007132937/85/Aregay_Msc_EEMCS-23-320.jpg)
![Chapter 2. Background : Web Search and Ranking 13
often divided up into a number of SERPs(see Section 2.3). From a SERP, he can decide
which link he should try and see if it contains what he is looking for.
2.2 Web Search Engine
Web search engines are very important tools to discover any information in World Wide
Web[12]. When Internet users want to work on something they usually start with search
engines 88% of the time4.
To explain what a search engine is we like to use a real world analogy. Search engines
such as Google and Bing are like a librarian, not a normal one but a librarian for every
book in the world. People depend on the librarian every day to find the exact book they
need. To do this efficiently the librarian needs a system, and he needs to know what is
inside every book and how books relate to each other. He could gather information about
the books by reading the books’ titles, categories, abstracts etc. His system needs to
take in the gathered information, process it and spit out the best answer for a reader’s
question. Similarly search engines are librarians of the Internet, their system collect
information about every page on the web so that they can help people find exactly what
they are looking for. And every search engine has a secret algorithm which is like a
recipe for turning all that information in to useful organic or paid search5.
Search engines such as Google and Bing provide a service for searching billions of indexed
webpages for free. The result search engines display for every search query submitted is
composed of free (none ads6) and paid (ads) webpages. The naturally ranked webpages
also known as organic search are webpages determined by search engine algorithms for
free, and can be optimized with various SEO practices. In contrast, paid search allows
website owners to pay to have their website displayed on the search engine results page
when search engine users type in specific keywords or phrases7. The figure below [Figure
2.1] depicts the elements inside search engines and flow of the process.
4
http://www.nngroup.com/articles/search-engines-become-answer-engines/(05,June,2014)
5
http://www.goldcoast.qld.gov.au/library/documents/search_engine_optimisation.pdf
6
Advertisement
7
http://offers.hubspot.com/organic-vs-paid-search](https://image.slidesharecdn.com/0349a89b-200f-4dd4-9263-3fd4633b1f75-161007132937/85/Aregay_Msc_EEMCS-24-320.jpg)
![Chapter 2. Background : Web Search and Ranking 14
Figure 2.1: Ranking inside search engine
2.3 Search Engine Results Page (SERP)
A search engine results page is the listing of results returned by a search engine in
response to a keyword query8. The results normally include a list of items with titles, a
reference to the full version, and a short description showing where the keywords have
matched content within the page. If we see into Google’s SERP, the elements / listings
included in a SERP are growing in number and in type. Some of the elements of a SERP
are :
• Organic Results : Organic SERP listing are natural results generated by search
engines after measuring many factors, and calculating their relevance in relational
to the triggering search term. In Google’s term, organic search results are web-
pages from a website that are showing in Google’s free organic search listings9.
As mentioned above only organic search results are affected by search engine op-
timization, not paid or ”sponsored” results such as Google AdWords[10].
• Paid Results : Paid also know as ”Sponsored” search results, are listing on the
SERP that are displayed by search engines for paying customers (website owners)
which are set to be triggered by particular search term (e.g. Google Adwords)10.
• Knowledge Graph : The Knowledge Graph is a relatively newer SERP element
observed on search engines particularly Google used to display a block of informa-
tion about a subject11. This listing also shows an answer for fact questions such
as ”King Willem Alexander Birthday” or ”Martin Luther King Jr Assassination”.
8
http://en.wikipedia.org/wiki/Search_engine_results_page
9
https://support.google.com/adwords/answer/3097241?hl=en(June 11, 2014)
10
http://serpbox.org/blog/what-does-serp-mean/
11
http://moz.com/blog/mega-serp-a-visual-guide-to-google](https://image.slidesharecdn.com/0349a89b-200f-4dd4-9263-3fd4633b1f75-161007132937/85/Aregay_Msc_EEMCS-25-320.jpg)
![Chapter 2. Background : Web Search and Ranking 15
• Related Searches : This part of the SERP is where search engines provide
suggestion on related search terms to the one submitted.
2.4 Search Term
Billions of people all around the world conduct search each day by submitting search
terms on popular search engines and social networking websites. A search term also
know as keyword is the textual query submitted to search engines by users.
Note : In this document search term, keyword, and query will be used interchangeably,
therefore the reader should regard them as synonymous.
2.5 Search Engine Optimization (SEO)
For companies, or individuals who own a website search results matter, when their
page have higher ranking it helps people find them. E-commerce companies are very
interested and curious on how the ranking is done. This is due to the fact that being
found on the Internet for a given search term is continuously becoming major factor to
maximize ROI12.
The key to higher ranking is making sure the website has the ingredients also known as
”raking factors” search engines need for their algorithm that we refer as recipe on the
previous sub section, and this process is called Search Engine Optimization (SEO). In
other words Search Engine Optimization is often about making small modifications on
your website such as the content and code. When viewed individually, these changes
might seem like incremental improvements but they could have a noticeable impact on
your site’s user experience and performance in organic search results[10].
2.6 Ranking Factors
Ranking factors also known as ranking criteria are the factors used by search engines in
evaluating the order of relevance of a webpage when someone searches for a particular
word or phrase13. It is almost obvious that the ranking factors have different weight
assigned to them. For instance according to SearchMetrics white paper SEO guideline
made for Bing USA 2013[4], ”the existence of keyword on domain” is still one of the
major ranking factor probably with the highest weight.
12
Return on Investment
13
http://marketinglion.co.uk/learning-lab/search-marketing-dictionary](https://image.slidesharecdn.com/0349a89b-200f-4dd4-9263-3fd4633b1f75-161007132937/85/Aregay_Msc_EEMCS-26-320.jpg)
![Chapter 2. Background : Web Search and Ranking 16
Although different entities(companies, individuals) independently suggest various fac-
tors for ranking well on search results, there are some basic SEO practices. To give a
sense of what these practices are, we will discuss some of them here. First, words used
in the content of a webpage matter, search engine account for every word on the web,
this way when someone search for ”shoe repair” the search engine can narrow results
to only the pages that are about those words. Second, titles matter, each page on the
web has an official title, users may not see it because it is in the code. Search engine
pay a lot of attention to titles because they often summarize the page like a book’s
title. Third, links between websites matter, when one webpage links to another it is
usually a recommendation telling readers this site has good information. A webpage
with a lot of links coming to it can look good to search engines but some people try to
fool the search engine by creating or buying bogus links all over the web that points to
their own website. This phenomenon is called Search Engine Persuasion (SEP) or Web
Spamming [13]. Usually search engines can detect when a site has a lot of them, and
they account for it by giving links from trustworthy site more weight in their ranking
algorithm14. Fourth, the words that are used in links also know as anchor text matter
too, if your webpage says ”Amazon has lots of books” and the word ”books” is linked,
search engine can establish that amazon.com is related to the word ”books”, this way
when some one search ”books” that site will rank well. Lastly, search engines care about
reputation, sites with consistent record of fresh, engaging content and growing number
of quality links may be considered rising stars and do well in search rankings. These are
just the basics and search engine algorithms are fined and changed all the time which
makes chasing the algorithms of giant search engines such as Google always difficult.
Apparently, good SEO is not just about chasing the algorithm but making sure that a
website is built with all the factors search engines need for their algorithms15.
Note : In this document ranking factor, ranking criteria, and feature will be used inter-
changeably, therefore the reader should regard them as synonymous.
2.7 Webpage Ranking
Ranking is sorting objects based on certain factors[14]: given a query, candidates doc-
uments have to be ranked according to their relevance to the query[15]. Traditionally,
webpage ranking on search engines was done using a manually designed ranking func-
tion such as BM25, which is based on the probabilistic retrieval framework. Where as
now, as it will be discussed in Section 2.8, webpage ranking is consider as a problem of
Learning to rank.
14
http://searchengineland.com/guide/what-is-seo
15
http://sbrc.centurylink.com/videos/marketing/digital-marketing/
search-engine-optimization-seo/](https://image.slidesharecdn.com/0349a89b-200f-4dd4-9263-3fd4633b1f75-161007132937/85/Aregay_Msc_EEMCS-27-320.jpg)
![Chapter 2. Background : Web Search and Ranking 17
2.8 Learning to Rank (LETOR)
The task of ”learning to rank” abbreviated as LETOR has emerged as an active and
growing area of research both in information retrieval and machine learning. The goal
is to design and apply methods to automatically learn a function from training data,
such that the function can sort objects (e.g., documents) according to their degrees
of relevance, preference, or importance as defined in a specific application16. The steps
followed when learning to rank if it is applied to a collection of documents (i.e. webpages
in our case) are :
1. A number of queries or search terms are accumulated to make a training model;
each search terms are linked to set of documents(webpages).
2. Certain factors are extracted for each query-document pair, to make a feature
vector(i.e. list of factor id and with their relative value).
3. A relevance judgments (e.g. perfect, excellent,good, fair or bad), which indicates
the degree of relevance of each document to its corresponding query, are included
in the data.
4. Ranking function also know as ranking model is created by providing the training
data to a machine learning algorithms, so that it can accurately predict the rank
of the documents.
5. In testing, the ranking function will be used to re-rank the list of documents when
a new search term is submitted[16].
6. To measure how well the ranking function did the prediction, evaluation metrics
like Discounted Cumulative Gain(DCG)[17] or Normalized Discounted Cumulative
Gain(NDCG)[18] are required.
Figure 2.2 precisely shows the process flow of learning to rank and the components
involved[19].
Generally there are three types of learning to rank approaches, these are :
• Pointwise Approach : The pointwise approach regards a single document as its
input in learning and defines its loss function based on individual documents[20].
• Pairwise Approach : The pairwise approach takes document pairs as instances
in learning, formalizes as document A is more relevant than document B with
respect to query q.
16
http://research.microsoft.com/en-us/um/beijing/events/lr4ir-2008/](https://image.slidesharecdn.com/0349a89b-200f-4dd4-9263-3fd4633b1f75-161007132937/85/Aregay_Msc_EEMCS-28-320.jpg)
![Chapter 2. Background : Web Search and Ranking 18
Figure 2.2: A general paradigm of learning to rank for IR[19].
• Listwise Approach : Listwise learning to rank operates on complete result
rankings. These approaches take as input the n-dimensional feature vectors of all
m candidate documents for a given query and learn to predict either the scores
for all candidate documents, or complete permutations of documents[20]. Some of
listwise models are : AdaRank, ListNet,LambdaMART, Coordinate Ascent.
Note : In this document ranking model, ranking function, and ranker will be used inter-
changeably, therefore the reader should regard them as synonymous.
2.9 Summary
The naturally ranked webpages also known as organic search are webpages determined
by search engine algorithms for free, and can be optimized with various SEO practices.
Search Engine Optimization (SEO) is often about making small modifications on your
website such as the content and code to get higher ranking on search engines.](https://image.slidesharecdn.com/0349a89b-200f-4dd4-9263-3fd4633b1f75-161007132937/85/Aregay_Msc_EEMCS-29-320.jpg)
![Chapter 3
Related Work
This chapter will present a review of previous and continuing researches that are related
to the topic of this thesis. The review was conducted with an intent to answer the ques-
tion SRQ-1.2 :”Which techniques exist to identify the most important factors for ranking
well on search engines?”. In chapter 1 we mentioned that there are two approaches that
are currently followed to identify important ranking factor, and here we review previous
works for both approaches. Along side, we assess the ranking factors analyzed in these
researches, and present a summarized review to answer SRQ-1.2 :”Which ranking factors
have been studied in previous researches ?”.
A concise result on the search carried out to discover what benchmark datasets exist,
how are they constructed/prepared to conduct similar researches is also included in this
chapter. At last it gives a comparison tables on the ranking factors analyzed by different
SEO companies, as well as the academia, and sum up with a summary.
3.1 Machine Learning Based Studies
The works reviewed here utilized different machine learning techniques to conduct their
researches. As introduced in previous chapters, one way of coming up with set of impor-
tant ranking factors for well ranking is : to train a ranking model using machine learning
techniques (ranking algorithms), on datasets and select the factors that contributed most
for a better performing ranker. Here, we include two previous works conducted with
the same basic approach but different end goal (e.g. reverse engineer Google’s ranking
algorithm).
The first work, is a research by Su et al. [2], they tried to predict the search results
of Google. First they identified 17 ranking factors (see Table 3.4), then prepared a
19](https://image.slidesharecdn.com/0349a89b-200f-4dd4-9263-3fd4633b1f75-161007132937/85/Aregay_Msc_EEMCS-30-320.jpg)
![Chapter 2. Related Work 20
dataset of 60 search terms, scanned top 100 ranked webpages from Google.com, download
webpages from the original website and extract the ranking factors from the pages. Then
they train different models on a training subset (15 search terms) and later predict ranks
of webpages on Google for a test subset (45 search terms). They experimented on linear
programming algorithm which makes a pairwise comparison between two documents in
a given dataset. Given a set of documents, pre-defined Google’s ranking, and a ranking
algorithm A, their goal was to find a set of weights that makes the ranking algorithm re-
produce Google ranking with minimum errors. Inaddition, they experimented on linear
and polynomial implementations of SVM-rank, which also makes a pairwise comparison
between a pair of documents. They showed results that indicate linear learning models,
coupled with a recursive partitioning ranking scheme, are capable of reverse engineering
Google’s ranking algorithm with high accuracy. More interestingly, they analyzed the
relative importance of the ranking factors towards contributing to the overall ranking of a
page by looking into the weights of the ranking factors assigned by trained ranking models.
Based on their experiments, they consistently identified PageRank as the most dominate
factor. Keyword in hostname, and keyword in title tag, keyword in meta description
tag and keyword in URL path are also among their leading factors. Unfortunately,
the general validity of this paper’s result made us a bit skeptical due to the limited
dataset that was used in the experiments. On top of that, this paper experimented on
webpages that are composed in English. However, despite this disclaimer, we used the
methodologies of this paper as a foundation to formulate our approach.
A similar research by Bifet et al. [1] tried to approximate the underlying ranking func-
tions of Google by analyzing query results. First they gathered numeric values of ob-
served features from every query result, thus converting webpages in to vectors. Then,
they trained their models on the difference vectors between documents at different ranks.
They used three machine learning techniques (binary classification, logistic regression
and support vector machines) along with the features to build their models. With the
binary classification model, they formulate their problem as pairwise comparison : given
a pair of webpages they try to predict which one is ranked above the other, hence the
model do not give a full ranking. With the models from logistic regression and support
vector machines, they were able to get full ranking of the webpages. Their main goal was
to obtain an estimation function f for the scoring function of a search engine, and then
to compare their predicted rankings with the actual rankings of Google. To analyze the
importance of the features they computed precision values obtained using only individual
features to predict the ranking. The authors used a dataset containing keywords from 4
different categories (Arts, States, Spam, Multiple) each holding 12 keywords. These 12
search terms are further divided into three disjoint sets (7 training terms, 2 validation
terms and 3 test terms). However, the search terms they selected sounds arbitrary, and](https://image.slidesharecdn.com/0349a89b-200f-4dd4-9263-3fd4633b1f75-161007132937/85/Aregay_Msc_EEMCS-31-320.jpg)
![Chapter 2. Related Work 21
fail to represent the typical user query both qualitatively and quantitatively. For each
query the top 100 result webpages are downloaded. Using the Google API 5 inlinks
for each URLs of each result webpages are retrieved and they considered only HTML
pages on their experiment. When we see to their outcome, the models only marginally
outperformed the strongest individual feature (i.e., the feature with the most predictive
power) for a given keyword category. Based on this result, the authors concluded that
Google uses numerous ranking factors that are “hidden” (i.e., not directly observable
outside of Google).
Bifet et al. [1] indicated few interesting points as reasons for not performing well. Some
of them are, in certain countries search engines voluntarily cooperate with the authorities
to exclude certain webpages for legal reasons from the results. It appears that certain
webpages are pushed up or down on queries for reasons related to advertisement or other
agreements. Another interesting idea pointed out on this paper is that it is possible that
search engines take user profile and geographic location of query initiators into account.
For example someone in a third world country with very slow Internet connection might
be interested in result pages totally different than someone in first world country with
better connection speed. Their paper also mentioned some room for improvements,
the best precision achieved was only 65% for all the features, datasets and methods
considered. Better precision can be obtained on the prediction by making substantial
change on the features and dataset used.
To summarize, from these works we learn how machine learning techniques could be
used to discover the influence of ranking factors in search engines. One of the common
shortcomings we observed from these works is : the fact that their results are based on
a small and non-representative dataset analysis.
3.2 Rank Correlations Based Studies
An other approach to identify the influence of factors on ranking is to calculate rank
correlation coefficients between feature values and rank of webpages on certain search
engine. There are many companies which follow this approach, however the review here
elaborates works from three of the leading SEO companies currently on the business
namely SearchMetrics1, SEOMoz2, and NetMark3. In this section, brief discussion about
the methodology they use and findings of these companies will be presented. The figure
below [Figure3.1] is used to elaborate how the correlation coefficients are calculated in
the next sections.
1
http://www.searchmetrics.com/en/white-paper/ranking-factors-bing/
2
http://moz.com/blog/ranking-factors-2013/
3
http://www.netmark.com/google-ranking-factors](https://image.slidesharecdn.com/0349a89b-200f-4dd4-9263-3fd4633b1f75-161007132937/85/Aregay_Msc_EEMCS-32-320.jpg)
![Chapter 2. Related Work 22
Figure 3.1: Fictitious data to help explain the concepts and equations in this chapter
which are referring to this table
3.2.1 Spearman Rank Correlation
In statistics, Spearman’s rank correlation coefficient is a nonparametric measure of sta-
tistical dependence between two variables4. A high positive correlation coefficient occurs
for a factor if higher ranking pages have that feature / or more of that feature, while
lower ranking pages do not / or have less of that feature. SearchMetrics produces a
number of white papers and guidelines focusing on the definition and evaluation of most
important factors that have high rank correlation with top organic search results of sev-
eral search engines. Recently they have released evaluation white paper for Bing.com in
the USA for the year 2013 [4], similarly they have published white papers optimized for
Google.co.uk, Google.fr, Google.it etc.. They use Spearman correlation to assesses how
well the relationship between rank of a webpage and a particular ranking factor is. Ac-
cording to their study technical site structure and good content are basic requirements
for ranking well. Also social signals have a clear positive correlation to higher ranking,
with Google+ leading the rest of the social medias.
SearchMetrics analyses are based on search results for a very large keyword set of 10,000
search terms from Bing USA. The first three pages of organic search results(SERPs)
(i.e. maximum of 30 webpages) were always used as a data pool for each search term,
which sums up to a maximum of 30*10,000 = 30,0000 webpages in total.
Even though, SearchMetrics’s reports are the most recent and detailed analysis on SEO
ranking factors (to our knowledge), some SEO experts5 criticizes SearchMetrics for re-
leasing confusing reports such as saying ”keywords in title have 0 correlation coefficient”.
Another limitation of SearchMetric’s reports is the fact that they have not conducted
an analysis optimized for Google Netherlands yet.
Similarly Moz [6] runs a ranking factors study to determine which attributes of pages and
sites have the strongest association with ranking highly in Google. Their study consists
of two parts: a survey of professional SEOs and a large Spearman correlation based
analysis. On their most recent study Moz surveyed over 120 leading search marketers
who provided expert opinions on over 80 ranking factors. For their correlation study,
4
http://en.wikipedia.org/wiki/Spearman’s_rank_correlation_coefficient
5
http://www.clicksandclients.com/2013-rank-correlation-report/](https://image.slidesharecdn.com/0349a89b-200f-4dd4-9263-3fd4633b1f75-161007132937/85/Aregay_Msc_EEMCS-33-320.jpg)
![Chapter 2. Related Work 23
since they had a wide variety of factors and factor distributions (many of which are
not Gaussian), they preferred Spearman correlation than the more familiar Pearson
correlation (as Pearson correlation assumes the variables are Gaussian)6. The dataset
they used contains a list of 14,641 queries, and collected the top 50 search results for
each of the queries on the query list from Google’s U.S. search engine.
Moz’s key findings include: Page Authority7 correlates higher than any other metric
they have measured. Social signals, especially Google +1s and Facebook shares are
highly correlated to Google’s ranking. Despite the updates (Google Panda8 and Google
Penguin9), anchor text correlations remain as strong as ever. On its report Moz made
it clear that the factors evaluated are not evidence of what search engines use to rank
websites, but simply show the characteristics of webpages that tend to rank higher.
With slightly different approach, Netmark [5] calculated mean Spearman rank correla-
tion by first calculating correlation coefficient for each keyword and then averaged the
results together. Their main reason for choosing mean Spearman rank correlation co-
efficient is to keep the queries independent from one another. Below is the formula for
Spearman rank correlation coefficient when no duplicates(ties) are expected[21].
ρ = 1 −
6Σd2
i
n(n2 − 1)
(3.1)
ρ = rho (the correlation coefficient)
di = the differences between the ranks (di = xi − yi)
n = the total number of observations
To explain how this formula (3.1) is used to calculate the mean Spearman correlation
coefficient an example is provided below :
Let’s say we want to find out how well Facebook shares of a particular website’s/webpage’s
fan page (x) are correlated to Google’s ranking (y) for given search term (see ’Position’
and ’Facebook Share’ columns from Figure 3.1 ). The first step is to sort the Google
results (i.e. the ranked pages) by their Facebook shares in descending order. Next, we
take the difference between the rank of Facebook share of a page and the rank of page’s
position on Google which gives us a the variable di = xi − yi. Now all the variables we
need for the above formula (3.1) are provided. To keep the search terms independent
6
http://moz.com/search-ranking-factors/methodology#survey
7
Page Authority is Moz’s calculated metric for how well a given webpage is likely to rank in
Google.com’s search results. It is based off data from the Mozscape web index and includes link counts,
MozRank, MozTrust, and dozens of other factors.(http://moz.com/learn/seo/page-authority, July
10, 2014)
8
http://en.wikipedia.org/wiki/Google_Panda
9
http://en.wikipedia.org/wiki/Google_Penguin](https://image.slidesharecdn.com/0349a89b-200f-4dd4-9263-3fd4633b1f75-161007132937/85/Aregay_Msc_EEMCS-34-320.jpg)
![Chapter 2. Related Work 24
from each other, Spearchman rank correlation coefficient is calculated for each search
term, and then averaged across all the search terms for the final result (mean Spearman
rank correlation coefficient).
3.2.2 Kendall Rank Correlation
The Kendall (1955) rank correlation coefficient evaluates the degree of similarity between
two sets of ranks given to a same set of objects[22]. Similar to Spearman, Kendall rank
correlation coefficient is another correlation measure for non-parametric data10 as it
compares the rankings of the variables instead of the variables themselves, although by
nature Kendall’s results usually show weaker correlations [5]. Below is the formula used
by Netmark to calculate the Kendall rank correlation.
τ =
C − D
1
2n(n − 1)
(3.2)
τ = tau (the Kendall rank correlation coefficient)
C = the number of concordant pairs
D = the number of discordant pairs
n = the total number of observations
To explain how the above equation (3.2) is utilized for this analysis : let’s say we decided
to compare Google’s result(x) against the total number of Backlinks(y) of the ranked
pages(see ’Position’ and ’Backlinks’ columns from Figure 3.1). When moving down the
list, any pair of observations (xi, yi) and (xj, yj) are said to be concordant ( C in
equation 3.2 ) if the ranks for both elements agree: that is, if both xi > xj and yi > yj
or if both xi < xj and yi < yj. They are said to be discordant (D in equation 3.2), if
xi > xj and yi < yj or if xi < xj and yi > yj. If xi = xj or yi = yj, the pair is neither
concordant nor discordant. Now we have all the variables needed for equation 3.2, after
computing Kendall correlation for each search query we average across all results to
come up with the final result (mean Kendall correlation).
3.2.3 Rank Biserial Correlation
Biserial correlation refers to an association between a random variable X which takes
on only two values(for convenience 0 and 1), and a random variable Y measured on
a continuum [23]. Netmark performed an analysis based on Spearman and Biserial
correlation. On their report [5] they argue that, for variables that are binomial in
10
In statistics, the term non-parametric statistics refers to statistics that do not assume the data or
population have any characteristic structure or parameters](https://image.slidesharecdn.com/0349a89b-200f-4dd4-9263-3fd4633b1f75-161007132937/85/Aregay_Msc_EEMCS-35-320.jpg)

![Chapter 2. Related Work 26
PageAuthorityRatio = NumberofPageFacebookLikes
PageAuthority
Then they used the resulting ratios to calculate Spearman correlation with Google’s
search rankings.
3.2.5 Normalization
In statistics, an outlier is an observation point that is distant from other observations.
An outlier may be due to variability in the measurement or it may indicate experimental
error; the latter are sometimes excluded from the dataset[24]. When computing correla-
tion coefficients[5] it is a common practice to normalize the raw data before averaging.
In statistics, normalization means adjusting values measured on different scales to a
notionally common scale, often prior to averaging13.
If two variables are compared with a different order of magnitudes, a common way
to standardize those variables is by computing a z-score for each observation[5]. The
mathematical equation to do this is:
z =
(x − µ)
σ
(3.4)
z = the standardized score
x = raw data to standardize
µ = the mean
σ = the standard deviation
3.2.6 P Value
In statistical significance testing, the p-value is the probability of obtaining a test statistic
result at least as extreme as the one that was actually observed, assuming that the null
hypothesis is true[25].
A researcher will often ”reject the null hypothesis” when the p-value turns out to be less
than a predetermined significance level, often 0.05[26] or 0.01. Such a result indicates
that the observed result would be highly unlikely under the null hypothesis.
P value is a statistical measure that helps scientists determine whether or not their
hypotheses are correct. P values are usually found on a reference table by first calculating
a chi square value.
13
http://en.wikipedia.org/wiki/Normalization_(statistics)](https://image.slidesharecdn.com/0349a89b-200f-4dd4-9263-3fd4633b1f75-161007132937/85/Aregay_Msc_EEMCS-37-320.jpg)
![Chapter 2. Related Work 27
3.2.7 Chi Square
Chi Square(written x2) is a numerical value that measures the difference between an
experiment’s expected and observed values14. Netmark used chi square to calculate
the correlation of factors that are categorized as limited, such as the Top-Level Do-
mains(TLD). The equation for chi square is:
x2
= Σ(
(o − e)2
e
) (3.5)
Where ”o” is the observed value and ”e” is the expected value.
3.3 Data Analysis Based Study
Evans [3] tried to identify the most popular techniques used to rank a webpage high in
Google. The paper presents the results of a study on 50 highly optimized webpages that
were created as part of a Search Engine Optimization competition. The study focuses
on the most popular techniques that were used to rank highest in this competition,
and includes an analysis on the use of PageRank, number of pages, number of in-links,
domain age and the use of third party sites such as directories and social bookmarking
sites. A separate study was made on 50 non-optimized webpages for comparison. This
paper provides insight into the techniques that successful Search Engine Optimizers use
to ensure that a page ranks high in Google. This work also recognizes the importance
of PageRank and links as well as directories and social bookmarking sites.
Evans pointed out that the limitation of his work is that it only analyzed the top 50
web sites for a specific query (i.e. ”V7ndotcom Elursrebmem”). Analyzing more web
sites and comparing with similar studies in different competition would provide more
concrete results. His study only analyzed 6 off-page factors, analyzing more factors and
considering on-page factors could give more solid outcome.
3.4 Previously Analyzed Ranking Factors
In this section we present tables that summarizes the ranking factors analyzed by the
academic papers and white papers reviewed in previous sections. In addition we give
basic information about the datasets utilized in these researches.
14
http://www.wikihow.com/Calculate-P-Value](https://image.slidesharecdn.com/0349a89b-200f-4dd4-9263-3fd4633b1f75-161007132937/85/Aregay_Msc_EEMCS-38-320.jpg)
![Chapter 2. Related Work 28
Table 3.1: Basic statistics on the dataset used by Bifet et al. [1], Su et al. [2] and [3]
INFO Bifet (2005) Su(2010 ) Evans(2007)
Search Terms 48 60 1
Webpages per Search Term Top 100 Top 100 Top 50
Factors per Webpage 22 17 6
Search Engine Google Google Google
3.4.1 Academic Papers
To help the reader get a quick glimpse on the amount of search terms, webpages and
ranking factors analyzed by the papers reviewed we prepared table 3.1. Consequently,
table 3.4.1 is prepared to show the similarity and disparity of the factors analyzed in
these papers ( Bifet et al. [1], Su et al. [2] and Evans [3]). To help the reader compare,
factors that are similar are filled with same background color(non-white) and ordered
accordingly. Only one factor is included in all there (i.e. PageRank), four matching
factors used by [1] and [2], one matching factor used by [2] and [3] and two between [1]
and [3].
Table 3.2: Comparing the factors used by Bifet et al. [1], Su et al. [2] and Evans [3]
in their study.
# Bifet (2005 ) Su(2010 ) Evans(2007)
1 PageRank of the page,
or the approximation of
the PageRank in a 0-
10 scale obtained from
Google’s toolbar
PageRank score PageRank of a web site
2 Fraction of terms in the
documents which can
not be found in an En-
glish dictionary
Age of the web site’s domain
(in years)
Age of the web site’s do-
main name
3 Term is in the page’s
URL or not
Keyword appear in hostname
(boolean)
Number of webpages in
a site indexed by search
engine
4 Number of pages
linking to a page, in-
degree approximated
using Google API link:
queries
Keyword in the path segment
of url (boolean)
Number of in-links to a
web site
Continued on next page](https://image.slidesharecdn.com/0349a89b-200f-4dd4-9263-3fd4633b1f75-161007132937/85/Aregay_Msc_EEMCS-39-320.jpg)


![Chapter 2. Related Work 34
3.5 Learning to Rank Benchmark Datasets
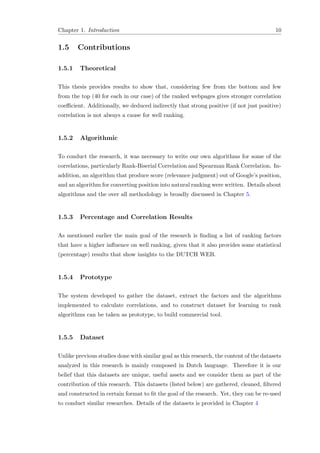
In an effort to understand the format of the datasets that are widely used for learning
to rank studies, we reviewed 3 of the most popular benchmark datasets nowadays. The
datasets are namely LETOR, Yahoo and Microsoft datasets. All the datasets contains a
set of query-document pairs, represented by 46 up to 700 ranking features, and relevance
judgments is provided by professional annotators.
Table 3.5 provides a summarized information on the number of queries, documents,
relevance levels, features and year of release of each dataset.
Table 3.5: Characteristics of publicly available benchmark datasets for learning to
rank
Dataset Queries Doc. Rel. Feat. Year
LETOR 4.0 2,476 85 k 3 46 2009
Yahoo 36,251 883 k 5 700 2010
Microsoft 31,531 3,771 k 5 136 2010
As mentioned in Chapter 1, the common problem observed on all these datasets is that,
the queries and URLs are not disclosed, instead these informations are represented by id.
The LETOR dataset includes the list of features where as Yahoo has not disclosed the
features, similarly Microsoft has only provided a high level description of the features
category. The main reason for keeping the features closed is : since features are major
component of any learning to rank system, it is important for search engines like Yahoo
and Bing to keep the features secrete. Similarly disclosing the queries and URLs could
also lead to a risk of reverse engineering the features used by their ranking system
which then will be used by SEO community to weaken the effectiveness of the ranking
system[15].
We found LETOR4.0-MQ2008-list version of the LETOR dataset very convenient for our
study. The main reason for selecting this dataset is the availability of clear definition of
the feature sets. In addition this dataset is constructed particularly to train models using
listwise learning to rank techniques, which is a perfect fit to our goal. Details regarding
how this particular dataset is constructed are briefly presented in Appendix A.
3.6 Summary
To sum up we have reviewed 3 academic papers published focusing on identifying ranking
factors that have high correlation with well ranking webpages. In addition to that we](https://image.slidesharecdn.com/0349a89b-200f-4dd4-9263-3fd4633b1f75-161007132937/85/Aregay_Msc_EEMCS-45-320.jpg)


![Chapter 4. Datasets and Ranking Factors 39
4.1.2 Selecting Search Engine
After collecting the necessary search terms, the next step was to choose a search engine,
to submit the queries in to. Once again since the case study of this research is for The
Netherlands, the main criteria was to find a search engine that is focused on search
queries originating from this region. The second criteria was popularity of the search
engine. Last, the proprietary ”Ranking Scanner” at Indenty (see Section 4.1.3) should
have already implemented a search result page scrapper for the search engine.
We choose Google.nl, the Google version for The Netherlands, because it is dedicated to
handle search queries originating from this region. Most importantly, Google is by far
the largest search engine, and that’s not only the case in the U.S., but worldwide[4]. The
illustration on figure 4.2 was made by SearchMetrics in 2012, and shows that Google
still holds an approximate share of 78% among other search engines. In addition the
”Ranking Scanner” already supports scrapping search result pages from Google.nl.
Figure 4.2: Illustration of current search engines worldwide share made by Search-
Metrics.
4.1.3 Scan SERPs and Fetch Ranked Pages
We used Indenty’s proprietorial crawler called ”Ranking Scanner” to fetch the ranked
webpages on the first 4 SERPs (top 40 pages) of every search query. On Google a single
SERP often lists 10 organic search results, but sometimes this number could be lower](https://image.slidesharecdn.com/0349a89b-200f-4dd4-9263-3fd4633b1f75-161007132937/85/Aregay_Msc_EEMCS-50-320.jpg)

![Chapter 4. Datasets and Ranking Factors 41
Before going further, several general remarks need to be outlined. First, most of the
factors are computed at the webpage level, but some of them are computed at domain
level. Second, some count factors (Continuous variables) are aggregated in a sensible
way. For instance, instead of counting the existence of search term in <B>, <I>, and
<Strong>tags separately we compute sum of the counts and form a new composite
feature.
Note that, not every factor that is included in this research is discussed here. Factors that
are very common and repetitive are not discussed to avoid duplication in the document.
Another remark is, since all factors cannot be measured with one method, we have
classified them into three categories.
• Limited Factors : Limited factors are variables that can take one out of fixed
number of possible values. For example the TLD extension of a domain can be eu,
nl, net or com.
• Dichotomous Factors : Dichotomous factors also known as binary factors are vari-
ables that can take either yes or no for a value. Example EMD and PMD can take
yes or no.
• Unlimited Factors : Unlimited factors also known as continuous factors are vari-
ables that can take value from 0 upto infinity. For example the number of times a
search term appear inside the text between <Body>tags is unlimited.
4.2.1 URL Related Factors
URL related factors are factors that are extracted from the URL of each webpage. A
total of 12 variables are extracted for each URL on the DUTCH WEB dataset. A
detailed description of all the 12 variables will be presented in this section. Earlier to
that some terms which are used in the context are briefly discussed.
What is Uniform Resource Locater ?
A uniform resource locater, abbreviated as URL (also known as web address, particularly
when used with HTTP), is a specific character string that constitutes a reference to a re-
source. An example of a typical URL would be ”http://www.utwente.nl/onderwijs/
websites_opleidingen/”. A URL is technically a type of Uniform Resource Identifier
(URI). URLs are commonly used for webpages (HTTP), but can also be used for file
transfer (ftp), email (mailto) and many other applications[27]. Before discussing the](https://image.slidesharecdn.com/0349a89b-200f-4dd4-9263-3fd4633b1f75-161007132937/85/Aregay_Msc_EEMCS-52-320.jpg)
![Chapter 4. Datasets and Ranking Factors 42
factors related to URL, it is important to understand the basic parts that make up a
URL. Some of the basic parts of URL are described below:
Figure 4.3: The structure of SEO friendly URL
Figure 4.4: The structure of old dynamic URL.
• Protocol : Each URI begins with a protocol identifier and ends by a colon and two
forward slashes. The protocol identifier indicates the name of the protocol to be
used to fetch the resource. For example Hypertext Transfer Protocol (HTTP) is
typically used protocol to serve up hypertext documents. HTTP is just one of many
different protocols used to access different types of resources on the net. Other
protocols include Hypertext Transfer Protocol Secure (HTTPS), File Transfer Pro-
tocol (FTP), Gopher, File, and News 1. Although protocols are case insensitive,
the canonical form is lowercase[27]. An implementation should accept uppercase
letters as equivalent to lowercase in protocol identifiers (e.g., allow ”HTTP” as
well as ”http”).
• Domain Name : Domain names serve as more easily memorable names for Internet
resources such as computers, networks, and services. A domain name consists of
one or more parts, technically called labels, that are conventionally concatenated,
and delimited by dots, such as example.com. The only valid characters for a
domain name are letters, numbers and a hyphen ”-”. Other special characters like
1
http://docs.oracle.com/javase/tutorial/networking/urls/definition.html](https://image.slidesharecdn.com/0349a89b-200f-4dd4-9263-3fd4633b1f75-161007132937/85/Aregay_Msc_EEMCS-53-320.jpg)
![Chapter 4. Datasets and Ranking Factors 43
the underscore or an exclamation mark are NOT permitted. For example: your_
name.com is incorrect because it contain underscore, where as your-name.com is
a correct domain name.
• Top-Level Domain : The top-level domains (TLDs) such as com, net and org
are the highest level of domain names of the Internet. The right-most label of
every domain name conveys the top-level domain; for example, the domain name
www.example.com belongs to the top-level domain com. In other words, every
domain name ends with a top-level domain label. The list below summarizes this:
– URL: http://www.example.net/index.html
– Top-level domain name: net
– Second-level domain name: example.net
– Hostname: www.example.net
• Second-Level and Lower Level Domains : Below the top-level domains in the
domain name hierarchy are the second-level domain (SLD) names. These are the
names directly to the left of .com, .net, and the other top-level domains. As an
example, in the domain example.co.uk, co is the second-level domain. There can
be third, fourth, fifth-level domains, and so on, with virtually no limitation.
• Subdomain : The hierarchy of domains descends from the right to the left label
in the name; each label to the left specifies a subdivision, or subdomain of the
domain to the right. For example: example.com is a subdomain of the com do-
main, and in www.example.com www is a subdomain of example.com. The full
domain name may not exceed a total length of 253 ASCII characters in its textual
representation[28].
• Hostname : A hostname is a domain name that has at least one associated IP
address. For example, the domain names www.example.com and example.com are
also hostnames, whereas the com domain is not. However, other top-level domains,
particularly country code top-level domains, may indeed have an IP address, and
if so, they are also hostnames. Hostnames impose restrictions on the characters
allowed in the corresponding domain name. A valid hostname is also a valid domain
name, but a valid domain name may not necessarily be valid as a hostname.
• Path/Folders : The path or folder (see Figure 4.3) component contains data,
usually organized in hierarchical form, that, along with data in the non-hierarchical
query component serves to identify a resource within URI. The path is terminated
by the first question mark (”?”) or number sign (”#”) character, or by the end of
the URI. A path consists of a sequence of path segments separated by a slash(”/”)
character.](https://image.slidesharecdn.com/0349a89b-200f-4dd4-9263-3fd4633b1f75-161007132937/85/Aregay_Msc_EEMCS-54-320.jpg)


![Chapter 4. Datasets and Ranking Factors 46
http://195.193.209.12/subdomain/document.pdf) often return ”false” for this
check. Similarly URLs which are pointing to pages with error (e.g. ”HTTP 404 :
Page Not Found”) or simply invalid URLs also returned ”false” for this check.
4. URL DOMAIN IS VALID : Indicates whether the domain is a syntactically valid
domain name using lenient validation. Specifically, validation against RFC 3490
4 (”Internationalizing Domain Names in Applications”) is skipped. Some URLs,
even if they does not have a valid public suffix happen to have a valid domain (i.e.
URL DOMAIN IS VALID was set to ”true”). On the other hand all URLs with
invalid domain were immediately treated as if they don’t have public suffix (i.e.
URL HAS PUBLIC SUFFIX was set to ”false”).
5. URL SEARCH TERM OCCURRENCE COUNT IN URL PATH : This factor sim-
ply contains the number of occurrences of a search term in the URL’s path part.
This particular URL’s path from our dataset (/technology-built-environment/
electrotechnology/welcome_electrotechnology/welcome_electrotechnology_
home.cfm) contains the search term ”electrotechnology” 3 times. The string
matching is configured both for exact match and partial match.
6. URL DEPTH : Depth of a URL is determined by counting the number of ”/” in
it’s path part. The following two URLs have URL DEPTH of 1 : http://www.
youtube.com/playlist?list=PLxzMZI, and http://www.sub-domain.com/. While
the following has a URL DEPTH of 2 : http://nl.wikipedia.org/wiki/seo.
7. URL PROTOCOL : HTTP (HyperText Transfer Protocol) is the basic transport
protocol of the Web. The Web is a client/server system and some mechanism
needs to exist to move data between servers and clients. HTTP provides that
mechanism. Most Web browsers also uses other protocols, such as FTP, but the
vast majority of Web traffic is moved by HTTP. On the other hand nearly all secure
web communication takes place over HTTPS including online banking, e-mail, and
e-commerce transactions[29]. As of 2013-09-02, 24.6% of the Internet’s 168088
most popular web sites have a secure implementation of HTTPS[30]. In addition,
Google’s Matt Cutts5 said he would like to give ranking boost to websites that
have implemented SSL6. All these indicate that website security is still a hot topic :
and we suspect that search engines might prefer webpages that have implemented
HTTPS, and rank them on the top. Motivated by this, we conducted an analysis
to find out if there is any kind of relationship between URLs protocol (HTTP or
HTTPS) and it’s rank and the result are presented in Appendix C.2.1.
4
http://www.ietf.org/rfc/rfc3490.txt
5
http://www.mattcutts.com/blog/(Jun10,2014)
6
http://www.seroundtable.com/google-ssl-ranking-18256.html(June 10, 2014)](https://image.slidesharecdn.com/0349a89b-200f-4dd4-9263-3fd4633b1f75-161007132937/85/Aregay_Msc_EEMCS-57-320.jpg)
![Chapter 4. Datasets and Ranking Factors 47
8. URL PUBLIC SUFFIX : This factor holds the public suffix of each URL.
9. URL TOP PRIVATE DOMAIN : This factor holds the TLD of each URL. The
top 25 most abundant TLDs as well as eTLDs are given in Appendix C.3.
4.2.2 Social Media Links On Page
This section provides details about factors which are related to social media in the
DUTCH WED dataset. We give a special emphasis to the social media influence on
webpage’s ranking because of the fact that the number of social media activity has been
growing rapidly in recent years. Visitors like to share and recommend contents with
their own network. This makes it important to have ”Share”, ”Like Us”, ”Recommend”
etc links/buttons on company’s websites and blogs. All the factors included in this
category are on-page factors : which are features that can be found and extracted from
the content and coding of webpages. It was not feasible to collect all the factor that
was initially planned, mainly because of technical barriers and partially due to time
limitation. We checked links for Facebook fan page, Google Plus fun page, Twitter
page, LinkedIn page etc. Since the factors are extracted in a similar fashion only one of
them is discussed below.
1. FACEBOOK FOLLOW US LINK ON SITE : It is no secret that Facebook has
become a major traffic driver for all types of websites. And we believe there are
Facebook ”Like” and ”Recommend” widgets on almost every website. We wanted
to see the relationship between this factor and a webpage’s position on Googl.nl.
Gathering links from a website that are pointing to the websites’s Facebook fun
page is bit tricky. First of all, the plugin code for the ”Like” or ”Follow Us” widgets
come in HTML5, XFBML, IFRAME and URL formats. Hence, a check for all the
formats is implemented, then duplicated and black listed links are removed. The
following box shows the checks implemented for different format of the ”Like”
button on a website using Jsoup in Java.
HTML5 : doc.select("[data-href*=www.facebook.com]")
XFBML : doc.select("[href*=www.facebook.com]")
IFRAME : doc.select("iframe[title*=Facebook][src*=www.facebook.com]")
4.2.3 Markups
Some of the markup related factors we extracted are briefly discussed here.](https://image.slidesharecdn.com/0349a89b-200f-4dd4-9263-3fd4633b1f75-161007132937/85/Aregay_Msc_EEMCS-58-320.jpg)
![Chapter 4. Datasets and Ranking Factors 48
1. GOOGLE PLUS PUBLISHER MARKUP ON SITE : One advantage of having
this markup on a website is that when branded search queries are made in Google,
the Knowledge Graph (see Section 2.3) for that query should display a widget
for that brand’s corresponding Google+ page which includes: the name of the
Google+ page, number of followers of the page, last update from the page and an
option to follow the page for logged in users. Checking for this markup on the
page source of a website was pretty much straight forward as it is implemented
only in the following two formats.
<link href="[Google+ Page URL]" rel=publisher />
<a href="[Google+ Page URL]" rel="publisher">Google+</a>
2. TWITTER CARD MARKUP ON SITE : With Twitter Cards, one can attach
rich photos, videos and media experience to Tweets that drive traffic to his/her
website. By adding a few lines of HTML to a webpage, users who Tweet links
to the content of that webpage will have a ”Card” added to the Tweet that is
visible to all of their followers. The following snippet shows how we extracted this
markup from the page source of a website using Jsoup in Java.
doc.select("meta[name=twitter:card]")
3. FACEBOOK OPEN GRAPH MARKUP ON SITE : Facebook’s Open Graph pro-
tocol allows for web developers to turn their websites into Facebook ”graph” ob-
jects, allowing a certain level of customization over how information is carried over
from a non-Facebook website to Facebook when a page is ”recommended”, ”liked”,
or just generally shared. All of Facebook’s Open Graph META tags are prefixed
with og : then continued with the specific property to be set.
4. NO FOLLOW MARKUP ON SITE : This markup provides a way for webmasters
to tell search engines ”Do not follow links on this page”7. More importantly,
instead of telling search engines and bots not to follow any links on the page, it
lets webmasters to easily instruct robots not to crawl a specific link. For example:
<a href="signin.php" rel="nofollow">sign in</a>
Would it affect ranking if too many of this markup are discovered on the links in a
webpage. To answer this question we analyzed this factor by counting the number
of times it occurred in a page.
7
https://support.google.com/webmasters/answer/96569?hl=en](https://image.slidesharecdn.com/0349a89b-200f-4dd4-9263-3fd4633b1f75-161007132937/85/Aregay_Msc_EEMCS-59-320.jpg)


![Chapter 4. Datasets and Ranking Factors 51
on his HITS algorithm[31], a good authority represented a page that was linked by many
different hubs. MajesticSEO api allow access to several Backlink related information.
It is almost disappointing that we are not able to gather the famous PageRank, for
understandable reasons (see Chapter 5).
For outlinks, we extracted three factors : links pointing to internal pages (i.e. with same
domain name), links pointing to external pages, and total number of all links found in
page.
Table 4.3: Backlinks and outlinks related factors
# Factor Category Description
1 Number of Backlinks Unlimited the total number of inbound links of
the website.
2 Indexed URLs Unlimited the total number of indexed URLs
of the website
3 Referring IP addresses Unlimited the total number of IP addresses re-
ferring to the website. This factor
is good to have to avoid link spam
farms.
4 Referring domains Unlimited the total number of unique domains
referring to the website.
5 Internal Links on Page Unlimited number of links found on a page
that point to internal pages (pages
of same website).
6 External Links on Page Unlimited number of links found on a page that
point to other websites.
7 All Links on Page Unlimited total number of links found on a
page.
4.3 Summary
To sum up this part of this document is written to report the data gathering and fea-
ture extraction process followed. A total number of 7568 unique Dutch search terms are
considered in this research. Top 40 ranked webpages for each search term on Google.nl](https://image.slidesharecdn.com/0349a89b-200f-4dd4-9263-3fd4633b1f75-161007132937/85/Aregay_Msc_EEMCS-62-320.jpg)

![Chapter 5
Algorithms and System Design
The goal of this chapter is, first to clearly present the mathematical definition of the
rank correlation coefficient equations utilized in this research. Then, to discuss the
algorithms designed to implement these equations and the constraints considered. Lastly,
to briefly discuss the high level system design, the technologies used and the challenges
encountered.
5.1 Correlation Coefficients
When ever there is a need to know if two variables are related to each other, we usually
compute a correlation coefficient. The “correlation coefficient” was coined by Karl Pear-
son in 1896. Accordingly, this statistic is over a century old, and is still going strong.
It is one of the most used statistics today, second to the mean[32]. The correlation co-
efficient, denoted by r, measures the strength and the direction of a linear relationship
between two variables.
The following points are the accepted guidelines for interpreting the correlation coeffi-
cient:
• Range : Theoretically r can be any value in the interval between +1 and -1,
including the end values ±1.
• Positive correlation : A positive coefficient indicates that two variables systemati-
cally vary in the same direction : as one variable increases in its values, the other
variable also increases in its values. When the value of r is closer to +1, it means
stronger positive association.
53](https://image.slidesharecdn.com/0349a89b-200f-4dd4-9263-3fd4633b1f75-161007132937/85/Aregay_Msc_EEMCS-64-320.jpg)


![Chapter 5. Algorithms and System Design 56
Algorithm 1 Spearman Rank correlation algorithm
1: procedure SpearmanRank(xArray[], yArray[]) xArray holds rank, yArray
holds feature value
2: nx ← xArray.length
3: ny ← yArray.length
4: if nx = ny then
5: throw error dimension mismatch exception
6: else if nx < MIN PAGES nx > MAX PAGES then
7: throw error insufficient dimension exception
8: else
9: if NaNStrategy = REMOV E then
10: nanPositions ← getNaNPositions(xArray, yArray)
11: xArray ← removeV alues(xArray, nanPositions)
12: yArray ← removeV alues(yArray, nanPositions)
13: end if
14: return PearsonsCorrelation(rank(xArray), rank(yArray))
15: end if
16: end procedure
5.1.2 Rank Biserial Correlation
The rank biserial correlation coefficient is computed between one continuous (also re-
ferred as ordinal) and one dichotomous(also referred as binary) variable [23]. The term
“biserial” refers to the fact that there are two groups(Y= 0,1) being observed on the
continuous variable(X). This coefficient, denoted as rrb, is used to measures degree of
relationship between a dichotomous feature(1,0) and the rank of a webpage from which
the feature was extracted. The formula for rank biserial correlation is given below:
rrb =
2(Y1 − Y0)
n
(5.2)
rrb = Rank Biserial correlation coefficient
Y1 = the Y score mean for data pairs with an X score of 1
Y0 = the Y score mean for data pairs with an X score of 0
n = the total number of data pairs
Assume we want to calculate the correlation between a page’s rank(SET A holds rank
instead of position) on Google.nl and the presence of link to the page’s Facebook fan page
on the site(SET B) using rank biserial correlation. The first step is compute the natural
rank of each element in SET A to produce RAKE A, then collect values of RANK A
into to SET Y1 if they have the link or to SET Y0 otherwise. After that, calculate the
mean of the two sets, SET Y1 and SET Y0, to produce Y1 and Y0 respectively, subtract
the second from the first, divide the result by the total number of elements (size of SET
Y1 plus size of SET Y0) to get the coefficient rrb.](https://image.slidesharecdn.com/0349a89b-200f-4dd4-9263-3fd4633b1f75-161007132937/85/Aregay_Msc_EEMCS-67-320.jpg)

![Chapter 5. Algorithms and System Design 58
Algorithm 2 Rank Biserial correlation algorithm
1: procedure RankBiserial(xArray[], yArray[]) xArray holds rank, yArray holds
feature value
2: nx ← xArray.length
3: ny ← yArray.length
4: if nx = ny then
5: throw error dimension mismatch exception
6: else if nx < MIN PAGES nx > MAX PAGES then
7: throw error insufficient dimension exception
8: else
9: j ← 0
10: k ← 0
11: Y0 ← []
12: Y1 ← []
13: for i ← 0, nx − 1 do split the ranks based on their factor values
14: if yArray[i] = 0 then
15: Y0[j] ← xArray[i]
16: j ← j + 1
17: else
18: Y1[k] ← xArray[i]
19: k ← k + 1
20: end if
21: end for
22: if Y0.length < MAX ZERO TOLERANCE then
23: throw error # 0 exceed maximum tolerance
24: end if
25: meanY0 ← 0.0
26: meanY0 ← 0.0
27: meanY0 ← Mean(Y0[]) calculate mean of the ranks
28: meanY1 ← Mean(Y1[])
29: rbc ← 2 ∗ (meanY1 − meanY0)/nx
30: return rbc rbc is the rank biserial correlation coefficient
31: end if
32: end procedure
5.1.3 Generate Rank From Position
As mentioned in the Spearman correlation example, rank is computed by sorting the
position of the webpages per query in descending order and taking the index of each in
the array (starting from 1), after NaN and tie values are handled, using algorithm 3.
Algorithm](https://image.slidesharecdn.com/0349a89b-200f-4dd4-9263-3fd4633b1f75-161007132937/85/Aregay_Msc_EEMCS-69-320.jpg)
![Chapter 5. Algorithms and System Design 59
Algorithm 3 Generate Rank from Position
1: procedure GenerateRank(xArray[]) xArray holds position
2: nx ← xArray.length
3: j ← 0
4: Rank ← []
5: for i ← 0, nx − 1 do
6: Rank[j] ← nx + 1 − xArray[i]
7: end for
8: return Rank[] Rank[] holds the new generated rank
9: end procedure
5.1.4 Mean Correlation
To keep the correlation coefficient independent of the search term, we computed an
average correlation value of each factor over all search terms. While computing the
mean, search term that happen to yield NaN correlation value for a feature are removed
first. Algorithm 4 summarizes the mean computation.
Algorithm
Algorithm 4 Calculate Mean Correlation
1: procedure MeanCorrelation(xArray[]) xArray holds correlation coefficients
of a feature for each search term
2: nx ← xArray.length
3: for i ← 0, nx − 1 do
4: if xArray[i] = NaN then
5: remove(xArray[i])
6: end if
7: end for
8: return Mean(xArray[])
9: end procedure](https://image.slidesharecdn.com/0349a89b-200f-4dd4-9263-3fd4633b1f75-161007132937/85/Aregay_Msc_EEMCS-70-320.jpg)

![Chapter 5. Algorithms and System Design 61
5.2 System Design
From high level view, the system developed while conducting this research contains
four major components. These are : webpage downloader, ranking factor extractor,
correlation calculators and the database. The correlation calculators are basically the
implementation of the algorithms discussed above, so we will not talk about it here. The
rest three are briefly discussed in this section.
5.2.1 Webpage Downloader
For loading and downloading the pages we had three different tools to choose from.
These tools are briefly introduced below.
• PhantomJS : PhantomJS is a headless WebKit scriptable with a JavaScript API.
It has fast and native support for various web standards: DOM handling, CSS
selector, JSON, Canvas, and SVG3. Because PhantomJS can load and manipulate
a webpage, it is perfect to use it for downloading.
A webpage can be loaded, analyzed, and rendered by creating a webpage object.
The following script demonstrates the simplest use of page object. It loads exam-
ple.com and then saves it as an image, example.png.
var page = require(’webpage’).create();
page.open(’http://example.com’, function() {
page.render(’example.png’);
phantom.exit();
});
• Wget : GNU Wget is a free utility for non-interactive download of files from the
Web. It supports HTTP, HTTPS, and FTP protocols, as well as retrieval through
HTTP proxies4.
By default, Wget is very simple to invoke. The basic syntax is:
$ wget [option]... [URL]...
Wget will simply download all the URLs specified on the command line without
interacting, however it does not execute JavaScript scripts on a webpage, and some
pages use JavaScript to load their content. For this reason the pages that were
3
http://phantomjs.org/
4
http://www.gnu.org/software/wget/manual/wget.html#Overview](https://image.slidesharecdn.com/0349a89b-200f-4dd4-9263-3fd4633b1f75-161007132937/85/Aregay_Msc_EEMCS-72-320.jpg)
![Chapter 5. Algorithms and System Design 62
downloaded with Wget didn’t contain all the content the actual page would display
when opened with browser.
• Selenium WebDriver : Is a tool for automating web application testing, and in
particular to verify that they work as expected5. Selenium-WebDriver provides a
handy unified interface that works with a large number of browsers, it works by
making direct calls to the browser using each browser’s native support for automa-
tion. How these direct calls are made, and the features they support depends on
the browser being used.
Selenium-WebDriver allows you to write tests in almost every language you can
imagine (Java in our case). The easiest way to set up a Selenium 2.0 Java project
is to use Maven. Maven will download the Java bindings (the Selenium 2.0 Java
client library) and all its dependencies, and will create the project, using a maven
pom.xml (project configuration) file.
As mentioned earlier Selenium WebDriver can work with many different browsers,
such as Firefox and Internet Explorer. For Firefox, the WebDriver named Fire-
foxDriver, is implemented as an extension. The content of the page might not be
the same if JavaScript is disable when it loads, so it is very important to execute
JavaScript. Since the Firefox driver support Javascript, we choose Selenium Web-
Driver along with FirefoxDriver over the two other options. On top of that, we
find it very easy to set many different preferences using FirefoxDriver. The snippet
code below shows how FirefoxDriver was used to load page source of a webpage
using URL.
...
WebDriver driver = new FirefoxDriver();
driver.manage().timeouts().pageLoadTimeout(180, TimeUnit.SECONDS);
driver.get("http://www.utwente.nl");
String pageSource = driver.getPageSource();
...
The webpage downloader is written in Java with Selenium WebDriver. It reads URL of a
webpage from database, load the page with FirefoxDriver, and store it in local disk with
certain file format. The diagram below [Figure 5.1] depicts the webpage downloading
process.
5
http://docs.seleniumhq.org/docs/03_webdriver.jsp#introducing-webdriver](https://image.slidesharecdn.com/0349a89b-200f-4dd4-9263-3fd4633b1f75-161007132937/85/Aregay_Msc_EEMCS-73-320.jpg)
![Chapter 5. Algorithms and System Design 63
Figure 5.1: Webpage Downloader
The pages are stored with .html extension in following file name format.
[PageId]-[SearchTerm]-[UniqueNumber].html
To speed up the download process it was necessary to create a profile for the Firefox-
Driver and set prefrences. Typing (about : config) on Firefox browser’s address (or
URL) bar displays all possible Firefox preferences, with their status, type and value.
Out of these preferences, options that ignore parts of the page such as CSS, images
while loading are set to make the process faster. Regardless, some exceptional pages
are downloaded with their image and CSS because the images and CSS had full path
on the page’s code. In addition preference such as browser on disk caching, browser on
memory caching, browser offline caching and network caching are also disabled to limit
the browsers memory usage. We also set a preference to limit the wait time and just
skip pages if they’re taking too long to load. For example, I navigate to Google and it
takes like 5 seconds. But then I navigate to some random site 30 seconds passes and the
server still hasn’t responded. To solve such exception, the program catch the timeout
exception and quit the FirefoxDriver and restart it. The maximum load time is set to
180 seconds, if a page can’t be loaded in this time the driver will throw exception. We
keep a log of such pages to try them later.
Another important setting in the webpage downloader is limiting the memory consumed
on FirefoxDriver by plugin-container. A plugin is a piece of software that displays
Internet content that Firefox is not designed to display6. Some common plugins we
encountered in the pages are Adobe Flash, Quicktime, and Silverlight. Each plugin are
loaded separately from Firefox in a plugin-container process, allowing the main Firefox
process to stay open if a plugin crashes. There are as many plugin-container processes
6
https://support.mozilla.org/en-US/kb/What%20is%20plugin-container](https://image.slidesharecdn.com/0349a89b-200f-4dd4-9263-3fd4633b1f75-161007132937/85/Aregay_Msc_EEMCS-74-320.jpg)


![Chapter 6. Results 70
Dutch web, since only 3% of URLs use HTTPS. Our correlation result shows building
huge number of backlinks towards a webpage is immensely important for achieving top
ranking on Google.nl, thus it should get a primary focus. The majority of websites
ranked among the top 40 tends, to a certain extent, to have more text, therefore putting
enough and well contented text on body, description, and image tags of a website is still
part of the SEO basics. As expected, Google.nl does not seem to give any emphasis to
EMD and PMD websites, although most of the EMDs and PMDs are more abundant
on top 10 set compare to top 40 set. In addition, linking from a site to it’s Google+ and
Facebook fan pages shows positive correlation to well ranking on Google.nl.
Note : It must be noted that similar results from other SEO companies such as MOZ
cannot be compared on a perfectly common basis to the results presented here, because
the data gathering was executed at different times.
6.3 Correlation Results : LETOR4.0 Dataset
Here we present the results obtained in an effort to answer the question RQ-2: ”Is it
better to use only the top well ranked pages (e.g top 40) while computing correlation coef-
ficients instead of using all ranked pages per search term?”. We suspect that considering
only the top 40 or top 100 like most other similar studies, might introduce some bias
because it ignores the low ranked pages. Gathering all ranked webpages for a particular
search term from search engines is often impractical and challenging. As a common
practice in Information Retrieval, given a query, only some “possibly” relevant docu-
ments are selected for judgment[20]. The LETOR4.0 dataset contains relatively large
number of ”possibly” relevant documents per search term2, which gives us a chance to
experiment by varying the amount of documents in our input data while computing
correlation coefficients.
We first computed Spearman rank correlation coefficient of each feature (46 features) and
the rank of all webpages (i.e. ground-truth) on the MQ2008-list dataset (computation of
the features is discussed in [33][20]). In order to keep the correlation independent from
each query, we computed the average (mean) over all queries, for each feature. The next
step was to compute the mean Spearman rank correlation coefficient same way but this
time by analyzing only the top 40 ranked webpages. Lastly we repeat same procedure by
analyzing a dataset that contain a combination of top 40 and least 40 ranked webpages.
2
To construct the LETOR dataset, they used the BM25 model to rank all the documents with respect
to each query, then selected the top 1000 documents for each query for feature extraction.](https://image.slidesharecdn.com/0349a89b-200f-4dd4-9263-3fd4633b1f75-161007132937/85/Aregay_Msc_EEMCS-81-320.jpg)
![Chapter 6. Results 71
Figure 6.2: Mean of Spearman rank correlation coefficient of each feature computed
for LETOR4.0-MQ2008-list dataset using top 40, combination of top 40 + least 40,
and all ranked pages.
PageRank
DL of URL
Inlink number
DL of title
Number of slash in URL
Length of URL
DL(Document length) of body
DL of whole document
Number of child page
DL of anchor
TF of URL
TF*IDF of URL
LMIR.DIR of title
LMIR.DIR of whole document
LMIR.DIR of URL
LMIR.JM of body
TF of title
TF*IDF of title
LMIR.ABS of URL
LMIR.ABS of whole document
LMIR.DIR of body
LMIR.DIR of anchor
TF of anchor
TF*IDF of anchor
BM25 of whole document
LMIR.ABS of body
LMIR.ABS of anchor
LMIR.ABS of title
TF(Term frequency) of body
TF of whole document
TF*IDF of body
TF*IDF of whole document
BM25 of body
LMIR.JM of anchor
BM25 of anchor
BM25 of URL
LMIR.JM of title
LMIR.JM of whole document
BM25 of title
LMIR.JM of URL
IDF(Inverse document frequency) of body
IDF of anchor
IDF of title
IDF of URL
IDF of whole document
Outlink number
-0.2 0 0.2 0.4 0.6 0.8 1
0
-0.06
-0.04
0.02
0.04
0.04
0
0
0.02
0.02
0.08
0.08
0.08
0.08
0.08
0.08
0.1
0.1
0.16
0.18
0.34
0.34
0.34
0.32
0.34
0.34
0.36
0.38
-0.06
-0.04
-0.04
0
0.02
0.02
0.04
0.04
0.04
0.06
0.1
0.1
0.1
0.1
0.1
0.1
0.12
0.12
0.12
0.12
0.12
0.12
0.16
0.16
0.16
0.16
0.16
0.16
0.32
0.32
0.44
0.44
0.72
0.72
0.78
0.78
0.78
0.78
0.82
0.82
-0.08
-0.1
-0.1
0.12
0.1
0.12
0.12
0.12
0.16
0.14
0.1
0.1
0.1
0.1
0.22
0.22
0.22
0.22
0.22
0.22
0.44
0.44
0.48
0.48
0.76
0.76
0.78
0.78
0.78
0.78
0.78
0.78
Mean of Spearman Rank Correlation
Coefficient, Top 40 Pages Per Query
Mean of Spearman Rank Correlation
Coefficient, All Pages Per Query
Mean of Spearman Rank Correlation
Coefficient, Top 40 + Least 40 Pages
Per Query
Mean of Spearman rank correlation coefficient [-1 , 1]
FeatureName](https://image.slidesharecdn.com/0349a89b-200f-4dd4-9263-3fd4633b1f75-161007132937/85/Aregay_Msc_EEMCS-82-320.jpg)
![Chapter 6. Results 72
The graph on figure 6.2 illustrates, overall the correlation gets weaker when using top 40
instead of all ranked pages. For most features a relatively stronger correlation is obtained
with set that contains the top 40 and least 40 ranked pages. Also, it is clear by looking at
the graph that, the correlation decreases from top to bottom with slight inconsistency for
all cases. Except for 3 features which shows weak negative correlation and the features
with NaN values, the rest are positively correlated to their ground-truth. Further more
it was surprising to see absolute consistency in the sign of the coefficient (negative or
positive) for all cases : a feature’s correlation sign remained same for all three cases (e.g.
PageRank shows negative correlation in all cases).
At the top of the chart, 5 features which are related to IDF (Inverse Document Fre-
quency), yield mean correlation coefficient equal to NaN. Since these features are query
dependent (or document independent), they are the same for all ranked pages under
a query with normalized value of 0.0. Another feature called ”Outlink number” which
happed to have a normalized value of 0.0 for all queries also give NaN. In the middle
of the chart, 8 features show result (not NaN) only when all pages are considered. For
the other two cases, these futures give a mean correlation coefficient equal to NaN, be-
cause these feature are not found on the top 40 and least 40 ranked pages. The graph
also seems to indicate that certain features related to two weighting schemes : LMIR3
calculated according to [34] and BM254 calculated according to [20] have the highest
correlation with well ranking in all cases. Factors related BM25 are positively strongly
correlated, probably because the relevant documents (≤ 1000) are selected by rank-
ing all documents with BM25 model when making this benchmark dataset. What is
even more interesting is, to see the Pagerank and number of Inlinks, factors which are
widely believed as important ranking factors, are weakly negatively correlated with their
ground-truth in this result. In contrast to a finding in our analysis with the DUTCH
WEB, we see a positive correlation between the depth of a URL (i.e. Number of slashes
in URL) and well ranking on the LETOR4.0 dataset.
To sum up, we can evidently concluded that, the strongest correlation coefficient between
a feature value and the rank of relevant webpages per query, is obtained when a dataset
that contain a combination of top few and least few ranked pages is utilized. That being
said, the number of features which yield NaN correlation coefficient decreases when
larger amount (if not all) ranked pages are considered.
3
LMIR stands for Language Model for Information Retrieval, JM stands for Jelinek-Mercer, DIR
stands for Dirichlet prior and ABS stands for absolute discounting
4
BM25 weighting scheme (BM stands Best Match) is used to measure term weights, recent TREC
tests have shown BM25 to be the best of the known probabilistic weighting schemes.(http://xapian.
org/docs/bm25.html, July 29, 2014)](https://image.slidesharecdn.com/0349a89b-200f-4dd4-9263-3fd4633b1f75-161007132937/85/Aregay_Msc_EEMCS-83-320.jpg)

![Chapter 7
Evaluation
In this chapter we provide the evaluation measures used, our proposed strategies and
results found while answering two core question of this research: SRQ-3.1: ”Is there any
sensible relationship between the calculated correlation coefficient of a ranking factor
(first approach) and it’s corresponding weight assigned by a ranker (second approach)?”
and SRQ-3.2: ”Does considering highly correlated ranking factors give a better perform-
ing ranker, compared to using the whole set of ranking factors?”
7.1 Rank-Based Evaluation Measures
The evaluation measures used in our experiment expects system’s (trained ranker) out-
put in the form of ranked documents derived by scoring function[35]. We used NDCG@K
(NDCG@10) to optimize the training data for both the LETOR4.0 and DUTCH WEB
datasets. The metric used to evaluate on the test data is ERR@K (ERR@10). Both
this two metrics as well as other rank based measurements are briefly explained next:
• Normalized Discounted Cumulative Gain (NDCG) : Valizadegan et al.
[9] defines NDCG as follow, suppose that we have a list of n queries for train-
ing, denoted by Q = {q1, ..., qn}. For each query qk, we have a list of mk
documents Dk = {dk
i , i = 1, ..., mk}, whose relevance to qk is given by a vec-
tor rk = (rk
1, ..., rk
mk
) ∈ Zmk . The ranking function denoted by F(d, q) takes a
document-query pair (d, q) and outputs a real number score. jk
i denotes the rank
of document dk
i within the collection Dk for query qk. The NDCG value for ranking
function F(d, q) is then computed as follow:
74](https://image.slidesharecdn.com/0349a89b-200f-4dd4-9263-3fd4633b1f75-161007132937/85/Aregay_Msc_EEMCS-85-320.jpg)
![Chapter 7. Evaluation 75
L(Q, F) =
1
n
n
k=1
1
Zk
mk
i=1
2rk
i
log 1 + jk
i
(7.1)
Where Zk is the normalization factor. NDCG at position k for query q is computed
as follow (explanatory example is provided at APPENDIX B.1):
NDCG@k = Zk
k
j=1
(2c(j))
log 1 + j
(7.2)
• Expected Reciprocal Rank (ERR) : This metric is defined as the expected
reciprocal length of time that the user will take to find a relevant document.
The metric supports graded relevance judgments and assumes a cascade browsing
model. In this way, the metric quantifies the usefulness of a document at rank i
conditioned on the degree of relevance of the items at ranks less than i[36].
ERR =
n
r=1
1
r
P (7.3)
Where n is the number of documents in the ranking. P is the probability of the
user stopping at position r.
• Winner Take All (WTA) : For query q, if top ranked document is relevant:
WTA(q) = 1; otherwise WTA(q) = 0. It do not care about other documents,
averaged over all queries1.
• Mean Reciprocal Rank (MRR) : For query q, rank position of the first
relevant document is denoted as R(q), documents ranked below R(q) are not con-
sidered.
1
R(q)
is used as the measure for query q and averaged over all queries2.
• Mean Average Precision (MAP) : It is precision at position n for query q3
P@n =
#relevant : documents : in : top : n : results
n
(7.4)
Average precision for query q:
AP =
ΣP@n ∗ I(document : n : in : relevant)
#relevant : documents
(7.5)
1
http://en.wikipedia.org/wiki/Winner-take-all
2
http://web.stanford.edu/class/cs276/handouts/EvaluationNew.ppt
3
https://www.kaggle.com/wiki/MeanAveragePrecision](https://image.slidesharecdn.com/0349a89b-200f-4dd4-9263-3fd4633b1f75-161007132937/85/Aregay_Msc_EEMCS-86-320.jpg)
![Chapter 7. Evaluation 76
7.2 Evaluation Strategies
Here, we present our two proposed evaluation strategies, the steps followed to execute
them and the results obtained.
Strategy-1 : Relationship Between Correlation and Weight
The objective of this evaluation strategy is to show if there is sensible relationship
between the correlation coefficients of features to their ground-truth/Google rank AND
corresponding weight assigned to features by ranking function. Formally, we intend to
answer SRQ-3.1: ”Is there any sensible relationship between the calculated correlation
coefficient of a ranking factor (first approach) and it’s corresponding weight assigned by
a ranker (second approach)?”. We hypothesize that there is a linear relationship between
the correlation coefficients and weight of a certain factor. In other words, we wish to
see that highly correlated features also have higher assigned weight by trained ranker.
The strategy is executed based on the following basic approach : Given a set of web-
pages P = (p1, p2, ..., pn), factors extracted from each webpage i Fi = (f1, f2, ..., fn),
pre-calculated Google ranking G = (1, 2, ..., n) for the DUTCH WEB dataset (or pre-
calculated ground-truth for the LETOR dataset) and a listwise ranking algorithm A,
the goal is to find a set of weights W = (w1, w2, ..., wm) that are assigned by the ranking
algorithm to ranking factors, and compare it to the set of pre-calculated Spearman rank
correlation coefficients of ranking factors S = (s1, s2..., sn).
A set of correlation coefficients S is calculated and discussed in chapter 6, hence below we
only discuss the steps we pass through while training a ranking function on the DUTCH
WEB dataset and the LETOR4.0 dataset particularly the MQ2008-list version4 to get
a set W of weights assigned for each ranking factor.
First, the ranking algorithm we worked on uses listwise approach of learning to rank,
therefore we had to make our dataset suitable by finding a way to add ground-truth to
the query-document pairs. In a similar situation, Cao et al. [16] on their experiment of
listwise methods (i.e. ListNet) with different datasets such as TREC5 and OHSUMED6,
simply used the ’rank’ of related documents to obtain the ground truth (i.e., the ranking
list of true scores) for each query. In the same way, since we do not have relevance
judgment for DUTCH WEB dataset, we made an assumption that, the ranked list of
webpages fetched from Google.nl are ordered according to their relevance value, with
4
The MQ2008-list dataset can be fetched from this link : http://research.microsoft.com/en-us/
um/beijing/projects/letor/LETOR4.0/Data/MQ2008-list.rar(June 10, 2014)
5
A dataset obtained from web track of TREC 2003
6
A benchmark dataset for document retrieval](https://image.slidesharecdn.com/0349a89b-200f-4dd4-9263-3fd4633b1f75-161007132937/85/Aregay_Msc_EEMCS-87-320.jpg)
![Chapter 7. Evaluation 77
most relevant page on the top. Therefore we calculated a set G that contains rank of
every ranked webpages per search term generated from their position on Google.nl using
algorithm 3 and consider it as our ground-truth.
Second, it was necessary to choose an algorithm A such that it is easier to extract the
weight of each factor from the trained model after training is completed. We first ex-
periment with LambdaMART which is the boosted tree version of LambdaRank. This
method has proven to be successful algorithm for solving ranking problems, by woning
Track 1 of the 2010 Yahoo! Learning to Rank Challenge [37]. It worked perfect with
the DUTCH WEB as well as the LETOR4.0 datasets, but the trained model is build
in tree format, which made it hard to select single weight assigned for each feature.
Later, we discovered that Coordinate Ascent gives an optimized single weight for each
feature which fits to our goal. The relative value of each feature implies to the relative
importance of the features. Coordinate ascent has been used for the purpose of feature
selection for its characteristics of optimizing multivariate objective function by sequen-
tially doing optimization in one dimension at a time. It cycles through each parameter
and optimizes over it while fixing all the others. Dang and Croft [8] proposed feature
selection that uses Coordinate Ascent to combine subset feature into single feature.
Similarly, Metzler and Croft [38] have proposed a listwise linear model for information
retrieval which uses Coordinate Ascent to optimize the model’s parameter.
Third, the RankLib7 package requires maximum number of ground-truth (which is 4 by
default) to be inputed as argument in order compute the ERR@10 metric. However we
could not find any information regarding this, so we wrote small script to extract the
maximum number of ground-truth used in the dataset which was : 1831. The maximum
ground-truth value per query-document pairs varies from query id to query id.
Fourth, we trained five models using five-fold cross validation on the MQ2008-list dataset.
Each fold contains the whole dataset divided into 60% (471 queries : 540679 documents)
training subset, 20% (157 queries : 180664 documents) validation subset and 20% (156
queries : 180877 documents) test subset. After training five different models using
the training subsets, we select the model that yielded the highest NDCG@10 on the
validation set. It was then evaluated using the test set and the performance was mea-
sured with ERR@10. We set different general and algorithm specific parameters. As
mentioned earlier the algorithm used is Coordinate Ascent and the whole feature set is
utilized. Zscore is used to normalize the data before using it for training. For computing
ERR@10, the largest ground-truth value in listwise approach was set to 1831. We set
the number random restarts to 5 to avoid local extrema. The number of iterations to
7
RankLib is a library of learning to rank algorithms. Currently it has implemented 8 popular
algorithms, among them 4 are listwise approaches (AdaRank, ListNet, Coordinate Ascent and Lamb-
daMART)](https://image.slidesharecdn.com/0349a89b-200f-4dd4-9263-3fd4633b1f75-161007132937/85/Aregay_Msc_EEMCS-88-320.jpg)
![Chapter 7. Evaluation 78
search in each direction was set to 25. We train the ranker until observing a drop on the
NDCG@10 between two consecutive iteration that is below a tolerance value of 0.001
(see Appendix B for details).
Fifth, the final step was to plot a graph [Figure 7.1(A)] with the mean Spearman rank
correlation coefficients of each feature on Y-axis (i.e. S), against the ranks of weights
of the features obtained from the previous step on X-axis (i.e. rank(W), highest weight
= 1st rank). A single dot represents the intersection of X-Y pair of a single feature and
is labeled by (x,y) values. We plot the rank of a feature’s weight instead of the actual
value in order to improve the readability of the graph. Since 6 features turn out to have
NaN correlation coefficient the graph shows only 40 dots. Full list of feature id, mean
Spearman rank correlation coefficient, Coordinate Ascent feature weight is provided on
Appendix B.
The steps discussed above are repeated on the DUTCH WEB dataset, and the results
are provide on Figure 7.1(B).](https://image.slidesharecdn.com/0349a89b-200f-4dd4-9263-3fd4633b1f75-161007132937/85/Aregay_Msc_EEMCS-89-320.jpg)
![Chapter 7. Evaluation 79
Figure 7.1: Weights of features assigned by Coordinate Ascent sorted in descending
order (highest weight assigned 1st
rank) versus corresponding mean Spearman rank
correlation coefficients of features, computed for LETOR4.0 - MQ2008-list(A) and
DUTCH WEB(B) datasets, each point is labeled with (x,y).
0 5 10 15 20 25 30 35 40 45 50
-0.2
0
0.2
0.4
0.6
0.8
1
(1,0.04)(2,0.82)(3,0.32)(4,0.06)(5,-0.06)(6,0.16)(7,0.1)(8,0.12)(9,0.16)(10,0.44)(11,0.02)(12,0.82)(13,0.12)(14,0.1)(15,0.78)(16,0.12)(17,0.12)(18,0.78)(19,-0.04)(20,0.78)(21,0.16)(22,0.16)(23,0.44)(24,0.1)(25,0.02)(26,0)(27,0.12)(28,0.1)(29,0.1)(30,0.12)(31,-0.04)(32,0.1)(33,0.16)
(39,0.16)(40,0.78)
(42,0.72)(43,0.72)(44,0.04)(45,0.32)(46,0.04)
A. LETOR4.0-MQ2008-list Dataset
Weight rank
Correlationcoefficient[-1,1]
0 10 20 30 40 50 60
-1.5
-1.0
-0.5
0.0
0.5
1.0
1.5
(1,-1.00)
(2,-0.13)
(3,-0.96)
(4,-0.94)
(5,-0.72)
(6,-0.27)
(7,-0.19)
(8,-0.36)
(9,-0.29)
(10,-0.89)
(11,-0.49)
(12,0.04)
(13,-0.65)
(14,-0.02)
(15,0.04)
(16,-0.60)
(17,-0.03)
(18,-0.05)
(19,-0.08)
(20,-0.32)
(21,0.05)
(22,-0.18)
(23,-0.08)
(24,0.08)
(25,-0.68)
(26,0.02)
(27,0.01)
(28,-0.14)
(29,-1.00)
(30,-0.09)
(31,-0.30)
(32,0.02)
(33,0.06)
(34,0.07)
(35,0.05)
(36,0.01)
(37,0.10)
(38,0.10)
(39,-0.11)
(40,-0.14)
(41,-0.05)
(42,0.05)
(43,0.06)
(44,-0.13)
(45,-0.36)
(46,-0.15)
(47,0.02)
(48,-0.96)
(49,-0.18)
(50,1.00)
(51,-0.68)
(52,1.00)
B. DUTCH WEB Dataset
Weight rank
Correlationcoefficient[-1,1]](https://image.slidesharecdn.com/0349a89b-200f-4dd4-9263-3fd4633b1f75-161007132937/85/Aregay_Msc_EEMCS-90-320.jpg)


![Chapter 6. Conclusion and Future Work 88
8.2.2 Long-Tail Keywords
As described in Chapter 4 a majority of the search terms used in this research contains
two or three words (keywords). A similar research could be conducted by constructing set
of search terms which are long-tail, with a goal of discovering a relationship between long-
tail search terms and the ranking factors used in well ranked pages on a certain search
engine. Long-tail keywords are longer, more specific keywords that are less common,
individually, but add up to account for the majority of search-driven traffic5. Long-tail
keywords are the opposite of ”head” terms, which are more popular or more frequently
searched on. For example, ”fish tanks” is a head term, but ”compare prices whisper
aquarium filters” is a long-tail keyword. Long-tail keywords can offer incredible ROI6
because they are less competitive to rank well on organic search result and less expensive
to bid on for Pay Per Click (PPC).
8.2.3 Social Signals
Social signals also know as social metrics are measurement tools that can be used to
define and articulate social value, social outcomes and the results generated by invest-
ment and activities in the social sector [39]. In other words social metric is an indicator
that measures the social media activities of a website. For instance the number of likes
on Facebook fan page of a given company is a good example of social signals. Social
indicators that can be extracted from the site of a webpage such as existence of a link
to Facebook fan page from a webpage, are included in this research. However social
metrics that are external to the page were ignored, because it was difficult to collect
the data. It would be nice to see a result that shows any direct/indirect relationship
between these social signals and well ranking webpages.
8.2.4 Ground-Truth
While constructing a dataset suitable for LETOR we made an assumption and use the
position of each webpage on Google.nl as ground-truth. It would be nice to see a research
that finds a way to avoid this assumption and come up with more concrete result.
5
http://www.wordstream.com/long-tail-keywords
6
Return Over Investment](https://image.slidesharecdn.com/0349a89b-200f-4dd4-9263-3fd4633b1f75-161007132937/85/Aregay_Msc_EEMCS-99-320.jpg)
![Chapter 6. Conclusion and Future Work 89
8.2.5 Special Sample
Considering only the top 40 search results (i.e. the approach of this research) of every
search query could introduce some bias on the conclusion to be drawn from the experi-
ment as it does not contemplate the pages ranking low on the result list. To avoid this,
we suggest next researchers to collect a special dataset containing search terms with total
number of search result in a defined range (e.g. in a range of 100 to 125 search terms).
For instance, the search terms could be constructed based on the following scheme :
search terms = ”restaurants in” + [Netherlands city name]
e.g. ”restaurants in Enschede”, ”restaurants in Hengelo”, ”restaurants in Lochem” etc..
The main reason to follow this scheme for constructing the search terms is based on the
following assumptions and criteria:
• Most cities have restaurants, therefore result is expected for all queries.
• Restaurants are very well engaged with social media activities, which suits with
the desire to investigate on social media activities and ranking.
• A total of 143 cities (small, medium-sized and big cities78 ) from 12 provinces
could be included in the dataset .
• An ”exact match” search could be used to narrow down the search results, therefore
analyze all ranking pages. Based on our quick search on Google.com, the search
term ”restaurants in Amsterdam” gives 149 results.
N.B. The number of results Google display on the first result page is an estimation
which is normally way bigger than the actual number. To see actual number of
results found on a particular query, one should go to the very last of the result
pages.
7
The general consensus is that a city constitutes a population of more than 30,000-50,000 inhabitants.
Cities with between 100,000 and 250,000 inhabitants are mostly called ’middelgrote steden’ (medium-
sized cities), while the use of ’grote steden’ (big cities) is usually reserved for Amsterdam, Rotterdam,
The Hague and Utrecht
8
http://nl.wikipedia.org/wiki/Nederlandse_gemeente](https://image.slidesharecdn.com/0349a89b-200f-4dd4-9263-3fd4633b1f75-161007132937/85/Aregay_Msc_EEMCS-100-320.jpg)

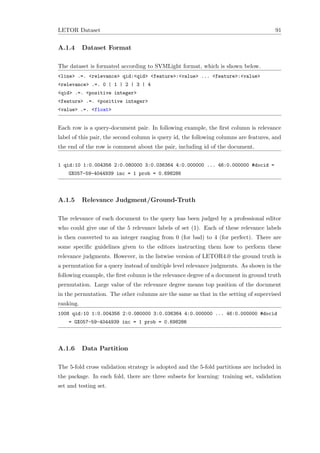
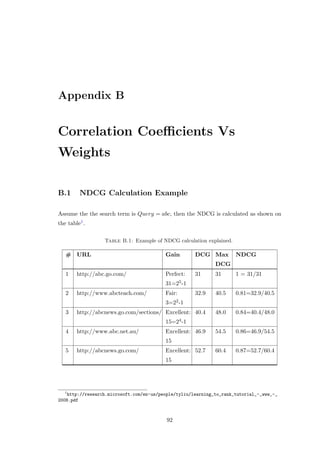


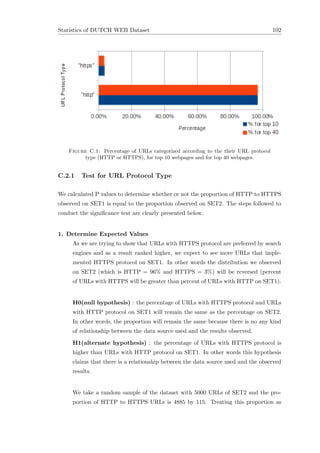
![Statistics of DUTCH WEB Dataset 103
expected value, we wish to see same proportion on another random sample of the
same size taken from SET1.
2. Determine Observed Result
Next we analyze the proportion of HTTP to HTTPS on another sample of the same
size (5000 URLs) take from SET1. That will give us our actual (or ”observed”)
values. Since we have changed the data source, the observed results might differ
from the expected results. There are two possibilities to explain this: either this
happened by chance, or changing the data source caused the difference.
We randomly select 5000 URLs from SET1. We find that 4867 were HTTP and 133
were HTTPS. These differ from our expected results of 4885 and 115, respectively.
P value will help us determine whether our experimental manipulation (in this
case, changing the source of our data from SET2 to SET1) cause this change in
results, or is this a negligible difference and we’re just observing a chance variation?
3. Determine Degrees of Freedom
The equation for degrees of freedom is DegreesofFreedom = n − 1 , where n is
the number of categories or variables being analyzed in our analysis. Our analysis
has two categories of results: URLs with HTTP protocol and URLs with HTTPS
protocol. Thus, we have 2-1 = 1 degree of freedom.
4. Calculate Chi Square
We calculated chi square to get the difference between the observed and expected
values of the analysis. The formula for chi square is provided in Section 3.2.7.
Putting the values we found in to the formula [3.5] we will get a chi square value
of 2.88. x2 = ((4867 − 4885)2/4885) + (133 − 115)2/115) = 2.88.
5. Determine the Significance Level
As explained in previous chapter(Section 3.2.6) significance level is a measure
of how confident we want to be with our result. For our analysis we choose a
significance level of 0.05. Which means there is a 5% probability that the difference
occurred was due to pure chance. In other words, there is 95% probability that
the difference in the result was caused by the data source used rather than chance.
6. Calculate the P Value
We used chi square distribution table provided by Medcal.org1, and the degree of
freedom (i.e. 1) to approximate the P value. According to this read, the P value
lie between 0.05 and 0.1.
7. Decision
Our P value is between 0.05 and 0.1 which is greater than our significance level
1
http://www.medcalc.org/manual/chi-square-table.php](https://image.slidesharecdn.com/0349a89b-200f-4dd4-9263-3fd4633b1f75-161007132937/85/Aregay_Msc_EEMCS-114-320.jpg)


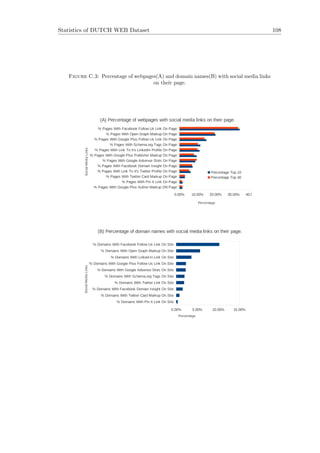

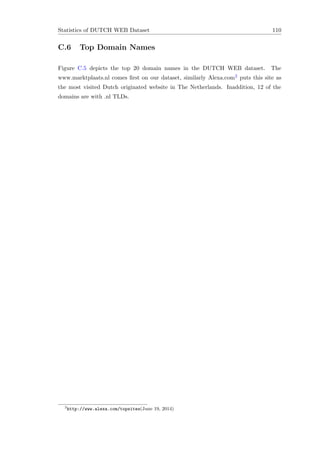


![Bibliography
[1] Albert Bifet, Carlos Castillo, Paul-Alexandru Chirita, and Ingmar Weber. An
analysis of factors used in search engine ranking. In First International Workshop
on Adversarial Information Retrieval on the Web, April 2005.
[2] Ao-Jan Su, Y Charlie Hu, Aleksandar Kuzmanovic, and Cheng-Kok Koh. How to
improve your google ranking: Myths and reality. In Web Intelligence and Intelligent
Agent Technology (WI-IAT), 2010 IEEE/WIC/ACM International Conference on,
volume 1, pages 50–57. IEEE, August 2010.
[3] Michael P Evans. Analysing google rankings through search engine optimization
data. Internet research, 17(1):21–37, 2007.
[4] Marcus Tober, Dr. Leonhard Hennig, and Daniel Furch. Seo ranking factors – rank
correlation 2013 bing usa. SEO Ranking Factors – Rank Correlation 2013 Bing
USA, 1(1), August 2013.
[5] Netmark.com. Google search engine rankings correlational study.
June 2013. URL http://www.netmark.com/google-ranking-factors/
google-ranking-factors-methodology.
[6] Matthew Peters. 2013 search engine ranking factors @ONLINE, July 2013. URL
http://moz.com/blog/ranking-factors-2013.
[7] Google. What is webmaster tools? @ONLINE, 2014. URL https://support.
google.com/webmasters/answer/4559176?hl=en&ref_topic=3309469.
[8] V Dang and W Bruce Croft. Feature selection for document ranking using best first
search and coordinate ascent. In Sigir workshop on feature generation and selection
for information retrieval, 2010.
[9] Hamed Valizadegan, Rong Jin, Ruofei Zhang, and Jianchang Mao. Learning to
rank by optimizing ndcg measure. In NIPS, volume 22, pages 1883–1891, 2009.
[10] Google Inc. Search engine optimization starter guide. 2010.
115](https://image.slidesharecdn.com/0349a89b-200f-4dd4-9263-3fd4633b1f75-161007132937/85/Aregay_Msc_EEMCS-126-320.jpg)
![Bibliography 116
[11] Nick Craswell and David Hawking. Web information retrieval. In Ayse G¨oker and
John Davies, editors, Information Retrieval: Searching in the 21st Century, pages
85–101. Wiley, UK, 2009.
[12] Junaidah Mohamed Kassim and Mahathir Rahmany. Introduction to semantic
search engine. In Electrical Engineering and Informatics, 2009. ICEEI’09. Inter-
national Conference on, volume 2, pages 380–386. IEEE, 2009.
[13] Zoltan Gyongyi and Hector Garcia-Molina. Web spam taxonomy. In First inter-
national workshop on adversarial information retrieval on the web (AIRWeb 2005),
2005.
[14] Fen Xia and Jue Wang. Listwise approach to learning to rank - theory and algo-
rithm. Analysis, pages 1192–1199, 2008. URL http://portal.acm.org/citation.
cfm?id=1390306.
[15] Olivier Chapelle. Yahoo ! learning to rank challenge overview. 14:1–24, 2011.
[16] Zhe Cao, Tao Qin, Tie-Yan Liu, Ming-Feng Tsai, and Hang Li. Learning to rank:
from pairwise approach to listwise approach. In Proceedings of the 24th international
conference on Machine learning, pages 129–136. ACM, 2007.
[17] Kalervo J¨arvelin and Jaana Kek¨al¨ainen. Cumulated gain-based evaluation of ir
techniques. ACM Transactions on Information Systems (TOIS), 20(4):422–446,
2002.
[18] Yining Wang, Wang Liwei, Yuanzhi Li, Di He, Wei Chen, and Tie-Yan Liu. A the-
oretical analysis of ndcg ranking measures. In 26th Annual Conference on Learning
Theory, 2013.
[19] Jen-yuan Yeh, Jung-yi Lin, Hao-ren Ke, and Wei-pang Yang. Learning to rank for
information retrieval using genetic programming. (2).
[20] Tao Qin, Tie-Yan Liu, Jun Xu, and Hang Li. Letor: A benchmark collection for
research on learning to rank for information retrieval. Information Retrieval, 13
(4):346–374, 2010. ISSN 1386-4564. doi: 10.1007/s10791-009-9123-y. URL http:
//dx.doi.org/10.1007/s10791-009-9123-y.
[21] Jerrold H Zar. Significance testing of the spearman rank correlation co-
efficient. Journal of the American Statistical Association, 67(339):578–
580, 1972. URL http://www.jstor.org/discover/10.2307/2284441?uid=
3738736&uid=2&uid=4&sid=21103350012761.
[22] Herv´e Abdi. The kendall rank correlation coefficient. Encyclopedia of Measurement
and Statistics. Sage, Thousand Oaks, CA, pages 508–510, 2007.](https://image.slidesharecdn.com/0349a89b-200f-4dd4-9263-3fd4633b1f75-161007132937/85/Aregay_Msc_EEMCS-127-320.jpg)
![Bibliography 117
[23] Helena Chmura Kraemer. Biserial Correlation. John Wiley and Sons, Inc., 2004.
ISBN 9780471667193. doi: 10.1002/0471667196.ess0153.
[24] Peter J Huber. Robust statistics. Springer, 2011.
[25] Steven N. Goodman. Toward evidence-based medical statistics. 1: The p
value fallacy. Annals of Internal Medicine, 130(12):995–1004, 1999. doi: 10.
7326/0003-4819-130-12-199906150-00008. URL http://dx.doi.org/10.7326/
0003-4819-130-12-199906150-00008.
[26] Stephen Stigler. Fisher and the 5 CHANCE, 21(4):12–12, 2008. ISSN 0933-
2480. doi: 10.1007/s00144-008-0033-3. URL http://dx.doi.org/10.1007/
s00144-008-0033-3.
[27] Larry Masinter, Tim Berners-Lee, and Roy T Fielding. Uniform resource identifier
(uri): Generic syntax. 2005.
[28] Paul V Mockapetris. Domain names: Implementation specification. 1983.
[29] Zakir Durumeric, James Kasten, Michael Bailey, and J Alex Halderman. Analysis
of the https certificate ecosystem. In Internet Measurement Conference, 2013.
[30] Trustworthy internet movement @ONLINE, May 2014. URL https://www.
trustworthyinternet.org/ssl-pulse/. Last Checked : May 19, 2014.
[31] Jon M. Kleinberg. Authoritative sources in a hyperlinked environment. In Proceed-
ings of the Nineth Annual ACM-SIAM Symposium on Discrete Algorithms., 1(1),
May 1998.
[32] Bruce Ratner. Statistical and machine-learning data mining: Techniques for better
predictive modeling and analysis of big data. CRC Press, 2011.
[33] Introducing Letor Datasets, Tao Qin, and Tie-yan Liu. Introducing LETOR 4.0
Datasets. 2009.
[34] Chengxiang Zhai and John Lafferty. A Study of Smoothing Methods for Language
Models Applied to Information Retrieval. 22(2):0–33, 2004.
[35] Stephen Robertson and Hugo Zaragoza. On rank-based effectiveness measures and
optimization. Information Retrieval, 10(3):321–339, 2007.
[36] Olivier Chapelle, Donald Metlzer, Ya Zhang, and Pierre Grinspan. Expected re-
ciprocal rank for graded relevance. In Proceedings of the 18th ACM conference on
Information and knowledge management, pages 621–630. ACM, 2009.](https://image.slidesharecdn.com/0349a89b-200f-4dd4-9263-3fd4633b1f75-161007132937/85/Aregay_Msc_EEMCS-128-320.jpg)
![Bibliography 118
[37] Christopher JC Burges. From ranknet to lambdarank to lambdamart: An overview.
Learning, 11:23–581, 2010.
[38] Donald Metzler and W Bruce Croft. Linear feature-based models for information
retrieval. Information Retrieval, 10(3):257–274, 2007.
[39] Tessa Hebb. Report on social metrics : Key informant interviews. April 2011.](https://image.slidesharecdn.com/0349a89b-200f-4dd4-9263-3fd4633b1f75-161007132937/85/Aregay_Msc_EEMCS-129-320.jpg)


![Saptableref[1]](https://cdn.slidesharecdn.com/ss_thumbnails/saptableref1-120604231254-phpapp01-thumbnail.jpg?width=640&height=640&fit=bounds)