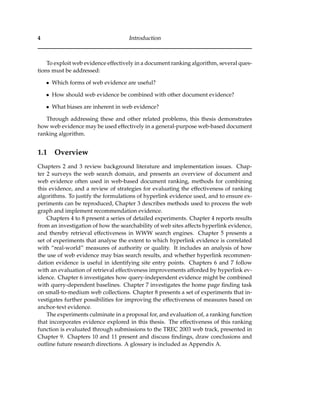
This thesis investigates how web evidence can improve retrieval effectiveness for navigational search tasks. It presents experiments using forms of web evidence like aggregate anchor text and PageRank on web collections. Aggregate anchor text performs well, but hyperlink recommendation algorithms are less useful. Additional gains are made by favoring documents with more anchor text and shorter URLs. The most effective approach treats document and web evidence separately, combining scores linearly. This thesis also examines biases in web evidence and their impact on retrieval.
![This thesis includes experiments published in:
• Upstill T., Craswell N., and Hawking D. “Buying Bestsellers Online: A Case
Study in Search and Searchability”, which appeared in the Proceedings of
ADCS2002, December 2002 [199].
• Upstill T., Craswell N., and Hawking D. “Query-independent evidence in home
page finding”, which appeared in the ACM TOIS volume 21:3, July 2003 [201].
• Craswell N., Hawking D., Thom J., Upstill T., Wilkinson R., and Wu M. “TREC12
Web Track at CSIRO”, which appeared in the TREC-12 Notebook Proceedings,
November 2003 [58].
• Upstill T., Craswell N., and Hawking D. “Predicting Fame and Fortune: Page-
Rank or Indegree?”, which appeared in the Proceedings of ADCS2003, Decem-
ber 2003 [200].
• Upstill T., and Robertson S. “Exploiting Hyperlink Recommendation Evidence
in Navigational Web Search”, which appeared in the Proceedings of SIGIR’04,
August 2004 [202].
• Hawking D., Upstill T., and Craswell N. “Towards Better Weighting of An-
chors”, which appeared in the Proceedings of SIGIR’04, August 2004 [120].
Chapter 9 contains results submitted as “csiro” runs in TREC 2003. The Topic Distilla-
tion runs submitted to TREC 2003 were generated in collaboration with Nick Craswell
and David Hawking. The framework used to tune parameters in Chapter 9 was de-
veloped by Nick Craswell. The first-cut ranking algorithm presented in Chapter 9 was
formulated by David Hawking for use in the Panoptic search system.
Except where indicated above, this thesis is my own original work.
Trystan Garrett Upstill
13 August 2005](https://image.slidesharecdn.com/e71a8712-b24d-4089-ba76-c51104d8fb0e-150913153105-lva1-app6892/85/Upstill_Thesis_Revised_17Aug05-3-320.jpg)


![“In an extreme view, the world can be seen as only connections, nothing
else. We think of a dictionary as the repository of meaning, but it defines
words only in terms of other words. I liked the idea that a piece of infor-
mation is really defined only by what it’s related to, and how it’s related.
There really is little else to meaning. The structure is everything. There
are billions of neurons in our brains, but what are neurons? Just cells. The
brain has no knowledge until connections are made between neurons. All
that we know, all that we are, comes from the way our neurons are con-
nected.”
— Tim Berners-Lee [20]](https://image.slidesharecdn.com/e71a8712-b24d-4089-ba76-c51104d8fb0e-150913153105-lva1-app6892/85/Upstill_Thesis_Revised_17Aug05-17-320.jpg)

![Chapter 1
Introduction
Document retrieval on the World-Wide Web (WWW), arguably the world’s largest col-
lection of documents, is a challenging and important task. The scale of the WWW is
immense, consisting of at least ten billion publicly visible web documents1 distributed
on millions of servers world-wide. Web authors follow few formal protocols, often re-
main anonymous and publish in a wide variety of formats. There is no central registry
or repository of the WWW’s contents and documents are often in a constant state of
flux. The WWW is also an environment where documents often misrepresent their
content as some web authors seek to unbalance ranking algorithms in their favour for
personal gain [122]. To compound these factors, WWW search engine users typically
provide short queries (averaging around two terms [184]) and expect a sub-second
response time from the system. Given these significant challenges, there is potentially
much to be learnt from the search systems which manage to retrieve relevant docu-
ments in such an environment.
The current generation of WWW search engines reportedly makes extensive use
of evidence derived from the structure of the WWW to better match relevant doc-
uments and identify potentially authoritative pages [31]. However, despite this re-
ported use, to date there has been little analysis which supports the inclusion of web
evidence in document ranking, or which examines precisely what its effect on search
results might be. The success of document ranking in the current generation of WWW
search engines is attributed to a number of web analysis techniques. How these tech-
niques are used and incorporated remains a trade secret. It also remains unclear as
to whether such techniques can be employed to improve retrieval effectiveness in
smaller, corporate-sized web collections.
This thesis investigates how web evidence can be used to improve retrieval ef-
fectiveness for navigational search tasks. Three important forms of web evidence
are considered: anchor-text, hyperlink recommendation measures (PageRank vari-
ants and in-degree), and URL hierarchy-based measures. These forms of web evi-
dence are believed to be used by prominent WWW search engines [31]. Other forms
of web evidence reviewed, but not examined, include HITS [132], HTML document
structure [42] and page segmentation [37], information unit measures [196], and click-
through evidence [129].
1
This is necessarily a crude estimate of the WWW’s static size. See Section 2.4 for details.
3](https://image.slidesharecdn.com/e71a8712-b24d-4089-ba76-c51104d8fb0e-150913153105-lva1-app6892/85/Upstill_Thesis_Revised_17Aug05-19-320.jpg)
![Chapter 2
Background
To provide a foundation and context for thesis experiments, this chapter outlines the
web-based document ranking domain. The chapter includes:
• An overview of a generic web search system, outlining the role of document
ranking in web search;
• A detailed analysis of document and web-level evidence commonly used for
document ranking in research and (believed to be used in) commercial web
search systems;
• An exploration of methods for combining evidence into a single ranking func-
tion; and
• A review of common user web search tasks and methods used to evaluate the
effectiveness of document ranking for such tasks.
Where applicable, reference is made throughout this chapter to the related scope
of the thesis and the rationale for experiments undertaken.
2.1 A web search system
A web search engine typically consists of a document gatherer (usually a crawler), a
document indexer, a query processor and a results presentation interface [31]. The
document gatherer and document indexer need only be run when the underlying set
of web documents has changed (which is likely to be continuous on the WWW, but
perhaps intermittent for other web corpora).
How each element which makes up a generic web search system is understood in
the context of this thesis is discussed below.
5](https://image.slidesharecdn.com/e71a8712-b24d-4089-ba76-c51104d8fb0e-150913153105-lva1-app6892/85/Upstill_Thesis_Revised_17Aug05-21-320.jpg)
![6 Background
2.1.1 The document gatherer
Web-based documents are normally1 gathered using a crawler [123]. Crawlers traverse
a web graph by recursively following hyperlinks, storing each document encountered,
and parsing stored documents for URLs to crawl. Crawlers typically maintain a fron-
tier, the queue of pages which remain to be downloaded. The frontier may be a FIFO2
queue, or sorted by some other attribute, such as perceived authority or frequency of
change [46]. Crawlers also typically maintain a list of all downloaded or detected du-
plicate pages (so pages are not fetched more than once), and a scope of pages to crawl
(for example, a maximum depth, specified domain, or timeout value), both of which
are checked prior to adding pages to the frontier. The crawler frontier is initialised
with a set of seed pages from which the crawl starts (these are specified manually).
Crawling ceases when the frontier is empty, or some time or resource limit is reached.
Once crawling is complete,3 the downloaded documents are indexed.
2.1.2 The indexer
The indexer distills information contained within corpus documents into a format
which is amenable to quick access by the query processor. Typically this involves ex-
tracting document features by breaking-down documents into their constituent terms,
extracting statistics relating to term presence within the documents and corpus, and
calculating any query-independent evidence.4 After the index is built, the system is
ready to process queries.
2.1.3 The query processor
The query processor serves user queries by matching and ranking documents from the
index according to user input. As the query processor interacts directly with the doc-
ument index created by the indexer, they are often considered in tandem.
This thesis is concerned with a non-iterative retrieval process, i.e. one without
query refinement or relevance feedback [169, 174, 175, 177]. This is the level of in-
teraction supported by current popular WWW search systems and many web search
systems, most of whom incorporate little relevance feedback beyond “find more like
this” [93] or lists containing suggested supplementary query terms [217].
Although particularly important in WWW search systems, this thesis is not pri-
marily concerned with the efficiency of query processing. A comprehensive overview
of efficient document query processing and indexing methods is provided in [214].
1
In some cases alternative document accessing methods may be available, for example if the docu-
ments being indexed are stored locally.
2
A queue ordered such that the first item in is the first item out.
3
If crawling is continuous, and an incremental index structure is used, documents might be indexed
continuously.
4
Query-independent evidence is evidence that does not depend on the user query. For efficiency
reasons such evidence is generally collected and calculated during the document indexing phase (prior
to query processing).](https://image.slidesharecdn.com/e71a8712-b24d-4089-ba76-c51104d8fb0e-150913153105-lva1-app6892/85/Upstill_Thesis_Revised_17Aug05-22-320.jpg)
![§2.2 Ranking in web search 7
2.1.4 The results presentation interface
The results presentation interface displays and links to the documents matched by the
query processor in response to the user query. Current popular WWW and web search
systems present a linear list of ranked results, sometimes with the degree of match
and/or summaries and abstracts for the matching documents. This type of interface
is modelled in experiments within this thesis.
2.2 Ranking in web search
The principal component of the query processor is the document ranking function.
The ranking functions of modern search systems frequently incorporate many forms
of document evidence [31]. Some of this evidence, such as textual information, is
collected locally for each document in the corpus (described in Section 2.3). Other
evidence, such as external document descriptions or recommendations, is amassed
through an examination of the context of a document within the web graph (described
in Section 2.4).
2.3 Document-level evidence
Text-based ranking algorithms typically assign scores to documents based on the dis-
tribution of query terms within both the document and the corpus. Therefore the
choice of what should constitute a term is an important concern. While terms are
often simply defined as document words (treated individually) [170] they may also
take further forms. For example, terms may consist of the canonical string compo-
nents of words (stems) [163], include (n-)tuples of words [214], consist of a word and
associated synonyms [128], or may include a combination of some or many of these
properties.
Unless otherwise noted, the ranking functions examined within this thesis use
single words as terms. In some experiments ranking functions instead make use of
canonical word stems, conflated using the Porter stemmer [163], as terms. These and
alternative term representations are discussed below.
The conflation of terms may increase the overlap between documents and queries,
finding term matches which may otherwise have been missed. For example if the
query term “cat” is processed and a document in the corpus mentions “cats” it is
likely that the document will be relevant to the user’s request. Stemming methods
are frequently employed to reduce words to their canonical forms and thereby allow
such matches. An empirically validated method for reducing terms to their canon-
ical forms is the Porter stemmer [163]. The Porter stemmer has been demonstrated
to perform as well as other suffix-stemming algorithms and to perform comparably
to other significantly more expensive, linguistic-based stemming algorithms [126].5
5
These algorithms are expensive with regard to training and computational cost.](https://image.slidesharecdn.com/e71a8712-b24d-4089-ba76-c51104d8fb0e-150913153105-lva1-app6892/85/Upstill_Thesis_Revised_17Aug05-23-320.jpg)
![8 Background
The Porter stemmer removes suffixes, for example “shipping” and “shipped” would
become “ship”. In this way suffix-stemming attempts to remove pluralisation from
terms and to generalise words [126],6 sometimes leading to an improvement in re-
trieval system recall [134]. However, reducing the exactness of term matches can
result in the retrieval of less relevant documents [84, 101], thereby reducing search
precision.7 Furthermore, if a retrieved document does not contain any occurrences of
a query term, as all term matches are stems, it may be difficult for a user to understand
why that document was retrieved [108].
In many popular ranking functions documents are considered to be “bags-of-
words” [162, 170, 176], where term occurrence is assumed to be independent and
unordered. For example, given a term such as “Computer” there is no prior probabil-
ity of encountering the word “Science” afterwards. Accordingly no extra evidence
is recorded if the words “Computer Science” are encountered together in a docu-
ment rather than separately. While there is arguably more meaning conveyed through
higher order terms (terms containing multiple words) than in single-word term mod-
els, there is little empirical evidence to support the use of higher-order terms [128].
Even when using manually created word association thesauri, retrieval effectiveness
has not been observed to be significantly improved [128]. “Bags-of-words” algorithms
are also generally less expensive when indexing and querying English language doc-
uments8 [214].
Terms may have multiple meanings (polysemy) and many concepts are repre-
sented by multiple words (synonyms). Several methods attempt to explore relation-
ships between terms to compress the document and query space. The association
of words to concepts can be performed manually through the use of dictionaries
or ontologies, or automatically using techniques such as Latent Semantic Analysis
(LSA) [22, 66]. LSA involves the extraction of contextual meaning of words through
examinations of the distribution of terms within a corpus using the vector space model
(see Section 2.3.1.2). Terms are broken down into co-occurrence tables and then a Sin-
gular Value Decomposition (SVD) is performed to determine term relationships [66].
The SVD projects the initial term meanings onto a subspace spanned by only the “im-
portant” singular term vectors. The potential benefits of LSA techniques are two-fold:
firstly they may reduce user confusion through the compression of similar (synony-
mous or polysemous) terms, and secondly they may reduce the size of term space, and
thereby improve system efficiency [66]. Indeed, LSA techniques have been shown
to improve the efficiency of retrieval systems considerably while maintaining (but
not exceeding) the effectiveness of non-decomposed vector space-based retrieval sys-
tems [22, 43]. However, the use of LSA-based algorithms is likely to negatively affect
navigational search (an important search task, described in Section 2.6.2) as the mean-
ing conveyed by entity naming terms may be lost.
6
Employing stemming prior to indexing reduces the size of the corpus index however the discarded
term information is then lost. As an alternative stemming can be applied during query processing [214].
7
The measures of system precision and recall are defined in Section 2.6.6.1
8
The use of phrase-optimised indexes can improve the efficiency of phrase-based retrieval [213].](https://image.slidesharecdn.com/e71a8712-b24d-4089-ba76-c51104d8fb0e-150913153105-lva1-app6892/85/Upstill_Thesis_Revised_17Aug05-24-320.jpg)
![§2.3 Document-level evidence 9
Some terms occur so frequently in a corpus that their presence or absence within
a document may have negligible effect. The most frequent terms arguably convey the
least document relevance information and have the smallest discrimination value (see
inverse document frequency measure in Section 2.3.1.2). Additionally, because of the
high frequency of occurrence, such terms are likely to generate the highest overhead
during indexing and querying.9 Extremely frequent terms (commonly referred to as
“stop words”) are often removed from documents prior to indexing.10 However, it
has been suggested that such terms might be useful when matching documents [214],
particularly in phrase-based searches [14]. Nevertheless, in experiments within this
thesis, stop words are removed prior to indexing.
2.3.1 Text-based document evidence
To build a retrieval model, an operational definition of what constitutes a relevant
document is required. While each of the ranking models discussed below shares sim-
ilar document statistics, they were all derived through different relevance matching
assumptions. Experiments within this thesis employ the Okapi BM25 probabilistic
algorithm (for reasons outlined in Section 2.3.2). Other full-text ranking methods are
discussed for completeness.
The notation used during the model discussions below is as follows: D denotes a
document, Q denotes a query, t is a term, wt indicates a weight or score for a single
term, and S(D, Q) is the score assigned to the query to document match.
2.3.1.1 Boolean matching
In the Boolean model, retrieved documents are matched to queries formed with logic
operators. There are no degrees of match; a document either satisfies the query or
does not. Thus Boolean models are often referred to as “exact match” techniques [14].
While Boolean matching makes it clear why documents were retrieved, its syntax is
largely unfamiliar to ordinary users [28, 49, 51]. Nevertheless empirical evidence sug-
gests that trained search users prefer Boolean search as it provides an exact specifica-
tion for retrieving documents [49]. However, without any ranking by degree of match,
the navigation of the set of matching documents is difficult, particularly on large cor-
pora with unstructured content [14]. Empirical evidence also suggests that the use
of term weights in the retrieval model (described in the next sub-section) brings large
gains [14]. To employ Boolean matching techniques on corpora of the scale considered
in this thesis, it would have to be supplemented by some other document statistic in
order to provide a ranked list of results [14].
9
However, given the high amount of expected repetition they could potentially be more efficiently
compressed [214].
10
This list often contains common function words or connectives such as “the”, “and” and “a”.](https://image.slidesharecdn.com/e71a8712-b24d-4089-ba76-c51104d8fb0e-150913153105-lva1-app6892/85/Upstill_Thesis_Revised_17Aug05-25-320.jpg)
![10 Background
The Boolean scoring function is:
S(D, Q) =
0 Q /∈ D
1 Q ∈ D
(2.1)
where Q is the query condition expressed in Boolean logic operators.
2.3.1.2 Vector space model
The vector space model is based on the implicit assumption that the relevance of a
document with respect to some query is correlated with the distance between the query
and document. In the vector space model each document (and query) is represented
in an n-dimensional Euclidean space with an orthogonal dimension for each term in
the corpus.11 The degree of relevance between a query and document is measured
using a distance function [176].
The most basic term vector representation simply flags term presence using vec-
tors of binary {0, 1}. This is known as the binary vector model [176]. The document
representation can be extended by including term and document statistics in the docu-
ment and query vector representations [176]. An empirically validated document sta-
tistic is the number of term occurrences within a document (term frequency or tf ) [176].
The intuitive justification for this statistic is that a document that mentions a term
more often is more likely to be relevant for, or about, that term. Another important
statistic is the potential for a term to discriminate between candidate documents [190].
The potential of a term to discriminate between documents has been observed to be
inversely proportional to the frequency of its occurrence in a corpus [190], with terms
that are common in a corpus less likely to convey useful relevance information. A
frequently used measure of term discrimination based on this observation is inverse
document frequency (or idf ) [190]. Using the tf and idf measures, the weight of a term
present in a document can be defined as:
wt,D = tf t,D × idft (2.2)
where idf is:
idft = log
N
nt
(2.3)
where nt is the number of documents in the corpus that contain term t, and N is the
total number of documents in the corpus.
11
So all dimensions are linearly independent.](https://image.slidesharecdn.com/e71a8712-b24d-4089-ba76-c51104d8fb0e-150913153105-lva1-app6892/85/Upstill_Thesis_Revised_17Aug05-26-320.jpg)
![§2.3 Document-level evidence 11
There are many functions that can be used to score the distance between document
and query vectors [176]. A commonly used distance function is the cosine measure of
similarity [14]:
S(D, Q) =
D · Q
(|D| × |Q|)
(2.4)
or:
S(D, Q) =
t∈Q wt,D × wt,Q
t∈Q w2
t,D × t∈Q w2
t,Q
(2.5)
Because the longer a document is, the more likely it is that a term will be encoun-
tered in it, an unnormalised tf component is more likely to assign higher scores to
longer documents. To compensate for this effect the term weighting function in the
vector space model is often length normalised, such that a term that occurs in a short
document is assigned more weight than a term that occurs in a long document. This
is termed document length normalisation. For example, a simple form of length normal-
isation is [14]:
wt,D =
tf t,D + 1
maxtf D + 1
× idft (2.6)
where maxtfD is the maximum term frequency observed for a term in document D.
After observing relatively poor performance for the vector space model in a set of
TREC experiments, Singhal et al. [186] hypothesised that the form of document length
normalisation used within the model was inferior to that used in other models. To in-
vestigate this effect they compared the length of known relevant documents with the
length of documents otherwise retrieved by the retrieval system. Their results indi-
cated that long documents were more likely to be relevant for the task studied,12 but
no more likely to be retrieved after length normalisation in the vector space model.
Accordingly, Singhal et al. [186] proposed that the (cosine) length normalisation com-
ponent be pivoted to favour documents that were more frequently relevant (in this
case, longer documents).
12
The task studied was the TREC-3 ad-hoc retrieval task. The ad-hoc retrieval task is an informational
task (see Section 2.6.1) where the user needs to acquire or learn some information that may be present in
a document.](https://image.slidesharecdn.com/e71a8712-b24d-4089-ba76-c51104d8fb0e-150913153105-lva1-app6892/85/Upstill_Thesis_Revised_17Aug05-27-320.jpg)
![12 Background
2.3.1.3 Probabilistic ranking
Probabilistic ranking algorithms provide an intuitive justification for the relevance of
matched documents by attempting to model and thereby rank the statistical proba-
bility that a document is relevant given the matching terms found [146, 169]. The
Probability Ranking Principle was described by Cooper [167] as:
“If a reference retrieval system’s response to each request is a ranking of
the documents in the collections in order of decreasing probability of use-
fulness to the user who submitted the request, where the probabilities are
estimated as accurately as possible on the basis of whatever data has been
made available to the system for this purpose, the overall effectiveness of
the system to its users will be the best that is obtainable on the basis of that
data.”
The probabilistic model for information retrieval was originally proposed by
Maron and Kuhn [146] and updated in an influential paper by Robertson and
Sparck-Jones [169]. Probabilistic ranking techniques have a strong theoretical basis
and should, at least in principle and given all available information, provide the best
predictions of document relevance. The formal specification of the Probabilistic Rank-
ing Principle can be described as an optimisation problem, where documents should
only be retrieved in response to a query if the cost of retrieving the document is less
than the cost of not retrieving the document [169].
A prominent probabilistic ranking formulation is the Binary Independence Model
used in the Okapi BM25 algorithm [171]. The Binary Independence Model is con-
ditioned by several important assumptions in order to decrease complexity. These
assumptions include:
• Independence of documents, i.e. that the relevance of one document is indepen-
dent of the relevance of all other documents;13
• Independence of terms, i.e. that the occurrence or absence of one term is not
related to the presence or absence of any other term;14 and
• That the distribution of terms within a document can be used to estimate the
document’s probability of relevance.15
13
This is brought into question when one document’s relevance may be affected by another document
ranked above it (as is the case with duplicate documents). This independence assumption was removed
in several probabilistic formulations without significant improvement in retrieval effectiveness [204].
14
This assumption was also removed from probabilistic formulations without significant effectiveness
improvements [204].
15
This assumption is made according to the cluster hypothesis which states that “closely associated
documents tend to be relevant to the same requests”, therefore “documents relevant to a request are
separate from those that are not” [204].](https://image.slidesharecdn.com/e71a8712-b24d-4089-ba76-c51104d8fb0e-150913153105-lva1-app6892/85/Upstill_Thesis_Revised_17Aug05-28-320.jpg)
![§2.3 Document-level evidence 13
In most early probabilistic models, the term probabilities were estimated from
a sample set of documents and queries with corresponding relevance judgements.
However, this information is not always available. Croft and Harper [61] have revis-
ited the initial formulation of relevance and proposed a probabilistic model that did
not include a prior estimate of relevance.
Okapi BM25
The Okapi BM25 formula was proposed by Robertson et al. [172]. In Okapi BM25,
documents are ordered by decreasing probability of their relevance to the query,
P(R|Q, D). The formulation takes into account the number of times a query term oc-
curs in a document (tf ), the proportion of other documents which contain the query
term (idf ), and the relative length of the document. A score for each document is
calculated by summing the match weights for each query term. The document score
indicates the Bayesian inference weight that the document will be relevant to the user
query.
Robertson and Walker [170] derived the document length normalisation used in
the Okapi BM25 formula as an approximation to the 2-Poisson model. The form of
length normalisation employed when using Okapi BM25 with default parameters
(k1 = 2, b = 0.75) is justified because long documents contain more information than
shorter documents, and are thus more likely to be relevant [186].
The base Okapi BM25 formulation [172] is:
BM25wt = idf t ×
(k1 + 1)tf t,D
k1((1 − b) + b×dl
avdl ) + tf t,D
×
(k3 + 1) × Qwt
k3 + Qwt
+ k2 × nq
(avdl − dl)
avdl + dl
(2.7)
where wt is the relevance weight assigned to a document due to query term t, Qwt is
the weight attached to the term by the query, nq is the number of query terms, tf t,D is
the number of times t occurs in the document, N is the total number of documents, nt
is the number of documents containing t, dl is the length of the document and avdl is
the average document length (both measured in bytes).
Here k1 controls the influence of tf t,D and b adjusts the document length normali-
sation. A k1 approaching 0 reduces the influence of the term frequency, while a larger
k1 increases the influence. A b approaching 1 assumes that the documents are longer
due to repetition (full length normalisation), whilst b = 0 assumes that documents are
long because they cover multiple topics (no length normalisation) [168].
Setting k1 = 2, k2 = 0, k3 = ∞ and b = 0.75 (verified experimentally in TREC tasks
and on large corpora [168, 186]):
BM25wt,D = Qwt × tf t,D ×
log(N−nt+0.5
nt+0.5 )
2 × (0.25 + 0.75 × dl
avdl ) + tf t,D
(2.8)](https://image.slidesharecdn.com/e71a8712-b24d-4089-ba76-c51104d8fb0e-150913153105-lva1-app6892/85/Upstill_Thesis_Revised_17Aug05-29-320.jpg)
![14 Background
The final document score is the sum of term weights:
BM25(D, Q) =
t∈Q
wt,D (2.9)
2.3.1.4 Statistical language model ranking
Statistical language modelling is based on Shannon’s communication theory [182]16
and examines the distribution of language in a document to estimate the probabil-
ity that a query was generated in an attempt to retrieve that document. Statistical
language models have long been used in language generation, speech recognition
and machine translation tasks, but have only recently been applied to document re-
trieval [162].
Language models calculate the probability of encountering a particular string (s)
in a language (modelled by M) by estimating P(s|M). The application of language
modelling to information retrieval conceptually reverses the document ranking
process. Unlike probabilistic ranking functions which model the relevance of docu-
ments to a query, language modelling approaches model the probability that a query
was generated from a document. In this way, language models replace the notion of
relevance with one of sampling, where the probability that the query was picked from
a document is modelled. The motivation for this approach is that users have some pro-
totype document in mind when an information need is formed, and they choose query
terms to that effect. Further, it is asserted that when a user seeks a document they are
thinking about what it is that makes the document they are seeking “different”. The
statistical language model ranks documents using the maximum likelihood estima-
tion (Pmle) that the query was generated with that document in mind (P(Q|MD)),
otherwise considered to be the probability of generating the query according to each
document language model.
Language modelling was initially applied to document retrieval by Ponte and
Croft [162] who proposed a simple unigram-based document model.17 The simple
unigram model assigns:
P(D|Q) =
t∈Q
P(t|MD) (2.10)
The model presented above may not be effective in general document retrieval
as it requires a document to contain all query terms. Any document that is missing
one or more query terms will be assigned a probability of query generation of zero.
Smoothing is often used to counter this effect (by adjusting the maximum likelihood
16
This is primarily known for its application to text sequencing and estimation of message noise.
17
A unigram language model models the probability of each term occurring independently, whilst
higher order (n-gram) language models model the probability that consecutive terms appear near each
other (described in Section 2.3). In the unigram model the occurrence of a term is independent of
the presence or absence of any other term (similar to the term independence assumption in the Okapi
model).](https://image.slidesharecdn.com/e71a8712-b24d-4089-ba76-c51104d8fb0e-150913153105-lva1-app6892/85/Upstill_Thesis_Revised_17Aug05-30-320.jpg)
![§2.3 Document-level evidence 15
estimation of the language model). Smoothing methods discount the probabilities
of the terms seen in the text, to assign extra probability mass to the unseen terms
according to a fallback model [218]. In information retrieval it is common to exploit
corpus properties for this purpose. Thereby:
P(D|Q) = t∈Q P(t|MD) if t ∈ MD
αP(t|MC) otherwise
(2.11)
where P(t|Md) is the smoothed probability of a term seen in the document D, p(t|MC)
is the collection language model (over C), and α is the co-efficient controlling proba-
bility mass assigned to unseen terms (so that all probabilities sum to one).
Models for smoothing the document model include Dirichlet smoothing [155],
geometric smoothing [162], linear interpolation [19] and 2-state Hidden Markov Mod-
els. Dirichlet smoothing has been shown to be particularly effective when dealing
with short queries, as it provides an effective normalisation using document
length [155, 218].18 Language models with Dirichlet smoothing have been used to
good effect in recent TREC web tracks by Ogilvie and Callan [155].
A document language model is built for all query terms [155]:
P(Q|MD) =
t∈Q
P(t|MD) (2.12)
Adding smoothing to the document model using the collection model:
P(t|MD) = β1Pmle(t|D) + β2Pmle(t|C) (2.13)
The β1 and β2 collection and document linear interpolation parameters are then esti-
mated using Dirichlet smoothing.
β1 =
|D|
|D| + γ
, β2 =
γ
|D| + γ
(2.14)
where |D| is the document length and γ is often set near the average document length
in the corpus [155]. The mle for a document is defined as:
Pmle(w|D) =
tft,D
|D|
(2.15)
Similarly, for the corpus:
Pmle(w|C) =
tft,C
|C|
(2.16)
18
Document length has been exploited with success in the Okapi BM25 model and in the vector space
model.](https://image.slidesharecdn.com/e71a8712-b24d-4089-ba76-c51104d8fb0e-150913153105-lva1-app6892/85/Upstill_Thesis_Revised_17Aug05-31-320.jpg)
![16 Background
The document score is then:
S(D, Q) =
t∈Q
(β1 × (
count(t; D)
|D|
)) + (β2 × (
count(t; C)
|C|
)) (2.17)
Statistical language models have several beneficial properties. If users are as-
sumed to provide query terms that are likely to occur in documents of interest, and
that distinguish those documents from other documents in the corpus, language mod-
els provide a degree of confidence that a particular document should be retrieved [162].
Further, while the vector space and probabilistic models use a crude approximation
to document corpus statistics (such as document frequency, discrimination value and
document length), language models are sometimes seen to provide a more integrated
and natural use of corpus statistics [162].
2.3.2 Discussion
The most effective implementations of each of the retrieval models discussed above
have been empirically shown to be very similar [53, 60, 106, 110, 119, 121]. Discrepan-
cies previously observed in the effectiveness of the different models have been found
to be due to differences in the underlying statistics used in the model implementa-
tion, and not the model formalisation [186]. All models employ a tf × idf approach to
some degree, and normalise term contribution using document length. This is explicit
in probabilistic [170] and vector space models [186], and is often included within the
smoothing function in language models [155, 218]. The use of these document statis-
tics in information retrieval systems has been empirically validated over the past ten
years [155, 168].
When dealing with free-text elements, experiments within this thesis use the prob-
abilistic ranking function Okapi BM25 without prior relevance information [170].
This function has been empirically validated to perform as well as current state-of-
the-art ranking functions [53, 57, 58, 59, 60, 168, 170].
Further discussion and comparison of full-text ranking functions is outside the
scope of this thesis. If interested the reader should consult [14, 176, 191, 204].
2.3.3 Other evidence
To build a baseline that achieves similar performance to that of popular web and
WWW search engines several further types of document-level evidence may need
to be considered [31, 109, 113].
2.3.3.1 Metadata
Metadata is data used to describe data. An example of real-world metadata is a library
catalogue card, which contains data that describes a book within the library (although
metadata is not always stored separately from the document it describes). In web
documents metadata may be stored within HTML metadata tags (<META>), or in a](https://image.slidesharecdn.com/e71a8712-b24d-4089-ba76-c51104d8fb0e-150913153105-lva1-app6892/85/Upstill_Thesis_Revised_17Aug05-32-320.jpg)
![§2.3 Document-level evidence 17
separate XML/RDF resource descriptors. As metadata tags are intended to describe
document contents, the content of metadata tags is not rendered by web browsers.
Several standards exist for metadata creation, one of the least restricted forms of which
is simple Dublin Core [70]. Dublin Core provides a small set of core elements (all
of which are optional) that are used to describe resources. These elements include:
document author, title, subject, description, and language. An example of HTML
metadata usage, taken from http://cs.anu.edu.au/∼Trystan.Upstill/19 is:
<meta http-equiv="Content-Type"
content="text/html;
charset=iso-8859-1" />
<meta name="keywords"
content="Upstill, Web, Information, Retrieval" />
<meta name="description"
content="Trystan Upstill’s Homepage, Web IR" />
<meta name="revised"
content="Trystan Upstill, 6/27/01" />
<meta name="author"
content="Trystan Upstill" />
The utility of metadata depends on the observance of document authorship stan-
dards. Inconsistencies between document content and purpose, and associated meta-
data tags, may severely reduce system retrieval effectiveness. Such inconsistencies
may occur either unintentionally through outdated metadata information, or through
deliberate attribute “stuffing” in an attempt by the document author to have the doc-
ument retrieved for a particular search term [71]. When a document is retrieved due
to misleading metadata information, search system users may have no idea why the
document has been retrieved, with no visible text justifying the document match.
The use of HTML metadata tags is not considered within this thesis due to the
relatively low adherence to metadata standards in documents across the WWW, and
the inconsistency of adherence in other web corpora [107]. This policy is followed by
many WWW search systems [71, 193].
2.3.3.2 URL information
Uniform Resource Locators, or URLs, provide web addresses for documents. The URL
of a document may contain document evidence, either though term presence in the
URL or implicitly through some other URL characteristic (such as depth in the site
hierarchy).
The URL string may contain useful query-dependent evidence by including a po-
tential search term (e.g: http://cs.anu.edu.au/∼Joe.Blogs/ contains the po-
tentially useful terms of “Joe” and “Blogs”). URLs can be matched using simple string
matching techniques (e.g. checking if the text is present or not) or using full-text
19
META tags have been formatted according to X-HTML 1.0.](https://image.slidesharecdn.com/e71a8712-b24d-4089-ba76-c51104d8fb0e-150913153105-lva1-app6892/85/Upstill_Thesis_Revised_17Aug05-33-320.jpg)
![18 Background
ranking algorithms (although a binary term presence vector would probably suffice).
Ogilvie and Callan [50, 155, 156] proposed a novel method for matching URL strings
within a language modelling framework. In their method the probability that a URL
was generated for a particular term, given the URLs of all corpus documents, is cal-
culated. Query terms and URLs are treated as character sequences and a character-
based trigram generative probability is computed for each URL. The numerator and
denominator probabilities in the trigram expansion are then estimated using a linear
interpolation with the collection model [50, 155, 156]. Ogilvie and Callan then com-
bined this URL-based language model with the language models of other document
components. The actual contribution of this type of URL matching is unclear.20
Further query-independent evidence relating to URLs might also be gained
through examining common formatting practices. For example some features could
be correlated with the length of a URL (by characters or directory depth), the match-
ing of a particular character in the URL (e.g. looking for ‘∼’ when matching personal
home pages [181]), or a more advanced metric. Westerveld et al. [135, 212] proposed
a URL-type indicator for estimating the likelihood that a page is a home page. In this
measure URLs are grouped into four categories, Root, Subroot, Path and File, using
the following rules:
Root a domain name,
e.g. www.cyborg.com/.
Subroot a domain name followed by a single directory,
e.g. www.glasgow.ac.uk/staff/.
Path a domain name followed by two or more directories,
e.g. trec.nist.gov/pubs/trec9/.
File any URL ending in a filename rather than a directory,
e.g. trec.nist.gov/contact.html.
Westerveld et al. [135, 212] calculated probabilities for encountering a home page
in each of these URL-types using training data on the WT10g collection (described
in Section 2.6.7.2). They then used these probabilities to assign scores to documents
based on the likelihood that their document URL would be a home page.
In experiments reported within this thesis, URL-type and URL length informa-
tion are considered. While the textual elements in a URL may be useful in doc-
ument matching, consistent benefits arising from their use are yet to be substanti-
ated [107, 155]. As such they are not considered within this work.
20
Ranking functions which included this URL measure performed well, but the contribution of the
URL measure was unclear.](https://image.slidesharecdn.com/e71a8712-b24d-4089-ba76-c51104d8fb0e-150913153105-lva1-app6892/85/Upstill_Thesis_Revised_17Aug05-34-320.jpg)
![§2.3 Document-level evidence 19
2.3.3.3 Document structure and tag information
Important information might be marked up within a web document to indicate to
a document viewer that a particular segment of the document, or full document, is
important. For example useful evidence could be collected from:
• Titles / Heading tags: encoded in <H?> or <TITLE> tags.
• Marked-up text: For example bold (B), emphasised (E) or italic (I) text may
contain important information.
• Internal tag structure: The structural makeup of a document may give insight
into what a document contains. For example, if a document contains a very
long table, list or form, this may give some indication as to the utility of that
document.
• Descriptive text tags: Images often include descriptions of their content for users
viewing web pages without graphics capabilities. These are included as an at-
tribute in the IMG tag (ALT=).
Ogilvie and Callan [50, 155, 156] achieved small effectiveness gains through an up-
weighting of TITLE, Image ALT text and FONT tag text for both named page finding
and home page finding tasks. However, the effectiveness gains through the use of
these additional forms of evidence were small compared to those achieved through
the use of document full-text, referring anchor-text and URL length priors.21
The only document structure used in experiments within this thesis is document
TITLE. While there is some evidence to suggest that up-weighting marked-up text
might provide some gains, experiments have shown that the associated improvement
is relatively small [155].
2.3.3.4 Quality metrics
Zhu and Gauch [219] considered whether the effectiveness of full-text-based docu-
ment ranking22 could be improved through the inclusion of quality metrics.
They evaluated six measures of document quality:
• Currency: how recently a document was last modified (using document time
stamps).
• Availability: how many links leaving a document were available (calculated as
the number of broken links from a page divided by the total number of links).
• Information-to-noise: a measurement of how much text in the document was
noise (such as HTML tags or whitespace) as opposed to how much was useful
content.
21
Using the length of a URL to estimate a prior probability of document relevance.
22
Calculated using a tf × idf vector space model (see Section 2.3.1.2).](https://image.slidesharecdn.com/e71a8712-b24d-4089-ba76-c51104d8fb0e-150913153105-lva1-app6892/85/Upstill_Thesis_Revised_17Aug05-35-320.jpg)
![20 Background
• Authority: a score sourced from Yahoo Internet Life reviews and ZDNet ratings
in 1999. According to these reviews each site was assigned an authority score.
Sites not reviewed were assigned an authority score of zero.
• Popularity: how many documents link to the site (in-degree). This information
was sourced from AltaVista [7]. The in-degree measure is discussed in detail in
Section 2.4.3.1.
• Cohesiveness: how closely related the elements of a web page are, determined
by classifying elements using a vector space model into a 4385 node ontology
and measuring the distance between competing classifications. A small distance
between classifications indicates that the document was cohesive. A large dis-
tance indicates the opposite.
Zhu and Gauch [219] evaluated performance using a small corpus with 40 queries
taken from a query log file.23 They observed some improvement in mean precision
based on all the quality metrics, although not all improvements were significant.24
The smallest individual improvements were for “Popularity” and “Authority” (both
non-significant). The improvements obtained through the use of all other metrics was
significant. The largest individual improvement was observed for the “Information-
to-noise” ratio. Using all quality metrics apart from “Popularity” and “Authority”
resulted in a (significant) 24% increase in performance over the baseline document
ranking [219].
These quality metrics, apart from in-degree, are not included in experiments
within this thesis because sourced information may be incomplete [219] or inaccu-
rate [113].
2.3.3.5 Units of retrieval
Identifying the URL which contains the information unit most relevant to the user
may be a difficult task. There are many ways in which a unit of information may be
defined on a web and so the granularity of information units retrieved by web search
engines may vary considerably.
If the granularity is too fine (e.g. the retrieval of a single document URL when a
whole web site is relevant), the user may not be able to fulfil their information need.
In particular the user may not be able to tell whether the system has retrieved an ad-
equate answer, or the retrieved document list may contain many parts of a composite
document from a single web site.
If the unit of retrieval is too large (e.g. the retrieval of a home page URL when
only a deep page is relevant), the information may be buried such that it is difficult
for users to retrieve.
The obvious unit for WWW-based document retrieval is the web page. However,
there are many situations in which a user may be looking for a smaller element of
23
It is unclear how the underlying search task [106, 108] was modelled in this experiment.
24
Significance was tested using a paired-samples t-test [219].](https://image.slidesharecdn.com/e71a8712-b24d-4089-ba76-c51104d8fb0e-150913153105-lva1-app6892/85/Upstill_Thesis_Revised_17Aug05-36-320.jpg)
![§2.3 Document-level evidence 21
information, such as when seeking an answer to a specific question. Alternatively, a
unit of information may be considered to be a set of web pages. It is common for web
documents to be made up of multiple web pages, or at least be related to other co-
located documents [75]. An example of a composite document is the WWW site for
the Keith van Rijsbergen book ‘Information Retrieval’ which consists of many pages,
each containing small sections from the book [205]. In a study of the IBM intranet
Eiron and McCurley [75] reported that approximately 25% of all URLs encountered on
the IBM corpus were members of some larger “compound” document that spanned
several pages.
The problem of determining the “most useful” level for an information unit
was considered in the 2003 TREC Topic Distillation task (TD2003 – described in Sec-
tion 2.6.7). The TD2003 task judged systems according to whether they retrieved im-
portant resources, and did not mark subsidiary documents as being relevant [60]. The
TD2003 task is similar to the “component coverage” assessment used in the INEX
XML task [85], where XML retrieval systems are rewarded for retrieving the correct
unit of information. In the XML task the optimal system would return the unit of
information that contains the relevant information and nothing else.
Some methods analyse the web graph and site structure in an attempt to identify
logical information units. Terveen et al. build site units by graphing co-located pages,
using a method entitled “clan graphs” [196]. Further methods attempt to determine
the appropriate information unit by applying a set of heuristics based on site hierarchy
and linkage [13, 142].
This thesis adopts the view that finding the correct information unit is analogous
to finding the optimal entry point for the correct information unit. As such, none of
the heuristics outlined above are used to detect information units. Instead, hyperlink
recommendation and other document evidence is evaluated according to whether it
can be used to find information unit entry points.
Document segmentation
Document segmentation methods break-down HTML documents into document com-
ponents that can be analysed individually. A commonly used segmentation method
is to break-down HTML documents into their Document Object Model (DOM), accord-
ing to the document tag hierarchy [42, 45]. Visual Information Processing System
(VIPS) [37, 38, 39] is a recently proposed extension of DOM-based break-down and
dissects HTML documents using visual elements in addition to their DOM.
Document segmentation techniques are not considered in this thesis. While finer
document breakdown might be useful for finding short answers to particular ques-
tions, there is little evidence of improvements in ranking at the web page level [39].](https://image.slidesharecdn.com/e71a8712-b24d-4089-ba76-c51104d8fb0e-150913153105-lva1-app6892/85/Upstill_Thesis_Revised_17Aug05-37-320.jpg)
![22 Background
2.4 Web-based evidence
Many early WWW search engines conceptualised the document corpus as a flat struc-
ture and relied solely on the document-level evidence outlined above, ignoring hy-
perlinks between documents [33]. This section outlines techniques for exploiting the
web graph that is created when considering documents within a web as nodes and
hyperlinks between documents as directed edges.
This thesis does not consider measures based on user interaction with the web
search system, such as click-through evidence [129]. While click-through evidence
may be useful when ranking web pages, assumptions made about user behaviour may
be questionable. In many cases it may be difficult to determine whether users have
judged a document relevant from a sequence of queries and clicks. Collecting such
evidence also requires access to user interaction logs for a large scale search system.
Work within this thesis relating to the combination of query-dependent evidence with
other query-independent evidence is applicable to this domain.
The WWW graph was initially hypothesised to be a small world network [18], that
is, a network that has a finite diameter,25 where each node has a path to every other
node by a relatively small number of steps. Small world networks have been shown
to exist in other natural phenomena, such as relationships between research scientists
or between actors [2, 5, 6, 18]. Barabasi hypothesised that the diameter of the WWW
graph was 18.59 links (estimated for 8 × 10⁸ documents) [18]. However, this work
was challenged by WWW graph analysis performed by Broder et al. [35]. Using a
200 million page crawl from AltaVista, which contained 1.5 billion links [7], Broder et
al. observed that the WWW graph’s maximal and average diameter was infinite. The
study revealed that the WWW graph resembles a bow-tie with a Strongly Connected
Component (SCC), an upstream component (IN), a downstream component (OUT),
links between IN and OUT (Tendrils), and disconnected components. Each of these
components was observed to be roughly the same size (around 50 million nodes).
The SCC is a highly connected graph that exhibits the small-world property. The IN
component consists of nodes that link into the SCC, but cannot be accessed from the
SCC. The OUT component consists of nodes that are linked to from the SCC, but do
not link back to the SCC. Tendrils link IN nodes directly to OUT nodes, bypassing the
SCC. Disconnected components are pages to which no-one linked, and which linked-
to no-one.
The minimal diameter26 for the bow-tie was 28 for the SCC and 500 for the entire
graph. The probability of a directed path existing between two nodes was observed
to be 24%, and the average length of such a path was observed to be 16 links. The
shortest directed path between two random nodes in the SCC was, on average, 16 to
20 links. Further work by Dill et al. [67] has reported that WWW subgraphs, when
restricted by domain or keyword occurrence, also form bow-tie-like structures. This
phenomenon has been termed the fractal nature of the WWW, and is exhibited by
25
Average distance between two nodes in a graph
26
The minimum number of steps by which the graph could be crossed](https://image.slidesharecdn.com/e71a8712-b24d-4089-ba76-c51104d8fb0e-150913153105-lva1-app6892/85/Upstill_Thesis_Revised_17Aug05-38-320.jpg)
![§2.4 Web-based evidence 23
other scale-free networks [67].
Many WWW distributions have been observed to follow a power law [3]. That is,
the distributions take some form k = 1/ix for i > 1, where k is the probability that a
node has the value i according to some exponent x. Important WWW distributions
that have been observed to follow the power law include:
• WWW site in-links (in-degrees). The fraction of pages with an in-degree i was
first approximated by Kumar et al. [136, 137] to be distributed according to
power law with exponent x = 2 on a 1997 crawl of around 40 million pages
gathered by Alexa.27 Later Barabasi et al. estimated the exponent at x = 2.1
over a graph computed for a corpus containing 325 000 documents from the
nd.edu domain [17, 18]. Broder et al. [35] have since confirmed the estimate of
x = 2.1.
• WWW site out-links (out-degrees). Barabasi and Albert [17] estimated a power
law distribution with exponent x = 2.45. Broder et al. [35] reported a x = 2.75
exponent for out-degree on a 200 million page crawl from AltaVista.
• Local WWW site in-degrees and out-degrees [25].
• WWW site accesses [4].
2.4.1 Anchor-text evidence
Web authors often supply textual snippets when marking-up links between web doc-
uments, encoded within anchor “<A HREF=’’></A>” tags. The average length of
an anchor-text snippet has been observed to be 2.85 terms [159]. This is similar to
the average query length submitted to WWW search engines [184] and suggests there
might be some similarity between a document’s anchor-text and the queries typically
submitted to search engines to find that document [73, 74].
A common method for exploiting anchor-text is to combine all anchor-text snip-
pets pointing to a single document into a single aggregate anchor-text document, and
then to use the aggregate document to score the target document [56]. In terms of
document evidence, this aggregate anchor-text document may give some indication
of what other web authors view as the content, or purpose, of a document. It has been
observed that anchor-text frequently includes information associated with a page that
is not included in the page itself [90].
To increase the anchor-text information collected for hyperlinks, anchor-text evi-
dence can be expanded to include text outside (but in close proximity to) anchor-tags.
However, there is disagreement regarding whether such text should be included.
Chakrabarti [44] investigated the potential utility of text surrounding anchor tags
by measuring the proximity of the term “Yahoo” to the anchor tags of links to
http://www.yahoo.com in 5000 web documents. Chakrabarti found that includ-
ing 50 words around the anchor tags performed best as most occurrences of Yahoo
27
http://www.alexa.com](https://image.slidesharecdn.com/e71a8712-b24d-4089-ba76-c51104d8fb0e-150913153105-lva1-app6892/85/Upstill_Thesis_Revised_17Aug05-39-320.jpg)
![24 Background
Distance -100 -75 -50 -25 0 25 50 75 100
Density 1 6 11 31 880 73 112 21 7
Table 2.1: Proximity of the the term “Yahoo” to links to http://www.yahoo.com/ for 5000
WWW documents (from [44]). Distance is measured in bytes. A distance of 0 indicates that
“Yahoo” appeared within the anchor tag. A negative distance indicates it occurred before the
anchor-tag, and a positive distance indicates that it occurred after the tag.
were within that bound (see Table 2.1). Chakrabarti found that using this extra text
improved recall, but at the cost of precision (precision and recall are described in Sec-
tion 2.6.6.1). In later research Davison [64, 65] reported that extra text surrounding the
anchor-text did not describe the target document any more accurately than the text
within anchor-tags. However, Glover et al. [90] reported that using up to 25 terms
around anchor-text tags improved page-content classification performance. Pant el
al. [159] proposed a further method for expanding anchor-text evidence using a DOM
break-down (DOM described in Section 2.3.3.5). They suggested that if an anchor-text
snippet contains under 20 terms then the anchor-text evidence should be extended to
consider all text up to the next set of HTML tags. They found that expanding to be-
tween two and four HTML tag levels improved classification of the target documents
when compared to only using text that occurred within anchor-tags.
Experiments within this thesis only consider text within the anchor tags, as there
is little conclusive evidence to support the use of text surrounding anchor tags.
Anchor-text ranking
Approaches to ranking anchor-text evidence include:
• Vector space. Hyperlink Vector Voting, proposed by Li and Rafsky [143], ranks
anchor-text evidence using a vector space containing all anchor-text pointing to
a document. The final score is the sum of all the dot products between the query
vector and anchor-text vectors. Li and Rafsky did not formally evaluate this
method.
• Okapi BM25. Craswell, Hawking and Robertson [56] built surrogate docu-
ments from all the anchor-text snippets pointing to a page and ranked the doc-
uments as if they contained document full-text. This application of anchor-text
provided dramatic improvements in navigational search performance.28
• Language Modelling. Ogilvie and Callan [155] modelled anchor-text separately
from other document evidence using a unigram language model with Dirich-
28
Navigational search is described in Section 2.6.2.](https://image.slidesharecdn.com/e71a8712-b24d-4089-ba76-c51104d8fb0e-150913153105-lva1-app6892/85/Upstill_Thesis_Revised_17Aug05-40-320.jpg)
![§2.4 Web-based evidence 25
let smoothing. The anchor-text language model was then combined with their
models for other sections of the document using a mixture model (see Sec-
tion 2.5.2.2). This type of anchor-text scoring has been empirically evaluated
and shown to be effective [155, 156].
Unless otherwise noted, the anchor-text baselines used in this thesis are scored
from anchor-text aggregate documents using the Okapi BM25 ranking algorithm.
This method is used because it has previously been reported to perform well [56].
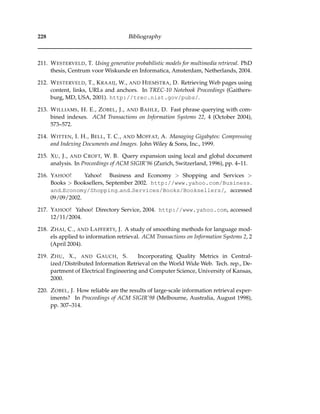
2.4.2 Bibliometric measures
1
2
3
4
5
Figure 2.1: A sample network of relationships
Social networks researchers [125, 131] are concerned with the general study of
links in nature for diverse applications, including communication (to detect espi-
onage or optimise transmission) and modelling disease outbreak [89]. Bibliomet-
rics researchers are similarly interested in the citation patterns between research pa-
pers [87, 89], and study these citations in an attempt to identify relationships. This
can be seen as a specialisation of social network analysis [89]. In many social net-
work models, there is an implicit assumption that the occurrence of a link (citation)
indicates a relationship or some attribution of prestige. However, in the context of
some areas (such as research) it may be difficult to determine whether a citation is an
indication of praise or retort [203].
Social networks and citations may be modelled using link adjacency matrices. A
directed social network of size n can be represented as an n × n matrix, where links
between nodes are encoded in the matrix (e.g. if a node i links to j, then Ei,j = 1). For
example, the relationship network shown in Figure 2.1 may be represented as:
E =
0 0 1 1 0
0 0 1 1 1
0 0 0 1 0
0 0 0 0 1
0 0 1 0 0
](https://image.slidesharecdn.com/e71a8712-b24d-4089-ba76-c51104d8fb0e-150913153105-lva1-app6892/85/Upstill_Thesis_Revised_17Aug05-41-320.jpg)
![26 Background
Prestige
The number of incoming links to a node is a basic measure of its prestige [131]. This
gives a measure of the direct endorsement the node has received. However, examining
direct endorsements alone, may not give an accurate representation of node prestige.
It may be more interesting to know if a node is recognised by other important nodes,
thus transitive citation becomes important. A transitive endorsement is an endorse-
ment through an intermediate node (i.e. if A links to B links to C, then A weakly
endorses C).
An early measure of prestige in a social network analysis was proposed by See-
ley [179] and later revised by Hubbell [125]. In this model, every document has an
initial prestige associated with it (represented as a row in p), which is transferred to
its adjacent nodes (through the adjacency matrix E). Thus the direct prestige of any (a
priori equal) node can be calculated by setting p = (1, ..., 1)T and calculating p = pET .
By performing a power iteration over p ← pET the prestige measure p converges to
the principal eigenvector of the matrix ET and provides a measure of transitive pres-
tige.29 The power iteration method multiplies p by increasing powers of ET until the
calculation converges (tested using some entropy constant).
To measure prestige for academic journals Garfield [88] proposed the “impact
factor”. The impact factor score for a journal j is the average number of citations
to papers within that journal received during the previous two years. Pinski and
Narin [161] proposed a variation to the “impact factor”, termed the influence weight,
based on the observation that all journal citations may not be equally important. They
hypothesised that a journal is influential if its papers are cited by papers in other in-
fluential journals, and thus incorporate a measure of transitive endorsement. This
notion of transitive endorsement is similar to that modelled in PageRank and HITS
(described in Sections 2.4.3.2 and 2.4.4.1).
Co-citation and bibliographic coupling
Co-citation is used to measure subject similarity between two documents. If a docu-
ment A cites documents B and C, documents B and C are co-cited by A. If many doc-
uments cite both documents B and C, this indicates that B and C may be related [187].
The more documents that cite both B and C, the closer their relationship.
The co-citation matrix (CC) is calculated as:
CC = ET
E (2.18)
where CCi,j is the number of papers which jointly cite papers i and j, and the diagonal
is node in-degree.
Bibliographic coupling is the inverse of co-citation, and infers that if two docu-
ments include the same references then they are likely to be related, i.e. if document
29
See Golub and Van Loan [91] for more information about principal eigenvectors and the power
method [pp.330–332].](https://image.slidesharecdn.com/e71a8712-b24d-4089-ba76-c51104d8fb0e-150913153105-lva1-app6892/85/Upstill_Thesis_Revised_17Aug05-42-320.jpg)
![§2.4 Web-based evidence 27
A and B both cite document C this gives some indication that they are related. The
more documents that document A and B both cite, the stronger their relationship.
The bibliographic coupling (BC) matrix is calculated as:
BC = EET
(2.19)
where BCi,j is the number of papers jointly cited by i and j and the diagonal is node
out-degree.
Citation graph measures
Important information may be conveyed by the distance between two nodes in a cita-
tion graph, the radius of a node (maximum distance from a node to the graph edge),
the cut of the graph (or which edges of the graph that when removed will disconnect
large sections of the graph), and the centre of the graph (the node that has the smallest
radius). For example, when examining a field of research, interesting papers can be
identified by their small radius, as this indicates that most papers in the area have a
short path to the paper. The cut of the graph typically indicates communication be-
tween cliques, and can be used to identify important nodes, whose omission would
lead to the loss of the relationship between the groups [196].
2.4.2.1 Bibliographic methods applied to a web
Hyperlink-based scoring assumes that web hyperlinks provide some vote for the im-
portance of their targets. However, due to the relatively small cost of web publishing,
the discretion used when creating links between web pages may be less than is em-
ployed by researchers in scientific literature [203]. Indeed it has been observed that
not all web links are created for recommendation purposes [63] (discussed in Section
3.1.5).
An early use of hyperlink-based evidence was in a WWW site visualisation, where
a site’s visibility represented its direct prestige, and the out-degree of a site was the
node’s luminosity [30]. Larson [138] presented one of the first applications of biblio-
metrics on the WWW by using co-citation to cluster related web pages and to explore
topical themes.
Marchiori [145] provided an early examination of the use of hyperlink evidence in
a document ranking scheme, by proposing that a document’s score should be relative
to that document’s full-text score and “hyper” (hypertext-based) score. Marchiori’s
model was based on the idea that a document’s quality is enriched through the pro-
vision of links to other important resources. In this model, the “hyper-information”
score was a measure based on a document’s subsidiary links, rather than its parent
links. The page score was dependent not only on its full-text content, but the content
of its subsidiaries as well. A decay factor was implemented such that the farther a
subsidiary was from the initial document, the less its contribution would be.
Xu and Croft [215] outline two broad domains for web-based hyperlink informa-
tion: global link information and local link information. Global link information is](https://image.slidesharecdn.com/e71a8712-b24d-4089-ba76-c51104d8fb0e-150913153105-lva1-app6892/85/Upstill_Thesis_Revised_17Aug05-43-320.jpg)
![28 Background
computed from a full web graph, based on links between all documents in a cor-
pus [40, 215]. In comparison, local link information is built for some subset of the
graph currently under examination, such as the set of documents retrieved in response
to a particular query. In many cases the additional cost involved in calculating local
link information might be unacceptable for web or WWW search systems [40].
2.4.3 Hyperlink recommendation
The hyperlink recommendation techniques examined here are similar to the biblio-
metric measures of prestige, and may be able to provide some measure of the “im-
portance”, “quality” or “authority” of a web document [31]. This hypothesis is tested
through experiments presented in Chapter 5.
2.4.3.1 Link counting / in-degree
A page’s in-degree score is a measure of its direct prestige, and is obtained through a
count of its incoming links [29, 41]. It is widely believed that a web page’s in-degree
may give some indication of its importance or popularity [219].
In an analysis of link targets Bharat et al. [25] found that the US commercial do-
main .com had higher in-degree on average than all other domains. Sites within the
.org and .net domains also had higher in-degree (on average) than sites in other
countries.
2.4.3.2 PageRank
PageRank is a more sophisticated query-independent link citation measure developed
by Page and Brin [31, 157] to “objectively and mechanically [measure] the human in-
terest and attention devoted [to web pages]” [157]. PageRank uses global link infor-
mation and is stated to be the primary link recommendation scheme employed in the
Google search engine [93] and search appliance [96]. PageRank is designed to simu-
late the behaviour of a “random web surfer” [157] who navigates a web by randomly
following links. If a page with no outgoing links is reached, the surfer jumps to a
randomly chosen bookmark. In addition to this normal surfing behaviour, the surfer
occasionally spontaneously jumps to a bookmark instead of following a link. The
PageRank of a page is the probability that the web surfer will be visiting that page at
any given moment.
PageRank is similar to bibliometric prestige, but differs by down-weighting doc-
uments that have many outgoing links; the fewer links a node has, the larger the
portion of prestige it will bestow to its outgoing links. The PageRank distribution
matrix (EPR) is then:
EPRi,j =
Ei,j
n=1..dim(Ei,j) En,j
(2.20)
for the link adjacency matrix E.](https://image.slidesharecdn.com/e71a8712-b24d-4089-ba76-c51104d8fb0e-150913153105-lva1-app6892/85/Upstill_Thesis_Revised_17Aug05-44-320.jpg)
![§2.4 Web-based evidence 29
The PageRank distribution matrix (EPR) is a non-negative stochastic30 matrix that
is aperiodic and irreducible.31 The PageRank calculation is a Markov process, where
PageRank is an n-state system and the distribution matrix (EPR) contains the inde-
pendent transition probabilities EPRi,j of jumping from state i to j. If the random
surfer is in all states with equal probability leaving from a node i then EPR1..n,j =
(1/n, ..., 1/n).
The basic formulation of a single iteration of PageRank is then:
p = p × EPRT
(2.21)
where p is initialised according to the bookmark vector (by default a unit vector), and
is the updated PageRank score after each iteration.
Page and Brin observed that unlike scientific citation graphs, it is quite common to
find sections of the web graph that act as “rank sinks”. To address this difficulty Page
and Brin introduced a random jump (or teleport) component where, with a constant
probability d, the surfer jumps to a random bookmarked node in b. That is:
p = ((1 − d) × b) + d × b × p × EPRT
(2.22)
If d = 0 or b is not broad enough, the PageRank calculation may not converge [102].
Another complexity in the PageRank calculation are nodes that act as “rank leaks”,
this occurs if the surfer encounters a page with no outgoing links, or a link to a page
that is outside the crawl (a dangling link). One approach to resolving this issue is to
jump with certainty (a probability of one) when a dangling link is encountered [154].
This approach, and several others, are covered in more detail in Section 3.3.1. If ap-
plying the “jump with certainty” method, and using a unit b bookmark vector (such
that the random surfer has every page bookmarked), the final PageRank scores are
equivalent to the principal eigenvector of the transition matrix EPR, where EPR is
updated to include the random jump factor:
EPRi,j =
(1 − d)
dim(Ei,k)
+ d ×
Ei,j
n=1..dim(Ei,j) En,j
(2.23)
Expressed algorithmically, the PageRank algorithm (when using “jump with cer-
tainty”) is:
R0 ← S
loop :
r ← dang(Ri)
Ri+1 ← rE + ARi
Ri+1 ← (1 − d)E + d(Ri+1)
δ ← Ri+1 − Ri 1
while δ >
30
Every node can reach any other node at any time-step (implies irreducibility).
31
Every node can reach every other node.](https://image.slidesharecdn.com/e71a8712-b24d-4089-ba76-c51104d8fb0e-150913153105-lva1-app6892/85/Upstill_Thesis_Revised_17Aug05-45-320.jpg)
![30 Background
where Ri is the PageRank vector at iteration i, A is the link adjacency matrix (where
Ai,j = 1 if a link exists, and is 0 otherwise), S is the initial PageRank vector (the proba-
bility that a surfer starts at a node), E is the vector of bookmarked pages (the probabil-
ity that the surfer jumps to a certain node at random), dang() is a function that returns
the PageRank of all nodes that have no outgoing links, r is the amount of PageRank
lost due to dangling links which is distributed amongst bookmarks (after [43, 154]),
d is a constant which controls the proportion of random noise (spontaneous jumping)
introduced into the system to ensure stability (0 < d < 1), and is the convergence
constant. The double bar ( 1) notation indicates an l1 norm, the sum of a vector ele-
ment’s absolute values.
In this formulation, for a given link graph, PageRank varies according to the values
of the d constant and the set of bookmark pages E. The PageRank variants investi-
gated in this thesis are described in more detail in Section 3.3.
2.4.3.3 Topic-specific PageRank
Further PageRank formulations seek to personalise the calculation according to user
preferences. Haveliwala [103, 104] proposed Personalised PageRank, and demon-
strated how user topic preferences may be introduced by modifying the bookmark
vector and changing the random jump targets, and thereby altering PageRank scores.
Haveliwala proposed that a bookmark vector be built for each top-level DMOZ [69]
category by including all URLs within the tree as bookmarks.
During query processing, each incoming query is classified into these categories
(represented by the influence vector v) and a new “dynamic” PageRank score is com-
puted from a weighted sum of the category-specific PageRanks (ppr), and the Page-
Rank calculation is modified to explicitly include a bookmark vector (e.g. PR(E, b) is
the PageRank calculation for the adjacency matrix E using bookmarks b). So:
ppr = PR(E, v) (2.24)
Category preferences can also be mixed. To compute a set of personalisation vec-
tors (vi) with weights (wi) for a mixture of categories:
ppr = PR(E,
i
([wi.vi])) (2.25)
2.4.4 Other hyperlink analysis methods
2.4.4.1 HITS
Hyperlink Induced Topic Search (HITS) is a method used to identify two sets of pages
that may be important: Hub pages and Authority pages [132]. Hub and Authority
pages have a mutually reinforcing relationship – a good Hub page links to many Au-
thority pages (thereby indicating high Authority co-citation), and a good Authority
page is linked-to by many Hubs (thereby indicating high Hub bibliometric coupling).](https://image.slidesharecdn.com/e71a8712-b24d-4089-ba76-c51104d8fb0e-150913153105-lva1-app6892/85/Upstill_Thesis_Revised_17Aug05-46-320.jpg)
![§2.4 Web-based evidence 31
Each page in the web graph is assigned two measures of quality; an Authority score
Au[u] and a Hub score H[u]. Sometimes the act of generating HITS results sets is
termed “Topic Distillation”, but in this thesis the phrase is associated with its use in
the TREC web track experiments (described in Section 2.6.3.1).
HITS-based scores may be computed either using local or global link information.
Local HITS has two major steps: collection sampling and weight propagation. Global
HITS is computed for the entire web graph at once so there is no collection sampling
step.
When calculating local HITS a small focused web subgraph, often based around a
search engine result list, is retrieved for a particular query.32 This root set of pages is
then expanded to make a base set by downloading all pages that link to, or are linked-
to by, pages within the root set. The assumption is that, although the base set may not
be a fully connected graph, it should include a large connected component (otherwise
the computation is ineffective).
The Hub and Authority score computation is a recursive process where Au and
H are updated until convergence (initialised with all pages having the same value).
For a graph containing edges E and links between q and p the weight is distributed
according to:
Aup =
(q,p)∈E
Hq (2.26)
Hp =
(q,p)∈E
Auq (2.27)
Like PageRank, these equations can be solved using the power method [91]. Au
will converge to the principal eigenvector of ET E, and H will converge to the princi-
pal eigenvector of EET [154]. The non-principal eigenvectors can also be calculated,
and may represent different term clusters [132]. For example three term clusters (and
corresponding meanings) occur for the query ‘Jaguar’: one on the large cat, one on
the Atari hand-held game console, and one on the prestige car [132].
Revisiting HITS
Several limitations of the HITS model, as presented by Kleinberg [132], were observed
and addressed by Bharat and Henzinger [26]. These are:
• Mutually reinforcing relationships between hosts. This occurs when a set of
documents on one host point to a single document on a second host.
• Automatically generated links. This occurs when web documents are generated
by tools and are not authored (recommendation) links.
• Non-relevant nodes. This arises through what Bharat and Henzinger termed
topic drift. Topic drift occurs when the local subgraph is expanded to include
32
This was originally performed using result sets from the AltaVista WWW search engine [7].](https://image.slidesharecdn.com/e71a8712-b24d-4089-ba76-c51104d8fb0e-150913153105-lva1-app6892/85/Upstill_Thesis_Revised_17Aug05-47-320.jpg)
![32 Background
surrounding links, and as a result, pages not relevant to the initial query are
included in the graph, and therefore in the HITS calculation.
Bharat and Henzinger [26] addressed the first and second issues by assigning
a weight to identical multiple links “inversely proportional to their multiplicity”.33
To address the third problem, topic drift, they removed content outliers. This was
achieved by computing a document vector centroid and removing pages that were
dissimilar to the vector from the base set.
Lempel and Moran [140, 141] proposed a more “robust” stochastic version of HITS
called SALSA (Stochastic Algorithm for Link Structure Analysis). This algorithm aims
to address concerns that Tightly Knit Communities (TKC) affect HITS calculations. A
TKC occurs when a small collection of pages is connected so that every Hub links
to every Authority. The pages in a TKC can be ranked very highly by HITS, and
therefore achieve the principal eigenvector, even when there is a larger collection of
pages in which Hubs link to Authorities (but are not completely connected). The TKC
effect could be used by spammers to increase Hub and Authority rankings for their
pages, using techniques such as link farming.34
Calado et al. [40] observed significant improvement through the use of local and
global HITS over a document full-text-only baseline. The experiments examined a set
of 50 informational-type queries (see Section 2.6.1) extracted from a Brazilian WWW
search engine log. The queries were observed to be 1.78 terms long on average, signif-
icantly shorter than those observed in previous WWW log studies (2.35 terms [184]).
Further, it was observed that 28 of the queries were very general, and consisted of
terms such as “tabs”, “movies” and “mp3s”. The information needs behind these
queries were estimated for relevance assessment following the method proposed by
Hawking and Craswell [110]. Through the addition of local HITS to the baseline vec-
tor space ranking Calado et al. observed an improvement of 8% in precision35 at ten
documents retrieved. Through the incorporation of global HITS evidence they ob-
served an improvement of 24% in precision at ten documents retrieved. The improve-
ments were reported to be significant for local link analysis after thirty results, and for
global link analysis after ten results. Similar improvements were observed through
the use of PageRank.
2.4.5 Discussion
This thesis only considers in-degree and variants of PageRank, and not other hyper-
link recommendation techniques. In-degree is included because it is the simplest hy-
perlink recommendation measure and is cheap to compute. PageRank was chosen as
a representative of other more expensive methods because:
33
Thereby lessening the effects of nepotistic and navigational links, described in Section 3.1.5.
34
Link farms are artificial web graphs created by spammers through the generation link spam. They are
designed to funnel hyperlink evidence to a set of pages for which they desire high web rankings.
35
The precision measure is described in Section 2.6.6.1.](https://image.slidesharecdn.com/e71a8712-b24d-4089-ba76-c51104d8fb0e-150913153105-lva1-app6892/85/Upstill_Thesis_Revised_17Aug05-48-320.jpg)
![§2.5 Combining document evidence 33
• Google [93], one of the world’s most popular search engines, state that PageRank
is an important part of their ranking function [31, 157].
• In recent years there have been many studies of how PageRank might be im-
proved [1, 39, 105, 197], optimised [11, 102] and personalised [103, 104, 127, 130],
but there have not been any detailed evaluations of its potential benefit to re-
trieval effectiveness [8, 78].
• PageRank has been observed to be more resilient to small changes in the web
graph than HITS [154]. This may be an important property when dealing with
WWW-based search as it is difficult to construct an accurate and complete web
graph (see Chapter 3), and the web graph is likely to be impacted by web server
down-time [52].
• PageRank has previously been observed to exhibit similar performance to non-
query-dependent HITS (global HITS) [40].
• While locally computed HITS may perform quite differently to global HITS, the
cost of computing HITS at query-time is prohibitive in most production web and
WWW search systems [132].
2.5 Combining document evidence
There are many ways in which the different types of evidence examined in the previ-
ous two sections could be combined into a single ranking function. It is important that
the combination method is effective, as a poor combination could lead to spurious re-
sults. This section describes several methods that can be used to combine document
evidence.
The discussion of combination methods is split into two sub-sections. The first
sub-section reviews score and rank-based fusion methods. In fusion methods the out-
put from ranking function components is combined without prior knowledge of the
underlying retrieval model (how documents were ranked and scored). The second
sub-section reviews modifications to full-text retrieval models such that they include
more than one form of document evidence.
2.5.1 Score/rank fusion methods
Score or rank-based fusion techniques attempt to merge document rankings based
either on document ranks, or document scores, without prior knowledge of the un-
derlying retrieval model.
The combination of multiple forms of document evidence into a single ranking is
similar to the results merging problem in meta-search, where the ranked output from
several systems are consolidated to a single ranking. A comprehensive discussion of
meta-search data fusion techniques is provided by Montague in [151].](https://image.slidesharecdn.com/e71a8712-b24d-4089-ba76-c51104d8fb0e-150913153105-lva1-app6892/85/Upstill_Thesis_Revised_17Aug05-49-320.jpg)
![34 Background
2.5.1.1 Linear combination of scores
The simplest method for combining evidence is with a linear combination of docu-
ment scores. A linear combination of scores is referred to as combSUM in distributed
information retrieval research [83]. In a linear combination the total score S for a doc-
ument D and query Q, using document scoring functions F1..N is:
S(D, Q) = F1(D, Q) + ... + FN (D, Q) (2.28)
For a linear combination of scores to be effective, scores need to be normalised to a
common scale, and exhibit compatible distributions. As the forms of evidence consid-
ered in this thesis display different distributions, a simple linear combination of scores
may not be effective. In-degree and PageRank values are distributed according to a
power law [35, 159]. By contrast, Okapi BM25 scores are not distributed according
to a power law. Examples of two Okapi BM25 distributions, for the top 1000 doc-
uments retrieved for 100 queries used in experiments in Chapter 7, are included in
Appendix F.
2.5.1.2 Re-ranking
Another method for combining document rankings “post hoc” is to re-rank docu-
ments above some cutoff using another form of document evidence [178]. The re-
ranking cutoffs can be tuned using a training set.
Re-ranking based combinations have the advantage of not requiring a full under-
standing of the distribution of scores underlying each type of evidence, as only the
ordering of lists can be considered. However, this type of re-ranking may be insensi-
tive to the magnitude of difference between scores.36 A further disadvantage of this
method is that it is relatively expensive to re-rank long result lists.
2.5.1.3 Meta-search fusion techniques
Further methods proposed for the fusion of meta-search results include:
• combMNZ: all non-zero document scores are normalised and then multiplied
together [83].
• combSUM: a linear combination of scores [83] (described above).
• combMAX, combMIN, combMED: In combMAX the maximum score of all runs
is considered. In combMIN the minimum score of all runs is considered. In
combMED the median score of all runs is considered. These methods have pre-
viously been observed to be inferior to combMNZ and combSUM [83]. Fur-
ther, these types of combinations do not make sense when used with query-
36
If re-ranking using the relative ranks of documents only, the magnitude of score differences in all
forms of evidence is lost. By contrast, if re-ranking based on some score-based measure, only the magni-
tude of score differences in the evidence used to re-rank documents is lost.](https://image.slidesharecdn.com/e71a8712-b24d-4089-ba76-c51104d8fb0e-150913153105-lva1-app6892/85/Upstill_Thesis_Revised_17Aug05-50-320.jpg)
![§2.5 Combining document evidence 35
independent evidence, as such evidence provides an overall ranking of docu-
ments, and needs to be used in conjunction with some form of query-dependent
evidence for query processing.
Other techniques include Condorcet fuse, Borda fuse and the reciprocal rank func-
tion [151]. Recent empirical evidence suggests that when combining document rank-
ings these methods are inferior to those outlined above [155].
2.5.1.4 Rank aggregation
A further method proposed for combining the ranked results lists of meta-search sys-
tems [72] and document rankings [78], is rank aggregation [79]. In rank aggregation
the union of several ranked lists is taken, and the lists are merged into a single rank-
ing with the least disturbance to any of the underlying rankings. This may reduce the
promotion of documents that have only one or a small number of high performing
runs with poor performance on other runs.
The rank aggregation process can make it difficult to measure and control the con-
tribution of each form of evidence. For this reason, rank aggregation techniques are
not considered in this thesis.
2.5.1.5 Using minimum query-independent evidence thresholds
Implementing a threshold involves setting a minimum query-independent score that
a document must exceed to be considered by the ranking function. That is, for some
threshold τ, if QIE(D) < τ then P(R|D, Q) is estimated to be zero.37 The use of
a static threshold means that some documents may never be retrieved. A more ef-
fective technique might exploit query match statistics to dynamically determine the
minimum threshold.
The potential benefits of using thresholds are two-fold: as an effective method by
which to remove uninteresting pages (such as spam or less frequently visited pages),
and the improvement of computational performance (by reducing the number of doc-
uments to be scored, see Section 6.2.2).
2.5.2 Revising retrieval models to address combination of evidence
Rather than combining document evidence post hoc, the underlying retrieval models
can be modified to include further document evidence. The approaches outlined be-
low combine several forms of document evidence in a single unified retrieval model,
through modifications to the full-text ranking algorithms discussed in Section 2.3.1.
37
This is similar to a rank-based re-ranking of query-independent evidence (described in Sec-
tion 2.5.1.2) as documents above the cutoff are re-ranked. In comparison, the use of a cutoff does not
require a full ranking of query-independent evidence, but means that some documents may never be
retrieved.](https://image.slidesharecdn.com/e71a8712-b24d-4089-ba76-c51104d8fb0e-150913153105-lva1-app6892/85/Upstill_Thesis_Revised_17Aug05-51-320.jpg)
![36 Background
2.5.2.1 Field-weighted Okapi BM25
Field-weighted Okapi BM25, proposed by Robertson et al. [173], is a modification of
Okapi BM25 that combines multiple sources of evidence in a single document rank-
ing function. Conceptually the field weighting model involves the creation of a new
composite document that includes evidence from multiple document fields.38 The im-
portance of fields in the ranking function can be modified by re-weighting their con-
tribution. For example, a two-fold weighting of title compared to document full-text
would see the title repeated twice in the composite document.
If used with Okapi BM25 the score and rank fusion techniques outlined in Sec-
tion 2.5.1 invalidate the non-linear term saturation component and may thereby lessen
retrieval effectiveness [173]. The use of such post hoc score combination means that a
document matching a single query term over multiple fields may outperform a docu-
ment that matches several query terms in a single document field.
In Okapi BM25, the score of a document is equal to the sum of the BM25 scores of
each of its terms:
S(D, Q) =
t∈Q
BM25wt,D (2.29)
The score for each term is calculated using a term weighting function and a measure
of term rarity within the corpus (idf ):
BM25wt,D = f(tf t,D) × idft (2.30)
The term weighting function consists of term saturation and document length nor-
malisation components:
f (tf t,D) =
tf t,D
k1 + tf t,D
, f (tf t,D) =
tf t,D
β
, where β = k1((1 − b) + b
dl
avdl
) (2.31)
where dl is the current document length, and avdl is the average length of a document
in the corpus. These components are combined to form:
BM25wt,D =
tf t,D
k1((1 − b) + b dl
avdl ) + tf t,D
× idft (2.32)
In the Field-weighted Okapi BM25 model, documents are seen to contain fields F1..FN
each holding a different form of (query-dependent) document evidence:
F = (F1, ..., FN ) (2.33)
38
Document fields are some form query-dependent document evidence such as document title, full-
text or anchor-text.](https://image.slidesharecdn.com/e71a8712-b24d-4089-ba76-c51104d8fb0e-150913153105-lva1-app6892/85/Upstill_Thesis_Revised_17Aug05-52-320.jpg)
![§2.6 Evaluation 37
and each field is assigned a weight:
w = (w1, ..., wN ) , wtf t,D :=
N
F=1
tf t,F × wF (2.34)
where w is a vector of field weights, and wtf is the weighted term frequency. The
contribution of terms is then:
fw (wtf t,D) =
wtf t,D
k1 + wtf t,D
, fw (wtf t,D) =
wtf t,D
β
(2.35)
and the document length is updated to reflect the new composite document length:
wdl :=
F
f=1
dlf × wf , wavdl :=
F
f=1
avdlf × wf (2.36)
The final formulation for Field-weighted Okapi BM25 is then:
BM25FW wt,D =
wtf t,D
k1((1 − b) + b wdl
wavdl ) + wtf t,D
× idft (2.37)
2.5.2.2 Language mixture models
In the same way that document models are combined with collection models in order
to smooth the ranking in language models, document models may also be combined
with other language models for the same documents [135, 155]. For example, to com-
bine the language models for anchor-text and content document evidence:
P(D|Q) = P(D)
(t∈Q)
(1 − λ − γ)P(t|C) + λPanchor(t|D) + γPcontent(t|D) (2.38)
Language mixture models have been used to good effect when combining mul-
tiple modalities for multimedia retrieval in video [211]. Indeed, combining multiple
modalities for multimedia retrieval is a similar problem to that of combining multiple
forms of text-based document evidence.
Kraaij et al. [135] incorporate query-independent evidence into a language mixture
model by computing and including prior probabilities of document relevance. Here
P(D) is set according to the prior probability that a document will be relevant, given
the document and corpus properties. The prior relevance probabilities are estimated
by evaluating how a particular feature affects relevance judgements using training
data.
2.6 Evaluation
Search system performance may be measured over many different dimensions, such
as economy in the use of computational resources, speed of query processing, or user](https://image.slidesharecdn.com/e71a8712-b24d-4089-ba76-c51104d8fb0e-150913153105-lva1-app6892/85/Upstill_Thesis_Revised_17Aug05-53-320.jpg)
![38 Background
satisfaction with search results [209]. It is unlikely that a single system will outperform
all others on each of these dimensions, and accordingly it is important to understand
the tradeoffs involved ([191], pp.167).
This thesis is primarily concerned with retrieval effectiveness, that is, how well a
given system or algorithm can match and retrieve documents that are most useful or
relevant to the user’s information need [150]. This is difficult to quantify precisely as it
involves assigning some measure to the value of information retrieved ([191], pp.167).
Judgements of information value are expensive39 and difficult to collect in a way that
is representative of needs and judgements of the intended search system users [209].
In addition, the effectiveness of a system depends on a number of system compo-
nents, and identifying those responsible for a particular outcome in an uncontrolled
environment can be difficult (typical web search system components are described in
Section 2.1).
The use of a test collection is a robust method for the evaluation of retrieval effec-
tiveness and avoids some of the cost involved in performing user studies. A test col-
lection consists of a snapshot of a user task and the document corpus ([191], pp.168).
This encompasses a set of documents, queries, and complete judgements for the doc-
uments according to those queries [48, 209]. Test collections allow for standard perfor-
mance baselines, reproducible results and the potential for collaborative experiments.
However, if proper care is not taken, heavily training ranking function parameters us-
ing a test collection can lead to over-tuning, particularly when training and testing on
the same test collection. In this case, observed performance gains may be unrealistic
and may not apply in general. It is therefore important to train algorithms on one test
collection, and evaluate the algorithms on another.
2.6.1 Web information needs and search taxonomy
Traditional information retrieval evaluations and early TREC web experiments evalu-
ated retrieval effectiveness according to how well methods fulfilled informational-type
search requests (i.e. finding documents that contain relevant text) [48, 176, 191, 205].
An early evaluation of WWW search engines examined their performance on an infor-
mational search task and found it to be below that of the then state-of-the-art TREC
systems [112]. Recent research suggests, however, that the task evaluated was not
typical of WWW search tasks [26, 33, 56, 75, 185]. Broder [33] argues that WWW user
information needs are often not of an informational nature and nominates three key
WWW-based retrieval tasks:
Navigational: a need to locate a particular page or site given its name. An example of
such a query is “CSIRO” where the correct answer would be the CSIRO WWW
site home page.
Informational: a need to acquire or learn some information that will be present in
one or more web pages. An example of such a query is “Thesis formatting ad-
39
In that employing judges to rate documents may be a financially expensive operation.](https://image.slidesharecdn.com/e71a8712-b24d-4089-ba76-c51104d8fb0e-150913153105-lva1-app6892/85/Upstill_Thesis_Revised_17Aug05-54-320.jpg)
![§2.6 Evaluation 39
vice” where correct (relevant) answers would contain advice relating to how a
thesis should be formatted.
Transactional: a need to perform an activity on the WWW. An example of such a
query is “apply for a Californian driver’s licence” where the correct answer
would be a page from which a user could apply for a Californian driver’s li-
cence.
2.6.2 Navigational search tasks
Navigational search, particularly home page finding, is the focus of experiments
within this thesis. Navigational search is an important WWW and web search task
which has been shown to be inadequately fulfilled using full-text-based ranking meth-
ods [56, 185]. Evidence derived from query logs suggests that navigational search
makes up a significant proportion of the total WWW search requests [75]. Naviga-
tional search also provides an important cornerstone in the support of search-and-
browse based interaction. Two prominent navigational search tasks, home page find-
ing and named page finding, are described in more detail below.
2.6.2.1 Home page finding
The home page finding task is: given the name of an entity, retrieve that entity’s
home page. An example of a home page finding search is when a user wants to visit
http://trec.nist.gov and submits the query “Text REtrieval
Conference”. The task is similar to Bharat and Mihaila’s organisation search [27],
where users provided web site naming queries, and Singhal and Kaszkiel’s site-finding
experiment [185], where queries were taken from an Excite log and judged as home
page finding queries [77].
Home page finding queries typically specify entities such as people, companies,
departments and products.40 A searcher who submits an entity name as a query is
likely to be pleased to find a home page for that entity at the top of the list of search
results, even if they were looking for information. It is in this way that home pages
may also provide primary-source information in response to informational and trans-
actional queries [33, 198].
2.6.2.2 Named page finding
The named page finding task can be seen as a superset of the home page finding task,
and includes queries naming both non-home page and home page documents [53].
Accordingly, the objective of the named page finding task is to find a particular web
page given a page naming query.
40
For example: ‘Trystan Upstill’, ‘CSIRO’, ’Computer Science’ or ‘Panoptic’.](https://image.slidesharecdn.com/e71a8712-b24d-4089-ba76-c51104d8fb0e-150913153105-lva1-app6892/85/Upstill_Thesis_Revised_17Aug05-55-320.jpg)
![40 Background
2.6.3 Informational search tasks
Two prominent informational search tasks evaluated in previous web-based experi-
ments [111] are: the search for pages relevant to an informational need (evaluated in
TREC ad-hoc [119]), and Topic Distillation [53]. Experiments within this thesis con-
sider the Topic Distillation task, but not the traditional ad-hoc informational search
task. The ad-hoc informational search task is described in detail in [111].
2.6.3.1 Topic Distillation
The Topic Distillation task asks systems to construct a list of key resources on some
broad topic, similar to those compiled by human editors of WWW directories [111].
More precisely, in TREC experiments the task is defined as: given a search topic, find
the key resources for that topic [111]. An example of a Topic Distillation query might
be “cotton industry” where the information need modelled might be “give me all
sites in the corpus about the cotton industry, by listing their home pages” [60]. A
good resource is deemed to be an entry point for a site which is “principally devoted
to the topic, provides credible information on the topic, and is not part of larger site
also principally devoted to the topic” [60].
While Topic Distillation is primarily an informational search task, it is somewhat
similar to navigational search tasks. The goal in both cases is to retrieve good en-
try points to relevant information units [58]. Indeed, experiments within this thesis
demonstrate that methods useful in home page finding are also effective for Topic
Distillation tasks (in Chapter 9).
2.6.4 Transactional search tasks
To date there has been little direct evaluation of transactional search tasks [111] and at
the time of writing there are currently no reusable transactional test collections. While
transactional search tasks are not the focus of this thesis, a case study that examines
WWW search engine transactional search performance is presented in Chapter 4.
2.6.5 Evaluation strategies / judging relevance
This section describes methods used to collect snapshots of queries and document
relevance judgements with which retrieval effectiveness can be evaluated.
2.6.5.1 Human relevance judging
The most accurate method for judging user satisfaction with results retrieved by a
search system is to record human judgements. However, care needs to be taken when
collecting human judgements that:
• Judges are representative of the general population using the search tool. In
particular if information needs behind given queries are to be modelled (as](https://image.slidesharecdn.com/e71a8712-b24d-4089-ba76-c51104d8fb0e-150913153105-lva1-app6892/85/Upstill_Thesis_Revised_17Aug05-56-320.jpg)
![§2.6 Evaluation 41
in [106, 108]), the user demographic responsible for the query should be taken
into account in order to estimate the underlying need.
• Relevance judgements are correlated with the retrieval task modelled. This may
be difficult as judging instructions for the same query can be interpreted in sev-
eral ways [58].
Judging informational type queries
The scale of large corpora makes the generation of complete relevance judgements
(i.e. judging every document for every query) impossible. In the TREC conference,
judgement pools are created, which comprise the union of the top 100 retrieved docu-
ments per run submitted. These document pools are judged so that complete top 100
relevance judgements are collected for all runs submitted to TREC.41 All non-judged
documents are assumed to be non-relevant. Therefore when these judgements are
used in post hoc experiments, the judgements are incomplete and so relevant docu-
ments will likely be marked non-relevant [209]. The judgement pooling process was
used when judging runs submitted to the TREC Topic Distillation task.
These measures have been used when judging informational queries for several
decades [48, 119, 207]. Some relevant observations about such judging are:
• Agreement between human relevance judges is less than perfect. Voorhees and
Harman [210] reported that 71.7% of judgements made by three assessors for
14 968 documents were unanimous. However, Voorhees [208] later found that
while substituting relevance judgements made by different human assessors
changed score magnitude, it had a negligible affect on the rank order of sys-
tems [119, 208].
• When dealing with pooled relevance judgements un-judged documents are as-
sumed to be non-relevant. This may result in bias against systems that retrieve
documents not-typically retrieved by the evaluated systems. Two investigations
of this phenomenon have reported that while the non-complete judging of docu-
ments may affect individual system scores, they are not likely to affect the rank-
ing of systems [206, 220].
• The order of search results affects relevance judgements [76]. However, in later
work it was found that this was not the case when judging less than fifteen
documents [160].
Judging known item or named item queries
In comparison to informational type queries, the cost of judging named item queries
(such as home page finding and named page finding queries) is much lower, and the
41
Although every group is asked to nominated an order for the importance of the submitted runs, in
case full pooled judgements cannot be completed in time.](https://image.slidesharecdn.com/e71a8712-b24d-4089-ba76-c51104d8fb0e-150913153105-lva1-app6892/85/Upstill_Thesis_Revised_17Aug05-57-320.jpg)
![42 Background
judging is less contentious. Named item queries are developed by judges navigat-
ing to a page in the collection and generating a query designed to retrieve that page.
The judging consists of checking retrieved documents to determine whether they are
duplicates of the correct page (which can be performed semi-automatically [114]).
2.6.5.2 Implicit human judgements
Implicit human judgements can be collected by examining how a user navigates
through a set of search results [129]. Evaluations based on this data may be attrac-
tive for WWW search engines as such data are easy and inexpensive to collect.
One way to collect implicit relevance judgements is through monitoring
click-through of search results [129]. However, the quality of judging obtained based
on this method may depend on how informative the document summaries are, as
the summaries must allow the user to make a satisfactory relevance-based “click-
through” decision. Also, given the implicit user preference for clicking on the first
result retrieved (as it has been most highly recommended by the search system), ob-
served effectiveness scores are likely to be unrealistically high.
If directly comparing algorithms using “click-through”-based evaluation, care must
be taken to ensure competing systems are compared meaningfully. Joachims [129]
proposed that the ranked output from each search algorithm under consideration be
interleaved in the results list, and the order of the algorithms be reversed following
each query so as not to preference one algorithm over the other (thereby removing the
effect of user bias towards the first correct document).
2.6.5.3 Judgements based on authoritative links
A set of navigational queries can be constructed cheaply by sourcing queries and
judgements automatically from human-generated lists of important web resources.
The anchor-text of links within such lists can be used as the queries, and the corre-
sponding target documents as the query answers.
Two recent studies use online WWW directories as authoritative sources for sam-
ple query-document pairs [8, 55]. An extension proposed by Hawking et al. [114] is
the use of site maps found on many web sites as a source of query-document pairs.
In all these methods it is important to remove the query/result source from the cor-
pus prior to query processing, as otherwise anchor-text measures will have an unfair
advantage.
2.6.6 Evaluation measures
2.6.6.1 Precision and recall
Precision and recall are the standard measures for evaluating information retrieval for
informational tasks [14]. Precision is the proportion of retrieved documents that are
relevant to a query at a particular rank cutoff, i.e.:](https://image.slidesharecdn.com/e71a8712-b24d-4089-ba76-c51104d8fb0e-150913153105-lva1-app6892/85/Upstill_Thesis_Revised_17Aug05-58-320.jpg)
![§2.6 Evaluation 43
precision(k) =
1
k 1≤i≤k
ri (2.39)
where k is the rank cutoff and Rk the corpus of documents from D that are relevant
to the query Q at cutoff k, (D1 . . . Dn) is a ranked list of documents returned by the
system and ri = 1 if Di ∈ Rk or ri = 0 otherwise.
Recall is the total proportion of all relevant documents that have been retrieved
within a particular cut-off for a query, i.e.:
recall(k) =
1
|RQ| 1≤i≤k
ri (2.40)
In large-scale test collections, recall cannot be measured as it is to difficult to obtain
relevance judgements for all documents (as it is too expensive to judge a very large
document pool). Therefore recall is not often considered in web search evaluations.
The measures of precision and recall are intrinsically tied together, as an increase
in recall almost always results in a decrease in precision. In fact precision can be ex-
plicitly traded off for recall by increasing k; for very large k every document in the
corpus is retrieved so perfect recall is assured. Given the expected drop-off in preci-
sion when increasing recall it can be informative to plot a graph of precision against
recall [14]. Precision-recall graphs allow for a closer examination of the distribution of
relevant and irrelevant documents retrieved by the system.
Both precision and recall are unstable at very early cutoffs, and it is therefore more
difficult to achieve statistical significance when comparing runs [36]. However, as
WWW search users tend to evaluate only the first few answers retrieved [99, 184],
precision at early cutoffs may be an important measure for WWW search systems.
Counter-intuitively, rather than precision decreasing when a large collection of
documents is searched, empirical evidence suggests that precision is increased [118].42
This phenomenon was examined in detail by Hawking and Robertson [118] who ex-
plained it in terms of signal detection theory.
A further measure of system performance is average precision:
average precision =
1
|RQ| 1≤i≤|D|
rk × precision(k) (2.41)
where k is the rank at which the first relevant document is observed. Average preci-
sion gives an indication of how many irrelevant documents must be examined before
all relevant documents are found. The average precision is 1 if the system retrieves all
relevant documents without retrieving any irrelevant documents. Average precision
figures are obtained after each new relevant document is observed.
R-precision is a computation of precision at the R-th position in the ranking (i.e.
42
These gains were tested at early precision with a cutoff that did not grow with collection size. Also
the collection grew homogeneously, such that the content did not degrade during the crawl (as might be
observed by crawling more content and thereby retrieving more spam on the WWW).](https://image.slidesharecdn.com/e71a8712-b24d-4089-ba76-c51104d8fb0e-150913153105-lva1-app6892/85/Upstill_Thesis_Revised_17Aug05-59-320.jpg)
![44 Background
precision(R)), where R is the total number of relevant documents for that query.
R-precision is a useful parameter for averaging algorithm behaviour across several
queries [14].
2.6.6.2 Mean Reciprocal Rank and success rates
Both the Mean Reciprocal Rank and success rate measures give an indication of how
many low value results a user would have to skip before reaching the correct an-
swer [110], or the first relevant answer [180].
The Mean Reciprocal Rank (MRR) measure is commonly used when there is only
one correct answer. For each query examined, the rank of the first correct document
is recorded. The score for that query is then the reciprocal of the rank at which the
document was retrieved. If there is only one relevant answer retrieved by the system,
then the MRR score corresponds exactly to average precision. The score for a system
as a whole is taken by averaging across all queries.
The success rate measure is often used when measuring effectiveness for exact
match queries, such as home page finding and named page finding tasks. Success rate
is indicated by S@k, where k is the cutoff rank and indicates the percentage of queries
for which the correct answer was retrieved in the top k ranks [56]. The “I’m feeling
lucky” button on Google [93] takes a user to the first retrieved result, accordingly S@1
is the rate at which clicking on such a button would take to the user to a right answer.
The success rate at 5, or S@5 is sometimes measured as it represents how often the
correct answer might be visible in the first results page without scrolling (“above the
fold”) [184]. The S@10 measures how often the correct page is returned within the
first 10 results.
These measures may provide important insight as to the utility of a document
ranking function. Silverstein et al. observed from a series of WWW logs that 85% of
query sessions never proceed past the first page of results [184]. Further, it has recently
been demonstrated that more time is spent by users examining results ranked highly,
with less attention paid to results beyond rank 5.43 All results beyond rank 5 were
observed to, on average, be examined for 15% of the time that was spent examining
the top result. These findings illustrate the importance of precision at high cutoffs and
success rates for WWW search systems.
2.6.7 The Text REtrieval Conference
The Text REtrieval Conference (TREC) was established in 1992 by the National Insti-
tute of Standards and Technology (NIST) and the Defence Advanced Research Projects
Agency (DARPA). The conference was initiated to promote the understanding of In-
formation Retrieval algorithms by allowing research groups to compare effectiveness
on common test collections. Voorhees and Harman present a comprehensive history
43
In this experiment 75% of the users reported that Google was their primary search engine. These
users’ prior experience with Google may be that the top ranked answer is often the correct document
and that effectiveness drops off quickly, which could affect these results.](https://image.slidesharecdn.com/e71a8712-b24d-4089-ba76-c51104d8fb0e-150913153105-lva1-app6892/85/Upstill_Thesis_Revised_17Aug05-60-320.jpg)
![§2.6 Evaluation 45
of the TREC conference and the TREC web track development in [111]. As outlined
by Hawking et al. [117] the benefits of TREC evaluations include: the potential for re-
producible results, the blind testing relevance judgements, the sharing of these judge-
ments, the potential for collaborative experiments, and the extensive training sets cre-
ated for TREC.
2.6.7.1 TREC corpora used in this thesis
Several TREC web track corpora are used and evaluated within this thesis – namely
the TREC VLC2, WT10g and .GOV TREC corpora. Some experiments also use query
sets from the TREC web track of 2001 and 2002 [53], and from the non-interactive web
track of 2003 [60]. These query sets include home page finding sets (2001 and 2003),
named page finding sets (2002 and 2003) and Topic Distillation sets (2002 and 2003).
These query sets and corresponding task descriptions are discussed in Section 2.6.7.2.
• TREC VLC2: is a 100GB corpus containing 18.5 million web documents. This
corpus is one third of an Internet Archive general WWW crawl gathered in
1997 [119]. The size of this corpus is comparable to the size of Google’s index at
the time of its launch (of around 24 million pages [31]). Current search engines
index two orders of magnitude more data [93].
• TREC WT10g: is a 10GB corpus containing a 1.7 million document subset of
the VLC2 corpus [15]. The corpus was designed to be representative of a small
highly connected web crawl. When building the corpus, duplicates, non-English
and binary documents were removed.
• TREC .GOV: is an 18.5GB corpus containing 1.25 million documents crawled
from the US .GOV domain in 2001 [53]. Redirect and duplicate document infor-
mation is available for this corpus (but not WT10g or VLC2).
There is debate as to whether the TREC web track corpora are representative of
larger WWW-based crawls, in particular whether the linkage patterns and density
is comparable (and therefore whether methods useful in WWW-based search would
be applicable to smaller scale web search) [100]. Recent work by Soboroff [188] has
reported that the WT10g and .GOV TREC web corpora do exhibit important charac-
teristics present in the WWW.
2.6.7.2 TREC web track evaluations
TREC 2001 web track
The TREC 2001 web track evaluated two search tasks over the WT10g web corpus
(described in Section 2.6.7.1): home page finding and relevance-based (ad-hoc) infor-
mational search. The objective of the home page finding task was to find a home page
given some query created to name the page (as described in Section 2.6.2.2). The objec-
tive of the relevance-based informational search task was to find documents relevant](https://image.slidesharecdn.com/e71a8712-b24d-4089-ba76-c51104d8fb0e-150913153105-lva1-app6892/85/Upstill_Thesis_Revised_17Aug05-61-320.jpg)
![46 Background
to some topic, given a short summary query. Experiments in Chapter 7 of this thesis
make use of data from the TREC 2001 web track home page finding task. The ad-hoc
informational search task is not considered.
For the 2001 home page finding task, 145 queries were created by NIST assessors
by navigating to a home page within the WT10g corpus and composing a query de-
signed to locate that home page [110]. A training set of 100 home page finding queries
and correct answers, created in the same way, was provided before the TREC evalu-
ation to allow participants to train their systems for home page finding [56]. Systems
were compared officially on the basis of the rank of the first answer (the correct home
page, or an equivalent duplicate page). Search system performance was compared
using the Mean Reciprocal Rank of the first correct answer and success rate (both de-
fined in Section 2.6.6.2).
TREC 2002 web track
The TREC 2002 web track44 evaluated two search tasks over the .GOV web corpus
(described in Section 2.6.7.1): named page finding and Topic Distillation. The objec-
tive of the named page finding task was to find a particular web page given a page
naming query (as described in Section 2.6.2.2). The objective of the Topic Distillation
task was to retrieve entry points to relevant resources rather than relevant documents
(as described in Section 2.6.3.1).
This thesis includes experiments that use data from both of these web track tasks.
Data from the 2002 TREC Topic Distillation task are used sparingly as the task is con-
sidered to be closer to a traditional ad-hoc informational task, rather than a Topic
Distillation task [53, 111].
For the 2002 named page finding task, 150 queries were created by NIST assessors
by accessing a random page within the .GOV corpus and then composing a query
designed to locate that page [53]. Systems were compared officially on the basis of
the rank of the first answer (the correct page, or an equivalent duplicate page), using
Mean Reciprocal Rank and success rates (both measures defined in Section 2.6.6.2).
The 2002 Topic Distillation task consisted of 50 queries created by NIST to be repre-
sentative of broad topics in the .GOV corpus (however, the topics chosen are believed
to have not been sufficiently broad [53]). System effectiveness was compared using
the precision @ 10 measure.
TREC 2003 web track
The TREC 2003 web track evaluated two further search tasks over the .GOV web cor-
pus: a combined home page / named page finding task, and a revised Topic Distilla-
tion task. The objective of the combined task was to evaluate whether systems could
fulfil both types of query without prior knowledge of whether queries named home
44
The report for the official submissions to the 2002 TREC web track (csiro02–) is included in Appen-
dix D, but the results from these experiments are not discussed further.](https://image.slidesharecdn.com/e71a8712-b24d-4089-ba76-c51104d8fb0e-150913153105-lva1-app6892/85/Upstill_Thesis_Revised_17Aug05-62-320.jpg)
![§2.6 Evaluation 47
pages or other pages. The objective of the Topic Distillation task was to find entry
points to relevant resources given a broad query (as described in Section 2.6.3.1).
The instructions given to the relevance judges in the 2003 Topic Distillation task
differed from those given in 2002. In 2003 the judges were asked to emphasise
“home page-ness” more than in the 2002 Topic Distillation task, and broader queries
were used to ensure that some sites devoted to the topic existed [60].
The TREC 2003 combined home page / named page task consisted of a total of 300
queries, with an equal mix of home page and named page queries. The query set was
selected using the methods previously used for generating the query/result sets for
the 2001 home page finding task and the 2002 named page finding task. Systems were
compared officially on the basis of the rank of the first retrieved answer, using Mean
Reciprocal Rank and success rate measures.
The TREC 2003 Topic Distillation task consisted of 50 queries created by NIST to
be representative of broad topics in the .GOV corpus. Judges ensured that queries
were “broad” by submitting candidate topics to a search system in order to determine
whether there were sufficient matches for the proposed topics.
Systems were compared officially on the basis of R-precision as many of the topics
did not have 10 correct results (and thus precision @ 10 was not a viable measure).
Later work by Soboroff challenged the use of these measures, and demonstrated that
precision @ 10 would have been a superior evaluation measure [189].](https://image.slidesharecdn.com/e71a8712-b24d-4089-ba76-c51104d8fb0e-150913153105-lva1-app6892/85/Upstill_Thesis_Revised_17Aug05-63-320.jpg)

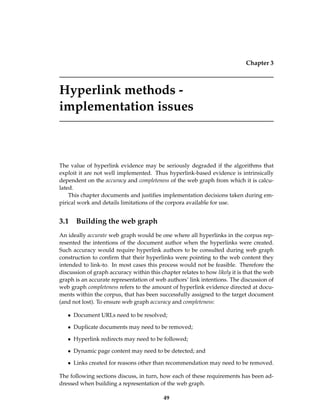
![50 Hyperlink methods - implementation issues
3.1.1 URL address resolution
Hyperlink targets can be expressed as fully qualified absolute addresses (such as http:
//cs.anu.edu.au/index.html) or provided as an address relative to the hyper-
link source (such as ../index.html from http://cs.anu.edu.au/∼Trystan.
Upstill/index.html). Whether addressed using relative or absolute URLs, hy-
perlinks need to be mapped to a single target document either within or external to
the corpus. Non-standard address resolution could lead to phantom pages (and sub-
graphs) being introduced into the web graph. In experiments within this thesis all
relative URLs are decoded to their associated absolute URL (if present) following the
conventions outlined in RFC 2396 [21] and additional rules detailed in Appendix B.
Some examples of address resolution are:
• A relative link to:
/../foo.html from http://cs.anu.edu.au/
is resolved to:
http://cs.anu.edu.au/foo.html;
• Links to one of:
http://cs.anu.edu.au/∼Trystan.Upstill/index.html,
http://cs.anu.edu.au//////∼Trystan.Upstill//, or
http://cs.anu.edu.au:80/∼Trystan.Upstill/
are resolved to:
http://cs.anu.edu.au/∼Trystan.Upstill/;
• Links to:
http://cs.anu.edu.au/foo.html#Trystan
are resolved to:
http://cs.anu.edu.au/foo.html;
• Links to:
panopticsearch.com/
are resolved to:
http://www.panopticsearch.com/.
3.1.2 Duplicate documents
Duplicate and near-duplicate1 documents are prevalent in most web crawls [34, 78,
123, 183]. In a 30 million page corpus collected by AltaVista [7] from the WWW
in 1996, 20% of documents were found to be effective duplicates (either exact duplicates
or near duplicates) of other documents within the collection [34]. In a 26 million page
WWW crawl collected by Google [93] in 1997 24% of the documents were observed to
be exact duplicates [183]. In a further crawl of 80 million documents from the WWW
1
Near-duplicate documents share the same core content but a small part of the page is changed, such
as a generation date or a navigation pane.](https://image.slidesharecdn.com/e71a8712-b24d-4089-ba76-c51104d8fb0e-150913153105-lva1-app6892/85/Upstill_Thesis_Revised_17Aug05-66-320.jpg)
![§3.1 Building the web graph 51
in May 1999 [123] 8.5% of all documents downloaded were exact duplicates. In a 2003
crawl of the IBM intranet over 75% of URLs were effective duplicates [78].
The presence of duplicate pages in a web graph can lead to inconsistent assign-
ment of hyperlink evidence to target documents. For example, if two documents con-
tain duplicate content, other web authors may split hyperlink evidence between the
two documents. These duplicate documents should be identified and collapsed down
to a single URL. However, if unrelated pages are mistakenly identified as duplicates
and collapsed, distortion will be introduced into the web graph and the effective-
ness of both hyperlink recommendation and anchor-text evidence may be reduced.
For example, if Microsoft and Toyota’s home pages were tagged as duplicates, all
link information for Microsoft.com might be re-assigned to Toyota’s home page, lead-
ing to http://www.toyota.com possibly being retrieved for the query ‘Microsoft’.
Therefore it is important to ensure exact (or very close) duplicate matching when as-
signing hyperlink recommendation scores and anchor-text evidence to consolidated
documents.
Common causes of duplicate documents in the corpus are:
• Host name aliasing. Host name aliasing is a technique used to assign multiple
host names to a single IP address. In some cases several host names may serve
the same set of documents under each host name. This may result in identical
sets of documents being stored for each web server alias [15, 123].
• Symbolic links between files. Symbolic links are often employed to map multi-
ple file names to the same document [123], resulting in the same content being
retrieved for several URLs. If there is no consensus amongst web authors as to
the correct URL, incoming links may be divided amongst all symbolically linked
URLs.
• Web server redirects. In many web server configurations the root of a directory
is configured to redirect to a default page (e.g. http://cs.anu.edu.au/ to
http://cs.anu.edu.au/index.html). Once again if there is no consensus
amongst web authors as to the correct URL, incoming links may be divided
amongst the URLs.
• File path equivalence. On web servers running on case-insensitive operating
systems (such as the Microsoft Windows Internet Information Server [148]) the
case of characters in the path is ignored and all case variants will map to the
same file (so Foo/, foo/ and FoO/ are all equivalent). By contrast, for web
servers running on case-sensitive operating systems (such as Apache [10] with
default settings on Linux), folder case is meaningful (so Foo/, foo/ and FoO/
may all map to different directories).
• Mirrors. A mirror is a copy of a set of web pages, served with little or no modi-
fication on another host [23, 122]. In a crawl of 179 million URLs in 1998, 10% of
the URLs were observed to contain mirrored content [23].](https://image.slidesharecdn.com/e71a8712-b24d-4089-ba76-c51104d8fb0e-150913153105-lva1-app6892/85/Upstill_Thesis_Revised_17Aug05-67-320.jpg)
![52 Hyperlink methods - implementation issues
Duplicates created as a result of host name aliasing may be resolved through map-
ping domain names down to their canonical domain name (using “canonical name”
(CNAME) and “address” (A) requests to a domain name server, as detailed in [123]).
This process has several drawbacks, including that some of these virtual hosts may be
incorrectly collapsed down to a single server [123]. To accurately detect duplicates the
process of domain name collapsing should be performed at the time of crawling [123].
This is because the canonical domain name mappings may have changed prior to du-
plicate checking and may incorrectly identify duplicate servers.
In experiments within this thesis host name alias information was collected when
available. Host name alias information was not available for the (externally collected)
VLC2 and WT10g TREC web track collections [15, 62].
Other types of duplicates may be detected using heuristics [24], but page content
examination needs to be performed to resolve these duplicates reliably [123]. Scalable
document full-text-based duplicate detection can be achieved through the calculation
of a signature (typically an MD5 checksum [166]) for each crawled page. However,
such checksums may map two nearly identical pages to very different checksum val-
ues [34]. Therefore document-based checksums cannot be used to detect near du-
plicate documents. Near-duplicate documents can be detected using methods such
as Shingling [32, 34], which detects duplicates using random hash functions, and I-
Match [47], a more efficient method which uses collection statistics. Full site mirrors
may be more easily detected by considering documents not in isolation, but in the
context of all documents on a particular host. Bharat et al. [24] investigated several
methods for detecting mirrors in the web graph using site heuristics such as network
(IP) address, URL structure and host graph connectivity.
In corpora built for this thesis, exact duplicates on the same host were detected
using MD5 checksums [166] during corpus collection. Duplicate host aliases were
also consolidated. Mirror detection and near duplicate detection techniques were not
employed due to link graph distortion that may be introduced through false positive
duplicate matching.
During the construction of the VLC2 test collection no duplicate detection was
employed, however for WT10g (a corpus constructed from VLC2) duplicates present
on the same web server were detected (using checksums) and eliminated [15]. This
was reported to remove around 10% of VLC2 URLs from consideration. Host aliasing
was not checked for either collection [15]. During the .GOV corpus crawl duplicate
documents were detected and eliminated using MD5 checksums.
3.1.3 Hyperlink redirects
Three methods frequently employed by web authors to redirect page requests are:
• Using an HTTP redirect configured through the web server [81].2 The redirect
information is then transferred from the web server to the client in the HTTP
2
This method is recommended by the W3C for encoding redirects [81].](https://image.slidesharecdn.com/e71a8712-b24d-4089-ba76-c51104d8fb0e-150913153105-lva1-app6892/85/Upstill_Thesis_Revised_17Aug05-68-320.jpg)
![§3.1 Building the web graph 53
response header code. HTTP redirects return a redirection HTTP status code
(301 – Moved Permanently or 302 – Moved Temporarily) [81]. In a crawl of
80 million documents in May 1999 [123] 4.5% of all HTTP requests received a
redirection response.
• Using HTML redirects [164].3 HTML redirects are often accompanied by a tex-
tual explanation of the redirect with some arbitrary timeout value for page for-
warding. HTML redirects return an “OK” (200) HTTP status code [81].
• Using Javascript [152]. The detection of Javascript redirects requires the crawler
(or web page parser4) to have a full Javascript interpreter and run Javascript
code to determine the target page.
Ensuring hyperlink evidence is assigned to the correct page when dealing with
hyperlink redirects is no simple matter. A link pointing to a page containing a redirect
can either be left to point at the placeholder page (the page used to direct users to the
new document) or re-mapped to the new target page. The web author who created
the link is unlikely to have deliberately directed evidence to the placeholder page.
By contrast, if the link is re-mapped to the final target, the document may not be
representative of the initial document for which the link was created.
HTML and Javascript redirect information was logged and stored when building
the VLC2 and WT10g test collections. For the .GOV collection all three types of redi-
rects were stored and logged.
If possible, for experiments within this thesis, redirect information was used to
reassign the link to the end of the redirect chain. Due to the complexity of dealing
with Javascript redirects, experiments in this thesis do not resolve these redirects.
3.1.4 Dynamic content
Unbounded crawling of dynamic content can lead to crawlers being caught in “crawler
traps” [123] and the creation of phantom link structures in the web graph. This may
lead to “sinks” being introduced into the web graph, and a reduction of the effective-
ness of hyperlink analysis techniques.
Dynamic content on the WWW is bounded only by the space of all potential
URLs on live host names. A study in 1997 estimated that 80% of useful WWW docu-
ments are dynamically generated [139]; moreover this has been observed to be a lower
bound [165].
During the creation of the VLC2 test collection, dynamic content was crawled
when linked-to [15]. For the WT10g corpus all identifiably dynamic documents5 were
removed [15]. This meant removing around 20% of the documents present in the
3
This method for encoding redirects is not recommended in the latest HTML specification [164].
4
The system component that processes web documents and extracts document data prior to indexing.
5
i.e. not having a static URL extension, e.g. a “?” or common dynamic extensions such as “.php”,
“.cgi” or “.shtml”.](https://image.slidesharecdn.com/e71a8712-b24d-4089-ba76-c51104d8fb0e-150913153105-lva1-app6892/85/Upstill_Thesis_Revised_17Aug05-69-320.jpg)
![54 Hyperlink methods - implementation issues
VLC2 corpus. This is surprising given the estimate that 80% of all useful WWW con-
tent is dynamic. The large disagreement indicates that either: the crawler used to
gather the VLC2 corpus did not effectively crawl dynamic content, or the estimate of
dynamic content was incorrect, or static content was crawled first during the Inter-
net Archive crawl.6 It is unclear why dynamic content was removed from the WT10g
corpus, given that dynamic web content is likely to contain useful information.
3.1.5 Links created for reasons other than recommendation
Hyperlink recommendation algorithms assume that links between documents imply
some degree of recommendation [157]. Therefore links created for reasons other than
recommendation may adversely affect hyperlink recommendation scores [63]. Links
are often created for site navigation purposes or for nepotistic reasons [63]. Nepotistic
linking is link generation that is the result of some relationship between the source and
target, rather than the merit of the target [63, 137]. Kleinberg [132] proposed that all
internal site links be removed to lessen the influence of local nepotistic hyperlinks and
navigational hyperlinks. This was further refined by Bharat and Henzinger [26] who
observed that nepotistic links may exist not only within a single site but between sites
as well. To remove these nepotistic links they suggested that all sites be considered as
units, and proposed that only a single link between hosts be counted. However, the
removal of all internal host link structure may discard useful site information. Amitay
et al. [9] studied the relationship between site structure and site content and through
an examination of internal and external hyperlink structure were able to distinguish
between university sites, online directories, virtual hosting services, and link farms.
The link structures in each of these sites were observed to be quite different, indicating
that reducing the effects of nepotistic and navigational links according to the type of
site may be more effective than simply removing all internal links.
Fundamental changes in the use of hyperlinks on the web may also challenge the
recommendation assumption by affecting the quality or quantity of mined hyperlink
information. For example, the use of web logging tools (blogs) [92] may alter the
dynamics of hyperlinks on the WWW. Such pages are often stored together on a single
host, are very frequently updated, and the cost of generating a link to other content
in a blog is small. As such, the applicability of hyperlink recommendation algorithms
in this environment has been challenged [86]. It is also possible that as WWW search
engine effectiveness improves, authors are less likely to link to documents that they
find useful, as such documents can be easily found using a popular WWW search
engine. An analysis how such trends affect hyperlink quality is outside of the scope
of this thesis and is left for future work.
In experiments in this thesis internal site links are preserved and weighted equally.
This is important, as some of the evidence useful in navigational search may be en-
coded into internal site structure or nepotistic links, such as links to site home pages
6
The VLC2 collection consists of the first one-third of the documents stored during an all-of-WWW
crawl performed by the Internet Archive in 1997.](https://image.slidesharecdn.com/e71a8712-b24d-4089-ba76-c51104d8fb0e-150913153105-lva1-app6892/85/Upstill_Thesis_Revised_17Aug05-70-320.jpg)
![§3.2 Extracting hyperlink evidence from WWW search engines 55
and entry points. For example, almost all external links to the Australia Post web
site [12] are directed to the post-code lookup, with the home page identified by ev-
idence present in the anchor-text of internal links [114]. Also, within some of the
collections studied (such as WT10g [15]), inter-server linking is relatively infrequent.
3.2 Extracting hyperlink evidence from WWW search engines
Some of the experiments performed in this thesis rely on hyperlink evidence extracted
from WWW search engines via their publicly available interfaces. The WWW search
engines used are well engineered and provide effective and robust all-of-WWW search.
However, there are disadvantages in using WWW search engines for link informa-
tion. Such experiments are not reproducible as search engine algorithms and indexes
are not known and may well change over time. Additionally, some of the sourced
information is incomplete (such as the top 1000 results lists) or estimated (such as
document linkage information7).
3.3 Implementing PageRank
PageRank implementations outlined in the literature differ in the ways they deal with
dangling links, in the bookmarks used for random jumping, and in the conditions that
must be satisfied for convergence [154, 157, 158, 201]. Section 2.4.3.2 gave an overview
of the PageRank calculation. The current section outlines the process that has been
followed when calculating PageRank values for use in this thesis.
3.3.1 Dangling links
A hyperlink in the web graph that refers to a document outside of the corpus, or links
to a document which has no outgoing links, is termed a dangling link [157].
In Page and Brin’s [157] PageRank formulation, dangling links are removed prior
to indexing and then re-introduced after the PageRank calculation has converged.
The removal of dangling links using this method increases the weight of PageRank
distributed through other links on pages that point to dangling links. This is because
dangling links are not considered when dividing PageRank amongst document out-
links.
An alternative PageRank calculation sees the random surfer jump with certainty
(probability 1, rather than (1 − d)) when they reach a dangling link. This implies
that the random surfer jumps to a bookmark when they reach a dead-end [43, 154].
This implementation has desirable stability properties when used with a bookmark set
that evenly distributes “jump” PageRank amongst all pages (as described in Section
2.4.3.2).
7
Sourced using methods outlined in Section 5.1.3.](https://image.slidesharecdn.com/e71a8712-b24d-4089-ba76-c51104d8fb0e-150913153105-lva1-app6892/85/Upstill_Thesis_Revised_17Aug05-71-320.jpg)
![56 Hyperlink methods - implementation issues
A further PageRank variant sees the random surfer jump back to the page they
came from when they reach a dangling link [158]. This variant is problematic as it
may lead to rank sinks if a page has many dangling links. This may result in inflated
scores for sections of the graph.
The PageRanks used for web corpora in this thesis are calculated using the dan-
gling link “jump with certainty” method. This method has been shown to have desir-
able stability and convergence properties [154].
3.3.2 Bookmark vectors
In experiments within this thesis PageRank values are calculated for two different
bookmark vectors (E). The first vector produces a “Democratic” or unbiased Page-
Rank in which all pages are a priori considered equal. The second bookmark vector
“personalises” [157] the PageRank calculation to favour known authoritative pages.
The bookmark vector is created using links from a hand-picked source and is termed
“Aristocratic” PageRank.
In Democratic PageRank (DPR) every page in the corpus is considered to be a book-
mark and therefore every page has a non-zero PageRank. Every link is important and
thus in-degree might be expected to be a good predictor of DPR. Because it is easy for
web page authors to create links and pages, it is easy to manipulate DPR with link
spam.
In Aristocratic PageRank (APR) a set of authoritative pages is used as bookmarks to
systematically bias scores. In practice the authoritative pages might be taken from a
reputable web directory or corpus site-map. For example, for WWW-based corpora,
bookmarks might be sourced from a WWW directory service such as Yahoo! [217],
Looksmart [144] or the Open Directory [69]. APR may be harder to spam than DPR
because newly created pages are not, by default, included in the bookmarks.
3.3.3 PageRank convergence
This section presents a small experiment to determine how the performance of Page-
Rank is affected by changes to the PageRank d value. These experiments examine re-
trieval effectiveness on the WT10gC home page finding test collection, for Optimal re-
rankings (described in Section 2.6.7.1) of two query-dependent baselines (document
full-text and anchor-text). This collection was provided to participants in TREC 2001
so that they could train systems for home page search (described in Section 2.6.7.2, the
test collection is used in experiments in Chapter 7).
Figures 3.1 and 3.2 illustrate how the PageRank on the WT10gC collection is af-
fected by changes to the d value. Figure 3.3 shows how the choice of d affects conver-
gence. In practice the d value is typically chosen to be between 0.8 and 0.9 [16, 157].
Results from these experiments reveal that the performance of PageRank can be
remarkably stable even with large changes in the d value. When d was set to 0.02
the performance of the Optimal re-ranking (see Section 7.3) was similar to the per-
formance at d = 0.85. Without the introduction of any random noise (at d = 1.0)](https://image.slidesharecdn.com/e71a8712-b24d-4089-ba76-c51104d8fb0e-150913153105-lva1-app6892/85/Upstill_Thesis_Revised_17Aug05-72-320.jpg)
![§3.3 Implementing PageRank 57
the PageRank calculation did not converge. However, the PageRank calculation did
converge with only a small amount distributed in random jumping (d = 0.99).
Unless the score is to be directly incorporated in a ranking function, only the rel-
ative ordering of pages is important. Haveliwala [102] noted this as a possible Page-
Rank optimisation method since a final ordering of pages might be achieved before fi-
nal convergence. Haveliwala observed that the ordering of pages by PageRank values
did not change significantly after few PageRank iterations. When moving from 25 to
100 iterations of the PageRank calculation, on corpora of over 100 000 documents, no
significant difference in document ranking order was observed [102]. In experiments
in this thesis the PageRank calculation was run until convergence. This allowed for
flexibility when combining PageRank values with other ranking components.
Since little improvement in performance was observed when increasing d, the em-
pirical evidence suggests d should be set to a very small value (around 0.10) for cor-
pora of this size, thereby reducing the number of iterations required and minimising
computational cost. However, to maintain consistency with previous evaluations, in
experiments within this thesis, d was set at 0.85, as suggested by Brin and Page [31].
0
20
40
60
80
100
0 0.2 0.4 0.6 0.8 1
Successrate(content)
Democratic PageRank d value
S@1
S@5
S@10
Figure 3.1: Effect of d value (random jump probability) on success rate for Democratic Page-
Rank calculations for the WT10gC test collection. As d approaches 0 the bookmarks become
more influential. As d approaches 1 the calculation approaches “pure” PageRank (i.e. a Page-
Rank calculation with no random jumps). The convergence threshold ( ) is set to 0.0001. The
WT10gC test collection is described in Section 7.1.3. The PageRank scores are combined with a
document full-text (content) baseline ranking using the Optimal re-ranking method described
in Section 7.1.4.](https://image.slidesharecdn.com/e71a8712-b24d-4089-ba76-c51104d8fb0e-150913153105-lva1-app6892/85/Upstill_Thesis_Revised_17Aug05-73-320.jpg)
![§3.4 Expected correlation of hyperlink recommendation measures 59
3.3.4 PageRank applied to small-to-medium webs
It is sometimes claimed that PageRanks are not useful unless the web graph is very
large (tens or hundreds of millions of nodes), but this claim has not been substan-
tiated. PageRanks can be calculated for a web graph of any size. PageRank scores
are therefore usable within any web crawl, including single organisations (enterprise)
and portals. The Google organisational search appliance incorporates PageRank for
crawls of below 150 000 pages [96].
3.4 Expected correlation of hyperlink recommendation mea-
sures
As DPR depends to some degree on the number of incoming links a page receives, one
might expect DPR to be correlated with in-degree. Ding et al. [68] previously observed
that for this reason, in-degree is a useful first order approximation to DPR. Moreover,
when DPR is calculated with a low convergence threshold it might be expected to
be more highly correlated with in-degree, as little weight is transferred through the
graph. Similarly it might be expected that corpora with large numbers of dangling
links would be more highly correlated. APR is likely to be far less correlated, with
many documents potentially having an APR score of zero.8
In this thesis the following correlations between hyperlink recommendation scores
are tested:
• Between WWW-based PageRank scores (from Google [93]) and WWW-based
in-degree scores (from AllTheWeb [80]), in Section 5.3;
• Between small-to-medium web based scores for DPR, APR and in-degree, in
Section 7.6.3; and
• Between small-to-medium web based scores for DPR, APR and in-degree, and
WWW-based PageRank scores (from Google), also in Section 7.6.3.
8
For example, if not bookmarked, no APR score will be achieved by pages in the so termed WWW
“Tendrils” (unless linked to by other Tendrils) [35] or pages in the IN component.](https://image.slidesharecdn.com/e71a8712-b24d-4089-ba76-c51104d8fb0e-150913153105-lva1-app6892/85/Upstill_Thesis_Revised_17Aug05-75-320.jpg)

![Chapter 4
Web search and site searchability
The potential for hyperlink evidence to improve retrieval effectiveness may depend
upon the authorship of web sites. Some web documents are authored in such a way
as to prevent or discourage direct linking. This may make it difficult for web search
engines to retrieve a document. Decisions made when authoring documents can af-
fect the evidence collected by web crawlers, and thereby reduce or increase the quality
of end-user search results. This chapter investigates how the “searchability” of sites
influences retrieval effectiveness. It also provides a whole-of-WWW context for the
experimental work based on smaller web corpora. In particular, the case study pre-
sented in this chapter illustrates:
• The importance of web hyperlink evidence in the ranking algorithms of promi-
nent WWW search engines, by investigating whether well-linked content is more
likely to be retrieved by WWW search engines.
• Difficulties faced by prominent WWW search engines when resolving author
intentions through web graph processing (and how successfully resolving issues
discussed in Chapter 3 can improve retrieval effectiveness).
• The effect of web authorship conventions on the likelihood of hyperlink evi-
dence generation.
This case study examines both search effectiveness and searchability with respect
to a particular type of commodity which is frequently sold over the WWW; namely
books. The task examined is that of finding web pages from which a book may be
purchased, specifying the book’s title as the query.
Online book buying is a type of transactional search task (see Section 2.6.1) [33].
Transactional search is an important web search task [124], as it drives e-commerce
and directs first-time buyers to particular merchant web sites. However, despite the
prevalence of such tasks, information retrieval research has largely ignored product
purchasing and transactional search tasks [106, 116].
The product purchasing search task is characterised by multiple correct answers.
For example, in this case study, any of the investigated bookstores may provide the
service which has been requested (the purchase of a particular book). Employing a
task with many equivalent answers spread over a number of sites makes it possible to
61](https://image.slidesharecdn.com/e71a8712-b24d-4089-ba76-c51104d8fb0e-150913153105-lva1-app6892/85/Upstill_Thesis_Revised_17Aug05-77-320.jpg)
![62 Web search and site searchability
study which sites are most easily searchable by search engines, and conversely which
search engines provide the best coverage.
The study of searchability is primarily concerned with site crawlability and the
prevalence of link information, that is, how easy it is to retrieve pages and link struc-
ture from a web site. A site with good searchability is one whose pages can be matched
and ranked well by search engines, and whose URLs are simple and consistent, such
that other authors may be more likely to create hyperlinks to them.
Previous studies of transactional search have evaluated the service finding ability
of TREC search systems [106] and WWW search engines [116] on a set of apparently
transactional queries extracted from natural language WWW logs. The aim of these
studies was to compare search engines on early precision; no information was avail-
able (or needed) about what resources could be found, and there was no comparison
of the searchability of online vendor sites.
4.1 Method
The initial step in the experiment was the selection of candidate books, the titles of
which formed the query set. This query set was then submitted to four popular WWW
search engines and ranked lists of documents were retrieved. Links to candidate
bookstore-based pages within these ranked lists were extracted, examined, and (if
required) downloaded. These documents were then examined to determine whether
they fulfilled the requirements of transactional search; that is, that the document did
not only match the book specified in the query, but also allowed for the book to be
purchased directly. The search engines were then compared based on how often they
successfully retrieved a transactional document for the requested books. Similarly, a
comparison of bookstores was performed based on how often each bookstore had a
transactional document for the desired book retrieved by any of the WWW search en-
gines. To examine the effect that hyperlink and document coverage had on bookstore
and search engine retrieval effectiveness, further site-based information was extracted
from the search engines and analysed. The experimental data used were collected in
the fourth quarter of 2002.
The following sections describe these steps in greater detail. The methods used for
extracting evidence relating to search engine coverage of bookstore URLs and hyper-
links are described in Appendix C.
4.1.1 Query selection
The book query set was identified from the New York Times bestseller lists, by sourc-
ing the titles of the best-sellers for September 2002 [153]. A total of 206 distinct book
titles were retrieved from nine categories.1 Book titles were listed on the best-seller
lists fully capitalised, and were later converted to lower case and revised such that all
terms, apart from join terms (such as “the”, “and” and “or”), began with a capital.
1
The book/category breakdown is included in Appendix C.](https://image.slidesharecdn.com/e71a8712-b24d-4089-ba76-c51104d8fb0e-150913153105-lva1-app6892/85/Upstill_Thesis_Revised_17Aug05-78-320.jpg)
![§4.1 Method 63
The query selection presumes that users search for a book using its exact title. In
fact users may seek books using author names, topics, or even partial and/or incorrect
titles. However, it is likely that a significant proportion of book searches are made
using the exact listed title.
The ISBNs of correct books were identified for page judging. Both hardcover and
paperback editions of books were considered to be correct answers.2 A list of the
queries and the ISBNs of the books judged as correct answers is available in Appen-
dix C.
4.1.2 Search engine selection
Four search engines were identified from the Nielsen/NetRatings Search Engine Rat-
ings for September 2002 (as outlined in Table 4.1). At the time, the four engines pro-
vided the core search services for the four most popular search services, and for eight
of the top ten search services [194].
S.Engine Abbr. Used by [195] Rank
AltaVista [7] AV AltaVista 8
AllTheWeb [80] FA AllTheWeb -
Google [93] GO Google 3
AOL 4
Netscape 9
Yahoo 1
MSN Search [149] MS MSN Search 2
(based on Looksmart 10
Inktomi) HotBot -
Overture 6
Table 4.1: Search engine properties. The column labelled “Abbr.” contains abbreviations
used in the study. “Used by” indicates search services that used the search engine. “Rank”
indicates the search services position in the Nielsen/NetRatings Search Engine Ratings of Sep-
tember 2002 [194].
4.1.3 Bookstore selection
The bookstore set was derived from the Google DMOZ “Shopping > Publications >
Books > General” [94] and Yahoo! “Business and Economy > Shopping and Services >
Books > Booksellers” [216] directories. Bookstores were considered if they sold the top
bestseller in at least three of the nine categories. The process of bookstore candidate
identification was performed manually using internal search engines to search for
both the title and the author of each book (both title and author were used to uniquely
2
Large print and audio editions were deemed to be incorrect answers.](https://image.slidesharecdn.com/e71a8712-b24d-4089-ba76-c51104d8fb0e-150913153105-lva1-app6892/85/Upstill_Thesis_Revised_17Aug05-79-320.jpg)
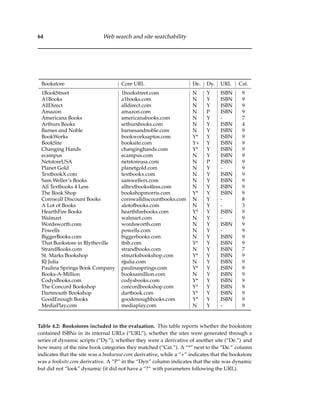
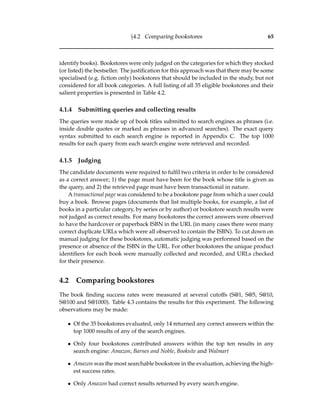
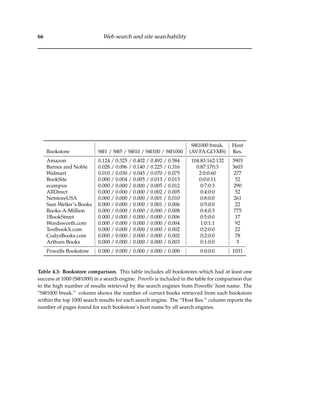
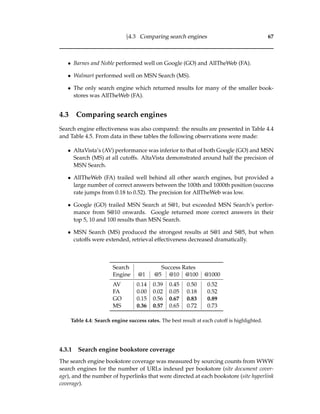

![§4.4 Findings 73
such a program is in place, it is important to ensure partners are able to point directly
to products and that all partners point to the same consistent URL for each product
(e.g. Amazon provides an incentive program so that web authors link directly to their
product pages).
To ensure database generated content is not rejected by WWW search engines,
it is important that the content is provided through individual, static looking URLs.
Duplicate pages should also be removed from the site. However, if duplicate pages
are to be retained, it is important that web authors know what URL they should link
to, and that crawls of duplicate pages be minimised (potentially through the use of
page crawl exclusion measures in “robots.txt” files [133]).
4.4.2 Bookstore searchability: matching/ranking performance
Transactional documents for the requested books were most frequently matched (and
retrieved) from the Amazon and Barnes and Noble bookstores. Many of the documents
retrieved by WWW search engines from other bookstores were observed to be browse
and search pages, and not transactional documents. The Powells bookstore is a case in
point. Despite having many links, reasonable coverage in search engine indexes and
having results matched frequently, Powells transactional pages were never returned.
This may indicate poor page full-text content, poor site organisation and/or a lack of
encouragement to link directly to products (as their referral program appears to be
processed through their front page).
These identified problems could also be alleviated somewhat by employing robot
exclusion directives to inform crawlers to ignore search and browse pages, and index
only product pages (through the use of “robots.txt” files [133], as outlined above).
4.4.3 Search engine retrieval effectiveness
The best book finding search engines were Google and MSN Search and the most
successful bookstore was Amazon. MSN Search provided the most correct answers
at the first rank. However, Google provided more correct answers in the top five
positions, potentially giving users more book buying options.
In order to maximise the book finding ability of a WWW search engine empirical
findings indicate that deep crawls of dynamic content needs to be performed. All of
the examined bookstores bury product pages deep within their URL directory tree
(generally as leaf nodes). While AllTheWeb appeared to index a much larger selection
of bookstores, they appeared to not crawl as much of the Amazon bookstore as other
search engines. Given that the majority of correct hits for all search engines came
from the Amazon bookstore, this could be one of the main reasons for the observed
low effectiveness of AllTheWeb on this task.
Some WWW search engines appear to favour certain bookstores over others. For
example Google and AllTheWeb have large indexes of Barnes and Noble while the oth-
ers do not. A further example of this is the good performance of the Walmart book-
store in MSN Search. The results suggests that MSN Search may have access to extra](https://image.slidesharecdn.com/e71a8712-b24d-4089-ba76-c51104d8fb0e-150913153105-lva1-app6892/85/Upstill_Thesis_Revised_17Aug05-89-320.jpg)
![74 Web search and site searchability
information for Walmart that is not available to the other search engines.
For WWW search engines to provide good coverage of popular bookstores it is
necessary for them to crawl dynamic URLs, even when there are many pages gen-
erated from a single script with different parameters. On the Walmart and Powells
bookstores, all product pages are created from a single script, with the book’s ISBN
as a parameter. Also, as many slightly different URLs frequently contain information
about exactly the same ISBN it may be necessary to perform advanced equivalence
(duplicate) URL or content detection. This is the case with duplicate product pages
on the Amazon bookstore, as the same document is retrieved no matter what referral
identifier is included in the URL. Without effective duplicate detection and consolida-
tion for duplicate documents in the hyperlink graph the effectiveness of link evidence
will be decreased.
4.5 Discussion
The coverage results from leading WWW search engines indicate that all of the eval-
uated engines dealt with web graph anomalies in a different manner (some more ef-
fectively than others). The most effective search engines retrieved book buying pages
from dynamic sites for which they had crawled between 0.9 and 3.6 million docu-
ments. This demonstrates the importance of using robust methods when sourcing and
building the web graph (such as those outlined in Chapter 3) for effective retrieval.
From a web site author’s point of view the design of a web site directly affects how
well search engines can crawl, match and rank its pages. For this reason, searchabil-
ity should be an important concern in site design. Observations from this case study
indicate that there are large discrepancies in the relative searchability of bookselling
web sites. Many of the bookstore sites incorporated dynamic URLs that may be diffi-
cult pages for some WWW search engines to crawl, and unattractive targets for web
authors to direct hyperlinks to. Many bookstore sites were also marred by duplicate
content and confusing link graphs. Of the 35 evaluated bookstores 24 did not appear
in the top 1000 results in any of the evaluated search engines for any of the evaluated
books.
These results illustrate the importance of a combined approach to improving trans-
actional search. To improve effectiveness WWW search engines should endeavour to
discover more product pages, by performing deep crawls of provider sites and of
dynamic pages (especially those that are linked to directly). It is equally important
for bookstores to build a suitable site structure that allows search engines to perform
thorough crawls. To improve searchability, bookstores should use short non-changing
URLs (like NetstoreUSA) and encourage deep linking directly to their product pages
(like Amazon). It is submitted that these findings are likely to hold for other WWW
search tasks.
The amount of link evidence available for a bookstore, as observed in the link
coverage study, proved to be particularly important for achieving high rankings in
some search engines (such as Google [93]). The apparent heavy use of web evidence in](https://image.slidesharecdn.com/e71a8712-b24d-4089-ba76-c51104d8fb0e-150913153105-lva1-app6892/85/Upstill_Thesis_Revised_17Aug05-90-320.jpg)


![Chapter 5
Analysis of hyperlink
recommendation evidence
It is commonly stated that hyperlink recommendation measures help modern WWW
search engines rank “important, high quality” pages ahead of relevant, but less valu-
able pages, and to reject “spam” [97]. However, what exactly constitutes an “impor-
tant” or “high quality” page remains unclear [8]. Google has previously been shown
to perform well on a home page finding task [116] and the PageRank hyperlink rec-
ommendation algorithm may be a factor in this success.
This chapter presents an analysis of the potential for hyperlink recommendation
evidence to improve retrieval effectiveness in navigational search tasks, and to favour
documents that possess some “real-world quality” or “importance”. The analysis con-
siders PageRank and in-degree scores extracted from leading WWW search engines.
These scores are tested for bias and their usefulness is compared over corpora of home
page, non-home page and spam page documents. The hyperlink recommendation
scores are tested to determine the weight assigned to the home pages of companies
that exhibit “real-world” measures of quality. The measures of “real-world” qual-
ity investigated include whether favoured companies are highly profitable or well-
known. Less beneficial biases are also tested to examine whether hyperlink recom-
mendation scores favour companies based on their base industry or location.
5.1 Method
An analysis of score biases requires a set of candidate documents, the hyperlink rec-
ommendation scores for those documents, and, in order to test for bias, attributes by
which the candidate documents may be distinguished. In this experiment three sets
of candidate pages are identified from data relating to publicly listed companies and
links to known spam content. These form useful sets for analysis for reasons outlined
in the following sections. Hyperlink recommendation scores are sourced for each of
these pages using WWW search engines and tools. The attributes used to test rec-
ommendation score bias are gathered from listed company information and publicly
available company attributes. The data used in this experiment were extracted during
September 2003.
77](https://image.slidesharecdn.com/e71a8712-b24d-4089-ba76-c51104d8fb0e-150913153105-lva1-app6892/85/Upstill_Thesis_Revised_17Aug05-93-320.jpg)
![78 Analysis of hyperlink recommendation evidence
The following subsections detail methods used to amass the data for this exper-
iment. This includes a description of how candidate pages were selected, how the
salient company properties (used when evaluating bias) were sourced, and the meth-
ods used to extract hyperlink recommendation scores for each document.
5.1.1 Sourcing candidate pages
The home page set includes the home pages of public companies listed on the three
largest US stock exchanges: the New York Stock Exchange (NYSE), NASDAQ and the
American Stock Exchange (AMEX) (a total of 8329 companies were retrieved). The
home pages of publicly listed companies form a useful corpus as there is publicly
available information relating to company popularity, revenue, and other properties,
such as which industry the company belongs to. Furthermore, publicly listed compa-
nies are plausible targets for home page finding queries.
Company information was obtained from the stock exchange web sites, and in-
cluded the official company name, symbol and description. Then, using the company
information service at http://quote.fool.com/, 5370 unique company home
page URLs were identified. These URLs were almost always the root page of a host
(e.g. http://hostname.com/) without any file path (only fourteen URLs had some
path). These are considered to be the company home pages, even though in some
cases the root page is a Flash animation or another form of redirect. The company
information service also provided an industry for each stock e.g. “Real Estate”.
For comparison with these home pages, two further sets of pages were collected:
a non-home page set and a spam page set. Non-home pages were collected by sorting
company home pages by PageRank (extracted using methods outlined in the next
section) and selecting twenty home pages at a uniform interval. From these home
pages crawls of up to 100 pages were commenced (restricted to the company domain).
The overall PageRank distribution for the pages in the twenty crawls is shown in
Figure 5.1.
The spam page set was collected by sourcing 399 links pointing to a search engine
optimiser company (using Google’s link: operator). The spam pages were largely
content-free, having been created to direct traffic and PageRank towards the search
engine optimiser’s customers. After sourcing in-degrees, all pages with an in-degree
of zero were eliminated leaving 280 pages for consideration.
5.1.2 Company attributes
The set of company home pages was grouped into subsets according to their member-
ships and attributes, such as the Fortune 500 list [82] and the Wired 40 list of compa-
nies judged to be best prepared for the new economy [147]. The goal was to observe
how well PageRank and in-degree could predict inclusion in such lists.
Salient company properties were collected from the following web resources:
• The company information service at http://quote.fool.com provided com-
pany industry and location information.](https://image.slidesharecdn.com/e71a8712-b24d-4089-ba76-c51104d8fb0e-150913153105-lva1-app6892/85/Upstill_Thesis_Revised_17Aug05-94-320.jpg)
![§5.1 Method 79
0
50
100
150
200
250
300
0 1 2 3 4 5 6 7 8 9 10
#ofpagescrawled
PageRank
Figure 5.1: Combined PageRank distribution for the non-home page document set. The
non-home page document set was constructed by crawling up to 100 pages from a selection of
company webs. The observed PageRank distribution is not a power law distribution as might
be expected in PageRank distributions (see Section 2.4). These pages are more representative
of general WWW page population than the home page only set. The zero PageRanks are most
likely caused by pages not present in Google crawls, or through lost redirects, or through
small PageRanks being rounded to 0.
• The Fortune magazine provided the list of Fortune 500 largest companies (by rev-
enue) and Fortune Most Admired companies. Fortune 500 companies are those
with the highest revenue, based on publicly available data, listed by Fortune
Magazine (http://www.fortune.com/). The Fortune Most Admired com-
pany list is generated through peer review by Fortune Magazine.
• The Business Week magazine Top 100 Global Brands was sourced from
http://www.businessweek.com/magazine/content/03 31/b3844020
mz046.htm. This lists the most valuable brands from around the world, based
on publicly available marketing and financial data.
• The Wired 40 list of technology-ready companies was taken from Wired Mag-
azine and is available online at http://www.wired.com/wired/archive/
11.07/40main.html. The list contains the companies that Wired Magazine
believe are best prepared for the new economy.
In all cases the 2003 editions of the lists were used.
5.1.3 Extracting hyperlink recommendation scores
For each URL, PageRanks and in-degrees were extracted from search engines
Google [93] and AllTheWeb [80].
Unfortunately there is no way for researchers external to Google to access PageR-
anks used in Google document ranking. The only publicly available PageRank values
are provided in the Google toolbar [98] and through the Google directory [95]. When](https://image.slidesharecdn.com/e71a8712-b24d-4089-ba76-c51104d8fb0e-150913153105-lva1-app6892/85/Upstill_Thesis_Revised_17Aug05-95-320.jpg)
![80 Analysis of hyperlink recommendation evidence
a page is visited, the Toolbar lists its PageRank on a scale of 0 to 10, indicating “the im-
portance Google assigns to a page”.1 When a directory category is viewed, the pages
are listed in descending PageRank order with a PageRank indicator next to each page,
to “tell you at a glance whether other people on the web consider a page to be a high-
quality site worth checking out”.2 With PageRank provided directly in these ways,
it can be analysed as a direct indicator of quality, without needing to know whether
or how it is used in Google ranking. The PageRank from the Google Toolbar is inter-
esting as toolbar users may use it directly as a measure of document quality, and the
quality of this measure is unknown. Further, as it is sometimes claimed that Page-
Rank behaves differently on a large scale web graph, it may allow for some insight
into properties of WWW-based PageRank (to accompany results presented in Chap-
ter 7).
PageRanks were extracted from the Microsoft Internet Explorer Google Toolbar [98]
by visiting pages and noting the interaction between the Toolbar and Google servers.
To ensure consistency a single Google network (IP) address was used to gather Toolbar
data.3 When the requested URL resulted in a redirect, the PageRank was retrieved for
the final destination page (types of redirects are discussed in Section 3.1.3). During the
extraction process it was noted that PageRank values had been heavily transformed.
Actual PageRanks are power law distributed, so low PageRanks values should be
represented far more frequently than higher values. By contrast, the Toolbar reports
values in the range of 0 to 10, with all values frequently reported (see Figure 5.1). It
is likely that one reason for this transformation is to provide a more meaningful mea-
sure of page quality to toolbar users. Without such a transformation most documents
would achieve a Toolbar PageRank value of 0.
Several problems were faced when obtaining in-degree values. These could only
be reliably extracted for site home pages. Problems that have been identified in meth-
ods used by WWW search engines to estimate linkage include:
1. counting pages which simply mention a URL rather than linking to it,
2. not anchoring the link match, so that the count for http://www.apple.com
includes pages with http://www.apple.com.au and http://www.apple.
com/quicktime/, and
3. under reporting the in-degree, for example by systematically ignoring links from
pages with PageRanks less than four.4
Three methods for accessing in-degree estimates for a URL were evaluated (esti-
mates are reported in Figure 5.1):
1
From: http://toolbar.google.com/button help.html
2
From: http://www.google.com/dirhelp.html.
3
The Google Toolbar sources PageRank scores from one of several servers. During experiments it was
noted that the PageRank scores for the same page could differ according to which server was queried.
This effect is believed to be caused by out-of-date indexes being used on some servers.
4
This is believed to be the case in Google’s link counts, see
http://www.webmasterworld.com/forum80/254.htm](https://image.slidesharecdn.com/e71a8712-b24d-4089-ba76-c51104d8fb0e-150913153105-lva1-app6892/85/Upstill_Thesis_Revised_17Aug05-96-320.jpg)
![§5.2 Hyperlink recommendation bias 81
Extracted from Google
link: contains Page- AllTheWeb
in-degree ‘in-degree’ Rank in-degree
Min 0 0 0 0
Max 857 000 1 250 000 10 14 324 793
Mean 958 1910 5.3 17 889
Median 82 112 5 319
Apple 87 500 237 000 10 2 985 141
Table 5.1: Values extracted from Google [93] and AllTheWeb [80] for 5370 company home
pages in September 2003. Listed are range, mean, median and an example value (for Apple
Computer http://www.apple.com/).
• The first method used the Google query link:URL, which reportedly has prob-
lem 1.
• The second method used Google to find pages which contained the URL. This
solution was suggested by the Google Team,5 but it exhibits problems 1 and 2,
and also seems to only return pages which contain the URL in visible text.
• The third method used the AllTheWeb query link:URL -site:URL to re-
trieve in-degree values. The operator -site:URL was included because the
method has problem 2, and adding a -site:URL excludes all intra-site links,
and so eliminates many of the non-home page links and a few home page links.
All three types of in-degree estimates were found to be correlated with each other
(Pearson r > 0.7).
AllTheWeb in-degrees were chosen for comparison with Google PageRanks to
eliminate any potential search engine preference, and to ensure that in-degree sourc-
ing issue 3 did not impact correlations between in-degree and PageRank values. Both
search engines had independent crawls of a similar size (AllTheWeb crawls 3.1 billion
document, compared to Google’s 3.3 billion.6
Table 5.1 displays some pertinent properties of the extracted values, namely the
minimum, maximum, mean and median values of all extracted hyperlink recommen-
dation evidence.
5.2 Hyperlink recommendation bias
This section presents the results of an analysis of potential bias in hyperlink recom-
mendation scores. Biases considered include a preference for home pages, large fa-
5
As discussed in: http://slashdot.org/comments.pl?sid=75934&cid=6779776
6
The collection size was estimated to be 3.3 billion on http://www.google.com at September 2003;
as of November 2004 it is estimated to be around 8 billion documents on http://www.google.com.](https://image.slidesharecdn.com/e71a8712-b24d-4089-ba76-c51104d8fb0e-150913153105-lva1-app6892/85/Upstill_Thesis_Revised_17Aug05-97-320.jpg)
![82 Analysis of hyperlink recommendation evidence
mous companies, a particular country of origin, or the industry in which the company
operates.
5.2.1 Home page preference
Figure 5.2 shows the PageRank distributions for eight of the twenty crawls (distri-
butions for the other twelve crawls are included in Appendix E). The distributions
reveal that in almost every case, the company home page has the highest PageRank.
In every case at least some pages received lower PageRank than the home page. This
is not surprising, as links from one server to another usually target the root page of
the target server. In fact targeting deeper pages has even led to lawsuits [192].
5.2.2 Hyperlink recommendation as a page quality recommendation
Having considered intra-site hyperlink recommendation effects, inter-site compar-
isons are now considered.
5.2.2.1 Large, famous company preference
The Fortune 500 (F500), Fortune Most Admired and Business Week Top 100 Global
Brands lists provide good examples of large, famous companies, relative to the general
population of companies. Figure 5.3 shows that companies from these lists tended to
have higher PageRanks than other companies. However, there are examples of non-
F500 companies with PageRank 10 such as http://www.adobe.com. At the other
end of the spectrum, the Zanett group http://www.zanett.com has a F500 rank
of 363, but a PageRank of 3. This puts them in the bottom 6% of 5370 companies,
based on Toolbar advice.
The home pages of Fortune 500 and Most Admired companies receive, on av-
erage, one extra PageRank point. Business Week Top Brand companies receive, on
average, two extra PageRank points. Similar findings were observed for in-degree.
These findings support Google’s claim that PageRank indicates importance and qual-
ity. In-degree was observed to be an equally good indicator of popularity on all three
counts.
5.2.2.2 Country and technology preference
Given the diversity of WWW search users, a preference in hyperlink recommendation
evidence for a particular company, industry or geographical location may be undesir-
able. This section investigates biases towards technically-oriented and US companies.
As shown in Figure 5.4 a bias towards US companies was not observed. However,
it should be noted that all companies studied are listed in US stock exchanges. Further,
as a smaller regional stock exchange was included (AMEX) there may be a bias to-
wards non-US companies by virtue of comparing large international (globally listed)
companies with smaller (regionally listed) US companies. Perhaps if local Australian](https://image.slidesharecdn.com/e71a8712-b24d-4089-ba76-c51104d8fb0e-150913153105-lva1-app6892/85/Upstill_Thesis_Revised_17Aug05-98-320.jpg)
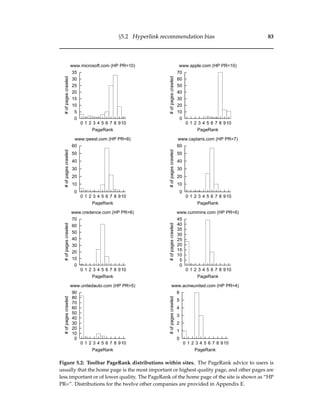
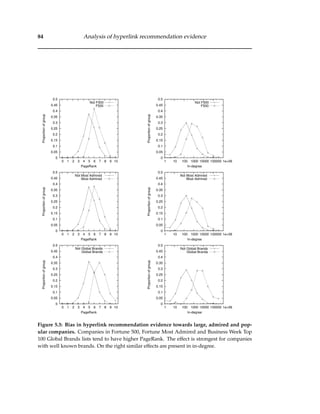
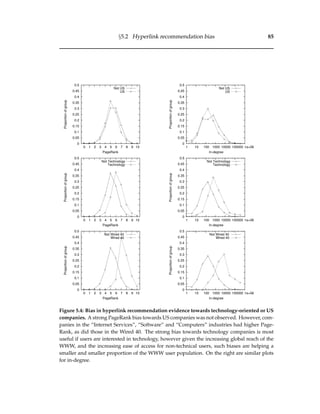
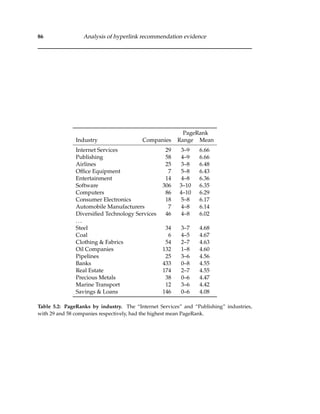
![88 Analysis of hyperlink recommendation evidence
1
10
100
1000
10000
100000
1e+06
1e+07
1e+08
0 1 2 3 4 5 6 7 8 9 10
AllTheWebin-degree
PageRank
Median in-degree
Figure 5.5: Toolbar PageRank versus in-degree for company home pages. For 5370 company
home pages, Toolbar PageRank and log of AllTheWeb [80] in-degree have a correlation of 0.767
(Pearson r). This high degree of correlation is achieved despite the relatively large spread of
PageRank zero pages. Such pages may have been missed by the Google crawler or indexer, or
might have been penalised by Google policy.
Stock URL Industry PageRank In-degree
AAPL http://www.apple.com Computers 10 2985141
YHOO http://www.yahoo.com Internet Services 9 5620063
AKAM http://www.akamai.com Internet Services 9 17359
EBAY http://www.ebay.com Consumer Services 8 737792
BDAL http://www.bdal.com Advanced Medical Supplies 8 199
GTW http://www.gateway.com Computers 7 170888
JAGI http://www.janushotels.com Lodging 7 64
FLWS http://www.1800flowers.com Retailers 6 38254
KB http://www.kookminbank.co.kr Banks 6 5
IO http://www.i-o.com Oil Drilling 5 235
FFFL http://www.fidelityfederal.com Savings & Loans 5 34
USNA http://www.usanahealthsciences.com Food Products 4 13353
RSC http://www.rextv.com Retailers 4 6
ESST http://www.esstech.com Semiconductors 3 22347
CAFE http://www.selectforce.net Restaurants 3 3
MCBF http://www.monarchcommunitybank.com Savings & Loans 2 6
WEFC http://www.wellsfinancialcorp.com Savings & Loans 2 1
PTNR http://investors.orange.co.il Wireless Communications 1 176
HMP http://www.horizonvascular.com Medical Supplies 1 5
VCLK http://www.valueclick.com Advertising 0 46659
Table 5.3: Extreme cases where PageRank and in-degree disagree. Even after cases where
AllTheWeb in-degrees which were in disagreement with the two Google in-degrees have been
eliminated, large disparities in scores were observed. The promotions and demotion of sites
relative to their in-degree ranking do not seem to indicate a more accurate assessment by
PageRank.](https://image.slidesharecdn.com/e71a8712-b24d-4089-ba76-c51104d8fb0e-150913153105-lva1-app6892/85/Upstill_Thesis_Revised_17Aug05-104-320.jpg)
![§5.3 Correlation between hyperlink recommendation measures 89
1
10
100
1000
10000
100000
1e+06
1e+07
1e+08
0 1 2 3 4 5 6 7 8 9 10
AllTheWebin-degreee
PageRank
Median in-degree (ignoring zeroes)
Median for companies (ignoring zeroes)
Figure 5.6: Toolbar PageRank versus in-degree for links to a spam company. The 280 spam
pages achieve good PageRank without needing massive numbers of in-links. In some cases,
they achieve good PageRank with few links. Pages with PageRank 6 had a median in-degree
of 1168 for companies and 44 for spam pages.
appear to indicate any systematic additional preference for higher “real-world qual-
ity”.
5.3.2 For spam pages
One claimed benefit of PageRank over in-degree is that it is less susceptible to link
spam [103]. To test this claim the in-degree and PageRank scores for 280 spam pages
were compared. The relationship is plotted in Figure 5.6.
If PageRank were spam-resistant one might expect high in-degree spam pages to
have low PageRank. Such a case would be placed in the top left quadrant of the scat-
ter plots. However, for the 280 spam pages the effect is minimal, and in some cases
the opposite. For example, the median in-degree values for a PageRank score of 6
were 1168 for company home pages and 44 for spam pages. Spam pages tended to
achieve a PageRank of 6 seemingly with fewer incoming links than legitimate compa-
nies.
It is possible that any pages which did fall in the top left quadrant had already been
excluded from Google. However, this still shows that Google cannot rely entirely on
PageRank for eliminating spam. This is not surprising when considering the extreme
case: a legitimate page such as an academic’s home page might have an in-degree
of 10, while a search engine optimiser has massive resources to generate link spam
from thousands or millions of pages.](https://image.slidesharecdn.com/e71a8712-b24d-4089-ba76-c51104d8fb0e-150913153105-lva1-app6892/85/Upstill_Thesis_Revised_17Aug05-105-320.jpg)

![94 Combining query-independent web evidence with query-dependent evidence
The following sections outline the query and document set, the scoring methods
used to generate the query-dependent baselines, how hyperlink recommendation ev-
idence was gathered, and methods for combining query-dependent baselines with
query-independent web evidence.
6.1.1 Query and document set
The document corpus consisted of the home pages of the publicly listed companies
used in experiments in Chapter 5. The corpus consisted of 5370 home page
documents – one for each company on a prominent US stock exchange (NYSE, NAS-
DAQ and NYSE) for which a home page URL was found (see Section 5.1.1).
As little useful anchor-text information was contained in the set of downloaded
documents (because companies rarely link to their competitors home pages), the
anchor-text evidence was gathered from the Google WWW search engine [93]. This
WWW-based anchor-text evidence was sourced for a 1000 page sample selected at
random from the set of company home pages. For each of these pages 100 back-links1
were retrieved using Google’s “link:” operator (as described in Appendix C). Each
back-link identified by Google was parsed and anchor-text snippets whose target was
the company home page were added to the aggregate anchor-text for that page.
The query set consisted of the official names for all 5370 companies, and the correct
results were the named company’s home page. For example, for the query
“MICROSOFT CORP” the correct answer was the document downloaded from http:
//www.microsoft.com.
The retrieval effectiveness for both the anchor-text and full-text baselines is likely
to be higher than would be expected for a complete document corpus. In the full-
text baseline the inclusion of only the home pages of candidate companies discounts
many pages that may also match company naming queries. In particular, in a more
complete document corpus, non-homepage documents on a company’s website might
achieve higher match scores than that company’s home page (such as a company con-
tact information page). The anchor-text baseline is also likely to achieve unrealistically
high retrieval effectiveness even given the incomplete aggregate anchor-text evidence
examined (only 100 snippets of anchor-text are retrieved per home page). This is be-
cause the aggregate anchor-text corpus only contains text that is used to link to one
of the evaluated companies, and so will be unlikely to contain much misleading or
ill-targeted anchor-text.
6.1.2 Query-dependent baselines
Three query-dependent baselines were evaluated: content, anchor-text and
content+anchor-text.
• The content baseline was built by scoring the full-text of the downloaded home
pages using Okapi BM25 with untrained parameters (k1 = 2 and b = 0.75) [172]
1
A back-link is a document that has a hyperlink directed to the page under consideration.](https://image.slidesharecdn.com/e71a8712-b24d-4089-ba76-c51104d8fb0e-150913153105-lva1-app6892/85/Upstill_Thesis_Revised_17Aug05-110-320.jpg)
![§6.1 Method 95
(described in section 2.3.1.3).
• The anchor-text baseline was built by scoring aggregate anchor-text documents
using Okapi BM25 with the same parameters as used for content (described in
Section 2.4.1).
• The content+anchor-text baseline was built by scoring document full-text and ag-
gregate anchor-text concurrently using Field-weighted Okapi BM25 [173] (de-
scribed in Section 2.5.2.1). The field-weights for document full-text (content) and
aggregate anchor-text were set to 1, and k1 and b were set to the same values
used in the content and anchor-text baselines [173]. The content+anchor baseline
was computed for the set of pages for which anchor-text was retrieved.
6.1.3 Extracting PageRank
Google’s PageRank scores were extracted from the Google Microsoft Internet Explorer
Toolbar using the method described in Section 5.1.3. These scores were calculated by
Google [93] for a 3.3 billion page crawl.2
6.1.4 Combining query-dependent baselines with query-independent web
evidence
Many different schemes have been proposed for combining query-independent and
query-dependent evidence. Kraaij et al. [135] suggest measuring the query-
independent evidence as the probability of document relevance and treating it as a
prior in a language model (see Section 2.5.2.2). However, because Okapi BM25 scores
are weights rather than probabilities, prior document relevance cannot be directly
incorporated into the model. Westerveld et al. [212] also make use of linear combi-
nations of normalised scores, but for this to be useful with PageRank, a non-linear
transformation of the scores would almost certainly be needed:3 the distribution of
Google’s PageRanks is unknown, and those provided via the Toolbar have been ob-
served not to follow a power law (see Section 5.1.3). Savoy and Rasolofo [178] combine
query-dependent URL length evidence with Okapi BM25 scores by re-ranking the top
n documents on the basis of the URL scores (described in Section 2.5.1.2). The benefit
of this type of combination is that it does not require knowledge of the underlying
data distribution.
The three combination methods examined in this experiment are: retrieving only
those documents that exceed a PageRank threshold (see Section 2.5.1.5), using Page-
Rank as rank based (quota) re-ranking of query-dependent baselines, and using Page-
Rank in a score-sensitive re-ranking of query-dependent baselines. The re-ranking
approaches are variations on those proposed by Savoy and Rasolofo, and are used
2
The collection size was estimated to be 3.3 billion on http://www.google.com at September 2003;
as of November 2004 it is estimated to be around 8 billion documents on http://www.google.com.
3
This is because while most PageRanks are very low a few are orders of magnitude larger, as Page-
Rank values are believed to follow a power law distribution (see Section 2.4).](https://image.slidesharecdn.com/e71a8712-b24d-4089-ba76-c51104d8fb0e-150913153105-lva1-app6892/85/Upstill_Thesis_Revised_17Aug05-111-320.jpg)
![96 Combining query-independent web evidence with query-dependent evidence
because they do not require any knowledge of the global distribution of Google’s
PageRank values [178].
The use of a minimum PageRank threshold that pages need to exceed prior to
inclusion is equivalent to ranking results by PageRank evidence and then re-ranking
above a score-based threshold using query-dependent evidence. The use of a static4
minimum query-independent threshold value means that some pages will never be
retrieved, and so could be removed from the corpus. To enable the retrieval of pages
that do not exceed the static threshold value, a dynamic threshold function could be
used. Such a function could reduce the minimum threshold if some condition is not
met (for example if less than ten pages are matched). Such a scheme is discussed
further in Section 10.3.
The re-ranking experiments explore two important scenarios. In the first, Page-
Rank plays a large role in ranking documents; though a quota-based combination. In
the quota-based combination all documents retrieved within the top n ranks in the
query-dependent baseline are re-ranked by PageRank. In the second scenario Page-
Rank has a smaller contribution and is used to re-order documents that achieve query-
dependent scores within n% of the highest baseline score (per query). This is termed
a score-based combination. In both cases if the re-ranking cutoffs are sufficiently large,
then all baseline documents will be re-ranked by PageRank order.
6.2 Results
This section reports the effectiveness of the baselines and the three evaluated combi-
nation methods.
6.2.1 Baseline performance
The effectiveness of the three baselines varied considerably:
• The content baseline retrieved the named home page at the first rank for only
two-out-of-five queries, and within the first ten results for a little over half the
queries (S@1 = 0.42, S@10 = 0.55).
• The anchor baseline performed well, retrieving three-out-of-four companies at
the first rank (S@1 = 0.725, S@10 = 0.79).
• The content+anchor baseline performed well, also retrieving three-out-of-four
companies at the first rank (S@1 = 0.729, S@10 = 0.82).
The performance of the full-text (content) baseline was poor given the small size of
the corpus from which the home pages were retrieved. A small benefit was observed
when adding full-text evidence to the anchor-text baseline.
4
A threshold value that does not change between queries.](https://image.slidesharecdn.com/e71a8712-b24d-4089-ba76-c51104d8fb0e-150913153105-lva1-app6892/85/Upstill_Thesis_Revised_17Aug05-112-320.jpg)
![§6.2 Results 97
6.2.2 Using a threshold
0
20
40
60
80
100
0 1 2 3 4 5 6 7 8 9 10
%ofpagesthatexceedthePageRankvalue
PageRank
Home pages
Other pages
Figure 6.1: The percentage of home pages and other pages that exceed each PageRank value.
Implementing a PageRank threshold minimum value of 1 would lead to the inclusion of 99.7%
of the home pages, while reducing the number of other pages retrieved by 16.1%.
Figure 6.1 illustrates the percentage of home pages and non-home pages5 that ex-
ceed each PageRank value. Implementing a PageRank threshold value of 1 leads to
the inclusion of 99.7% of the home pages, while significantly reducing the number of
other pages retrieved (by 16.1%, to 83.9% of pages). The non-home page PageRanks
examined here may be somewhat inflated relative to those on the general WWW, as
they were retrieved using a (breadth first) crawl halted after 100 pages. It has been
reported that WWW in-links are distributed according to the power law [35]. Thus,
assuming the distribution of PageRank is similar to that of in-degree,6 setting a thresh-
old at some small PageRank is likely to eliminate many pages from ranking consid-
eration. In a home page finding system this may provide substantial computational
performance gains and little (if any) degradation in home page finding effectiveness.
6.2.3 Re-ranking using PageRank
Results for the quota-based combination are presented in Figure 6.2. Re-ranking by
quota severely degrades performance, with a re-ranking of the top two results in the
full-text (content) baseline decreasing the percentage of home pages retrieved at the
5
The hyperlink recommendation values extracted for the set of “non-home page” documents, de-
scribed in Section 5.1.1.
6
The distribution of Google’s PageRanks for company home pages was observed not to follow a
power-law distribution (Figure 5.1), although the Google PageRanks are likely to have been normalised
and transformed for use in the Toolbar. The PageRanks calculated for use in experiments in Chapter 7
do exhibit a power law distribution (see Section 7.6.1).](https://image.slidesharecdn.com/e71a8712-b24d-4089-ba76-c51104d8fb0e-150913153105-lva1-app6892/85/Upstill_Thesis_Revised_17Aug05-113-320.jpg)
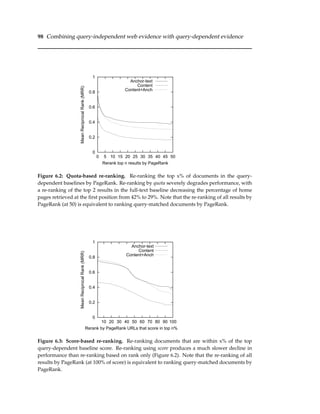
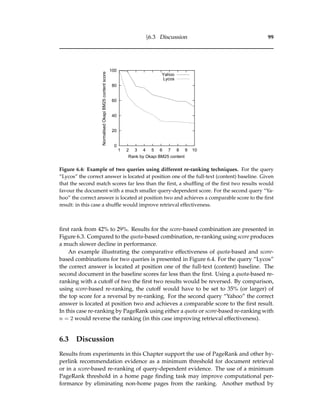
![100Combining query-independent web evidence with query-dependent evidence
which computational efficiency could be improved is by ranking documents using
aggregate anchor-text evidence only (which also implicitly imposes a threshold of in-
degree ≥ 1). An anchor-text index would be much smaller than a full-text index and
therefore likely to be more efficient.
Quota-based re-ranking was observed to be inferior to score-based re-ranking. This
illustrates the negative effects of not considering relative query-dependent scores when
combining baselines with query-independent evidence. Further, this suggests that
query-independent evidence should not be relied upon to identify the most relevant
documents. Pages that achieve high query-independent scores are likely to be im-
portant pages in the corpus (such as the home pages of popular, large or technology-
oriented companies, as reported in Chapter 5), but may not necessarily be more rele-
vant (and indeed, in this experiment, might be the “wrong” home pages).
The results from experiments in this Chapter also re-enforce the previously ob-
served importance of aggregate anchor-text for effective home page finding [56]. The
correct home page was retrieved at the first rank in the anchor-text baseline for three-
out-of-four queries, compared to being retrieved at the first rank for only two-out-of-
five queries in the full-text baseline. While the baseline retrieval effectiveness in this
experiment may be unrealistically high, these findings show that there is generally
adequate anchor-text evidence, even when using only 100 snippets, to find the home
pages of publicly listed companies. Combining the full-text and aggregate anchor-text
evidence in a field-weighted combination, resulted in a slight improvement in home
page finding effectiveness.
The next chapter investigates whether query-independent evidence can be used
to improve home page finding effectiveness for small-to-medium web corpora. The
experiments include evaluations of the effectiveness of minimum query-independent
evidence thresholds, score-based re-ranking of query-dependent baselines by query-
independent evidence, and of aggregate anchor-text-only indexes.](https://image.slidesharecdn.com/e71a8712-b24d-4089-ba76-c51104d8fb0e-150913153105-lva1-app6892/85/Upstill_Thesis_Revised_17Aug05-116-320.jpg)
![102 Home page finding using query-independent web evidence
evidence (in-degree, two PageRank variants and URL-type, described below) were
computed during indexing. Following indexing, the top 1000 documents for each
query-dependent baseline were retrieved. Three query-dependent baselines were
studied; one based solely on document full-text, one based solely on document ag-
gregate anchor-text, and one consisting of both forms of evidence. The baselines were
then combined with query-independent scores using three combination methods. The
first method used query-independent evidence as a threshold, such that documents
that did not exceed the threshold were not retrieved (shown to be a promising ap-
proach in Chapter 6). The second method explored the optimal improvement that
could be gained when combining query-independent evidence with query-dependent
baselines using a linear combination of scores. The final combination method was a
score-based re-ranking of query-dependent baselines by query-independent evidence
(also shown to be a promising approach in Chapter 6). The improvements in effec-
tiveness achieved through these combination methods were then measured and com-
pared.
Throughout the experiments the Wilcoxon matched-pairs signed ranks test was
performed to determine whether improvements afforded were significant. This test
compares the algorithms according to the (best) ranks achieved by correct answers,
rather than the success rate measure. A confidence criterion of 95% (α = 0.05) is used.
Success rates (described in Section 2.6.6.2) were used to evaluate retrieval effec-
tiveness. The success rate measure is indicated by S@n where n is the cutoff rank.
S@n results were computed for n = 1, 5, 10.
The following sections give a description of the query-independent and query-
dependent baselines, outline the test collections used in the experiments and their
salient properties, and discuss the methods used to combine query-independent and
query-dependent evidence.
7.1.1 Query-independent evidence
Four types of query-independent evidence were considered:
IDG the document’s in-degree score (described in Section 2.4.3.1);
DPR the document’s Democratic PageRank score (described in Section 3.3.2);
APR the document’s Aristocratic PageRank score, using bookmarks from the Yahoo!
directory [217] or other web directory listings, which might be available to a
production search system (described in Section 3.3.2);
URL the document’s URL-type score, through a re-ranking by the UTwente/TNO
URL-type [135] (described in Section 2.3.3.2). The URL-types were scored ac-
cording to Root > Subroot > Directory > File.
7.1.2 Query-dependent baselines
The relative improvements achieved over three query dependent baselines were ex-
amined. The baselines were:](https://image.slidesharecdn.com/e71a8712-b24d-4089-ba76-c51104d8fb0e-150913153105-lva1-app6892/85/Upstill_Thesis_Revised_17Aug05-118-320.jpg)
![§7.1 Method 103
• content baselines built by scoring document full-text using Okapi BM25 with
default parameters (k1 = 2 and b = 0.75) (see Section 2.3.1.3) [172].
• anchor-text baselines built using the methods outlined previously (i.e. by record-
ing all anchor-text pointing to each document and building a new aggregate
document containing all source anchor-text). The aggregate anchor-text docu-
ments were scored using Okapi BM25 using the same parameters as content.
• content+anchor-text baselines built by using Field-weighted Okapi BM25 [173]
to build and score composite documents containing document full-text and ag-
gregate anchor-text evidence. The baseline was scored with document full-text
and anchor-text field-weights set to 1, and k1 and b as above (see Section 2.5.2.1)
[173].
7.1.3 Test collections
Effectiveness improvements were evaluated using five test collections that spanned
three small-to-medium sized web corpora. The test corpora used in the evaluation in-
cluded a 2001 crawl of a university web (the ANU), and the TREC corpora VLC2 [106]
and WT10g [15]. Detailed collection information is reported in Table 7.1 and a further
discussion of the TREC collection properties appears in Section 2.6.7. Note that since
experiments published in Upstill et al. [201] the link tables have been re-visited and
further duplicates and equivalences removed (using methods described in Chapter 3).
This has resulted in some non-statistically significant changes in retrieval effective-
ness.
Test Pages Links Dead Content Anchor No. of Book-
Collection Size (million) (million) links queries queries marks (APR)
ANU 4.7GB 0.40 6.92 0.646 97/100 99/100 439
WT10gC 10GB 1.69 8.06 0.306 93/100 84/100 25 487
WT10gT 10GB 1.69 8.06 0.306 136/145 119/145 25 487
VLC2P 100GB 18.57 96.37 3.343 95/100 93/100 77 150
VLC2R 100GB 18.57 96.37 3.343 88/100 77/100 77 150
Table 7.1: Test collection information. The experiments were performed for five test collec-
tions spanning three small-to-medium sized web corpora. Two sets of queries were submitted
over the VLC2 collection - a popular set (VLC2P) and a random set (VLC2R) (see text for expla-
nation). The two sets computed for WT10g were the set used by Craswell et al. [56] (WT10gC)
and the official queries used in the TREC 2001 home page finding task (WT10gT). The values
in the “Content” and “Anchor” queries columns show the number of home pages found by
the baseline out of the number of queries submitted (this is equivalent to S@1000, as the top
1000 results for each search are considered).](https://image.slidesharecdn.com/e71a8712-b24d-4089-ba76-c51104d8fb0e-150913153105-lva1-app6892/85/Upstill_Thesis_Revised_17Aug05-119-320.jpg)
![104 Home page finding using query-independent web evidence
Although there are many spam pages on the WWW, little spam was found in the
three corpora. Any spam-like effect observed seemed unintentional. For example, the
pages of a large bibliographic database all linked to the same page, thereby artificially
inflating its in-degree and PageRank.
In each run, sets of 100 or more queries were processed over the applicable corpus
using the chosen baseline algorithm. The first 1000 results for each were recorded.
While all queries have only one correct answer, that answer may have multiple cor-
rect URLs, e.g. a host with two aliases. If multiple correct URLs were retrieved the
minimum baseline rank was used (i.e. earliest in the ranked list of documents) and
had assigned to it the best query-independent score of all the equivalent URLs. This
approach introduces a slight bias in favour of the re-ranking algorithms, ensuring
that any beneficial effect will be detected. If a correct document did not appear in the
top 1000 positions a rank of 1001 was assigned.
These experiments investigated two home page finding scenarios: queries for pop-
ular and random home pages.1 Popular queries allow the study of which forms of
evidence achieve high effectiveness when ranking for queries targeting high profile
sites. Random queries allow the study of effective ranking for any home page, even if
it is not well known.
The ANU web includes a number of official directories of internal sites. These site
directories can be used as PageRank bookmarks. This allows for the evaluation of
APR in a single-organisation environment. Test home pages were picked randomly
from these directories and then queries were generated manually by navigating to a
home page, and formulating a query based on the home page name2. Consequently
APR might be expected to perform well on this collection.
The query set labelled WT10gC [56] was created by randomly selecting pages
within the WT10g corpus, navigating to the corresponding home page, and formu-
lating a query based on the home page’s name. The WT10gC set was used as training
data in the TREC-2001 web track. The query set labelled WT10gT was developed
by the NIST assessors for the TREC-2001 web track using the same method. Wester-
veld et al. [212] have previously found that the URL-type method improved retrieval
performance on the WT10gT collection. Using the method outlined in Section 3.3.2,
every Yahoo-listed page in the WT10g collection is bookmarked in the APR calcula-
tion. These are lower quality bookmarks than the ANU set as the bookmarks played
no part in the selection of either query set.
Two sets of queries were evaluated over the VLC2 collection, popular (VLC2P) and
random (VLC2R). The popular series was derived from the Yahoo! directory. The ran-
dom series was selected using the method described above for WT10g. For the APR
calculation every Yahoo-listed page in the collection was bookmarked. As such, the
bookmarks were well matched to the VLC2P queries (also from Yahoo!), but less so
for the VLC2R set.
1
Note that the labels popular and random were chosen for simplicity and are derived from the method
used to choose the target answer, not from the nature of the queries. Information about query volumes
is obviously unavailable for the TREC test collections and were not used in the case of ANU.
2
This set was generated by Nick Craswell in 2001.](https://image.slidesharecdn.com/e71a8712-b24d-4089-ba76-c51104d8fb0e-150913153105-lva1-app6892/85/Upstill_Thesis_Revised_17Aug05-120-320.jpg)
![§7.1 Method 105
The home page results for the ANU and VLC2P query sets are considered popular
because they are derived from directory listings. Directory listings have been chosen
by a human editor as important, possibly because they are pages of interest to many
people. Such pages also tend to have above average in-degree. This means that more
web page editors have chosen to link to the page, directing web surfers (and search
engine crawlers) to it.
On all these corpora anchor-text ranking has been shown to improve home page
finding effectiveness (relative to full-text-only) [15, 56].
7.1.4 Combining query-dependent baselines with query-independent evi-
dence
Throughout these experiments there is a risk that a poor choice of combining function
could lead to a spurious conclusion. The combination of evidence experiments in the
previous chapter outlined two methods for combining query-independent and query-
dependent evidence which may be effective: the use of minimum threshold values
and score-based re-ranking. This chapter includes a further combination scheme – an
Optimal re-ranking.
The Optimal re-ranking is an unrealistic re-ranking, and is termed “Optimal” to
distinguish it from a re-ranking that could be used in a production web search sys-
tem.3 In the Optimal combination experiments, the maximum possible improvement
when combining query-independent evidence with query-dependent evidence using
a linear combination is gauged. This is done by locating the right answer in the base-
line (obviously not possible in a practical system) and re-ranking it and the docu-
ments above it, on the basis of the query-independent score alone (as illustrated in
Figure 7.1). This is an unrealistic combination, if this information were known in prac-
tice, perfection could easily be achieved by swapping the document at that position
with the document at rank one. Indeed, no linear combination or product of query-
independent and query-dependent scores (assuming positive coefficients) could im-
prove upon the Optimal combination. This is because documents above the correct
answer score as well or better on both query-independent and query-dependent com-
ponents (see Figure 7.1). In Optimal experiments a control condition random was intro-
duced in which the correct document and all those above it were arbitrarily shuffled.
Throughout re-ranking experiments if the query-independent scores are equal,
then the original baseline ordering is preserved.
The following sections report and discuss the results for each combination method.
The use of minimum query-independent evidence thresholds is investigated first,
followed by re-ranking using the (unrealistic) Optimal combination, and finally re-
ranking using the (realistic) score-based re-ranking.
3
The Optimal re-ranking relies on knowledge of the correct answer within the baseline ranking.](https://image.slidesharecdn.com/e71a8712-b24d-4089-ba76-c51104d8fb0e-150913153105-lva1-app6892/85/Upstill_Thesis_Revised_17Aug05-121-320.jpg)
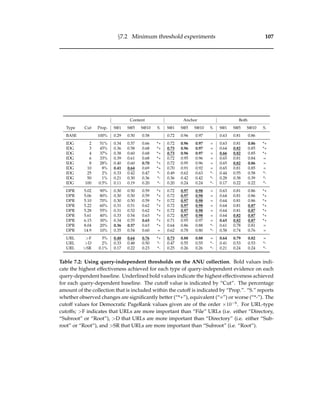
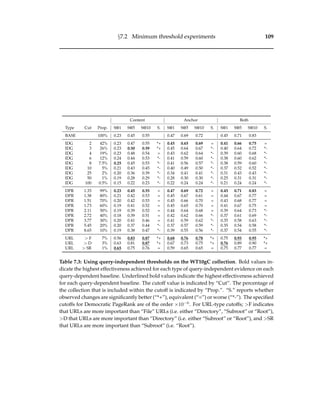
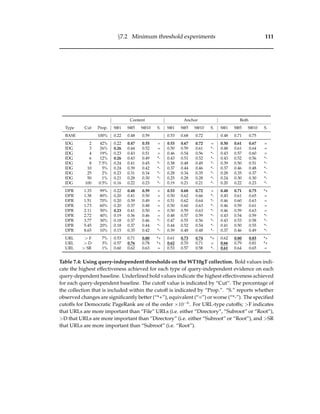
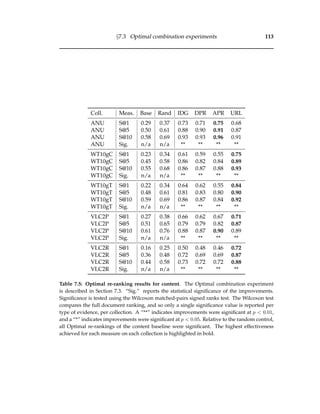
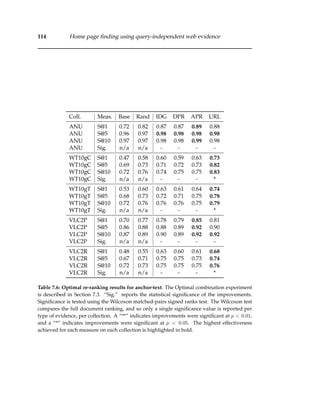
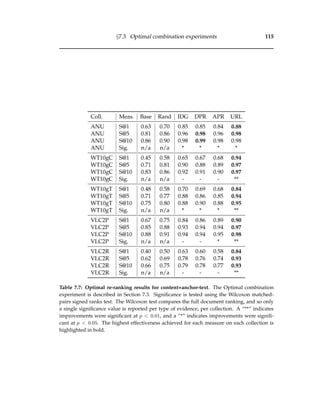
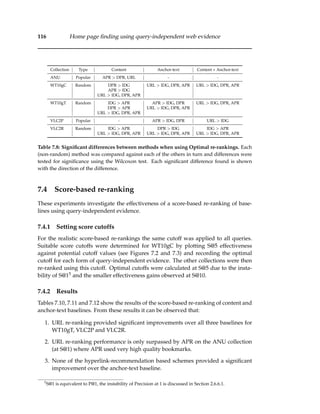
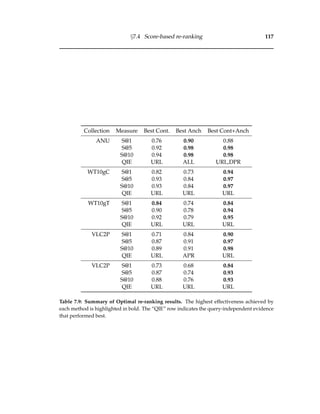
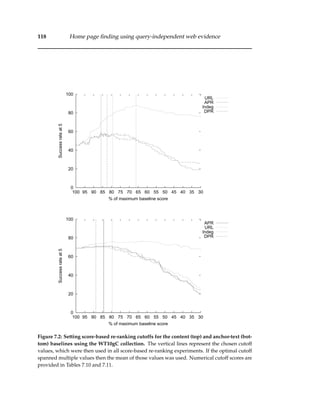
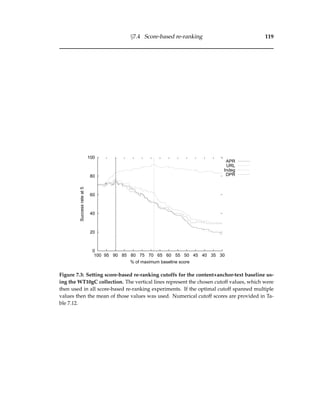
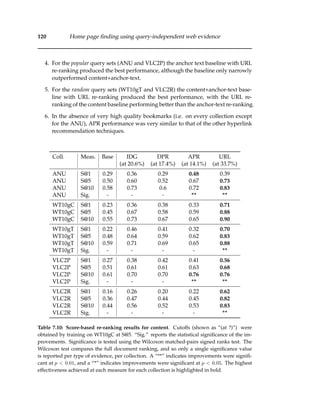
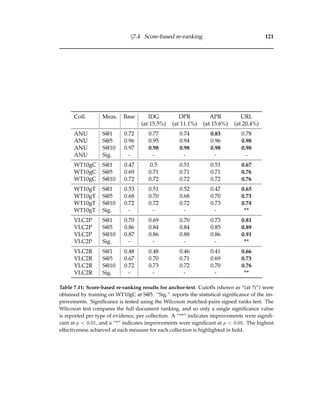

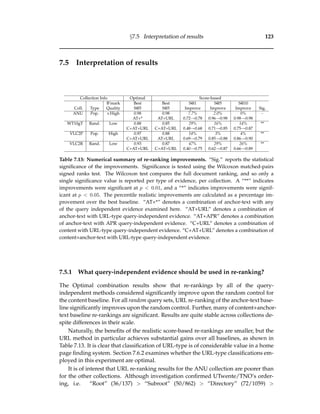
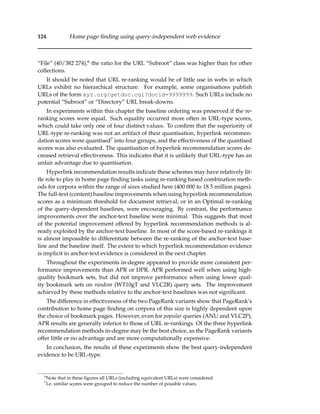
![§7.6 Further experiments 125
7.5.2 Which query-dependent baseline should be used?
In the experiments, prior to re-ranking, the anchor-text baseline generally outper-
formed the content and content+anchor-text baselines. However, on two collections,8
URL-type re-rankings of full-text (content) outperformed similar re-rankings of
anchor-text. In these two cases the target home pages were randomly chosen. This
effect was not observed for the popular targets, although the content+anchor-text per-
formance was comparable to that of anchor-text only.
Figure 7.4 illustrates the difference between the random and popular sets by plotting
S@n against n for the content and anchor-text baselines. For the popular query set, the
two baselines converge at about n = 500, but for the random set the content baseline is
clearly superior for n > 150. The plot for VLC2R is similar to that observed in a pre-
vious study of content and anchor-text performance on the WT10gT collection [135].
An explanation for the observed increase in effectiveness of the content baseline
above n > 150 is that while anchor-text rankings are better able to discriminate be-
tween home pages and other relevant pages, full anchor-text rankings are shorter9
than those for content. Some home pages have no useful incoming anchor-text and
therefore do not appear anywhere in the anchor-text ranking. By contrast, most home
pages do contain some form of site name within their content and will eventually
appear in the content ranking.
Selecting queries from a directory within the collection guarantees that the anchor
document for the target home page will not be empty, but there is no such guarantee
for randomly chosen home pages. Selection of home pages for listing in a directory
is undoubtedly biased toward useful, important or well-known sites which are also
more likely to be linked to from other pages (Experiments in Chapter 5 observed that
PageRank does favour popular pages). It should be noted that incoming home page
queries would probably also be biased toward this type of site.
In conclusion, the results of the experiments show the content+anchor-text base-
line to be the most consistent performer across all tasks, and to perform particularly
well when combined with URL-type evidence.
7.6 Further experiments
Having established the principal results above, a series of follow-up experiments was
conducted. In particular these investigated:
• to what extent results can be understood in terms of rank and score distributions;
• whether other classifications of URL-type provide similar, or superior, gains in
retrieval effectiveness;
8
Of the four evaluated. The WT10gC test collection is not included as it was used to train the re-
ranking cutoffs.
9
Ignoring documents that achieve a score of zero.](https://image.slidesharecdn.com/e71a8712-b24d-4089-ba76-c51104d8fb0e-150913153105-lva1-app6892/85/Upstill_Thesis_Revised_17Aug05-141-320.jpg)
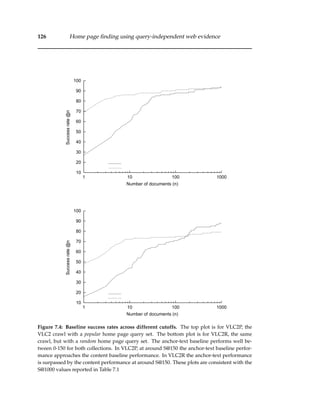
![§7.6 Further experiments 127
• to what extent the PageRanks and in-degrees are correlated with those reported
by Google; and
• whether the use of anchor-text and link graph information external to the corpus
could improve retrieval effectiveness.
7.6.1 Rank and score distributions
This section analyses the distribution of correct answers for each type of evidence over
the WT10gC collection.
The content and anchor-text baseline rankings of the correct answers are plotted
in Figure 7.5. In over 50% of occasions both the content and anchor-text baselines
contain the correct answer within the top ten results. Anchor-text provides the better
scoring of the two baselines, with the correct home page ranked as the top result for
almost 50% of the queries. This confirms the effectiveness of anchor-text for home
page finding [15, 56]).
The PageRank distributions are plotted in Figure 7.6. The distribution of the De-
mocratic PageRank scores for all pages follow a power law. In contrast, the PageRank
distribution for correct answers is much more even, with the proportion of pages that
are correct answers increasing at higher PageRanks. There are many pages which
do not achieve an APR score. Merely having an APR score > 0 gives some indica-
tion that a page is a correct answer in the WT10gC collection. These plots indicate
that both forms of PageRank provide some sort of home page evidence (as observed
in Chapter 5), even though these computed PageRank values differ markedly from
those mined from the Google toolbar in Chapter 5. This large difference re-affirms the
belief that PageRanks reported by the Google toolbar have been heavily transformed.
The in-degree distribution is plotted at the top of Figure 7.7 and is similar to the
Democratic PageRank distribution. However, the graph is slightly shifted to the left,
indicating that there are more pages with low in-degrees than there are pages with
low PageRanks. The distribution of correct answers is spread across in-degree scores,
with the proportion of pages that are correct answers increasing at higher in-degrees.
This shows that in-degree also provides some sort of home page evidence.
The URL-type distribution is plotted on the right in Figure 7.7. URL-type is a
particularly useful home page indicator for this collection, with a large proportion of
the correct answers located in the “Root” class and few correct answers located within
the “File” class.
7.6.2 Can the four-tier URL-type classification be improved?
This section evaluates how combining the four URL-type classes and introducing
length and directory depth based scores impacts retrieval effectiveness. The results
for this series of experiments are presented in Table 7.14.
None of the new URL-type methods significantly improved upon the performance
of the original URL-type classes (“Root” > “Subroot” > “Directory” > “File”). How-
ever, combining the “Subroot” and “Directory” classes did not adversely affect URL-](https://image.slidesharecdn.com/e71a8712-b24d-4089-ba76-c51104d8fb0e-150913153105-lva1-app6892/85/Upstill_Thesis_Revised_17Aug05-143-320.jpg)
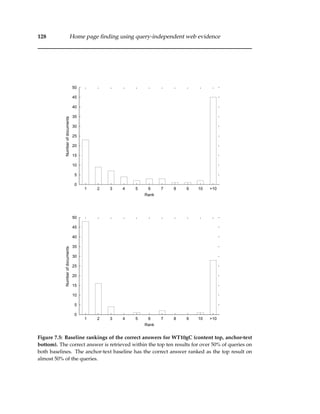
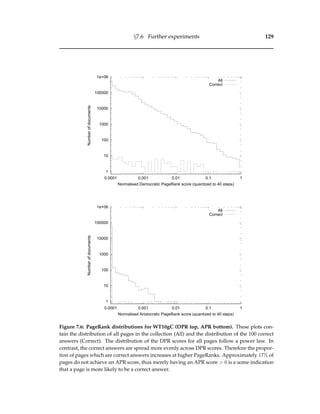
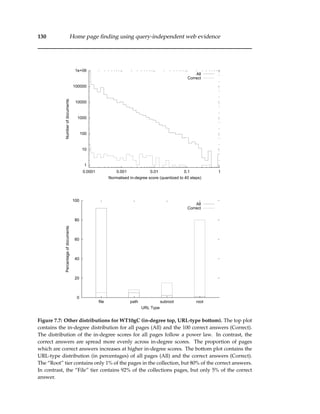
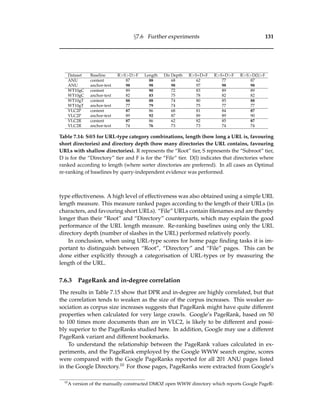
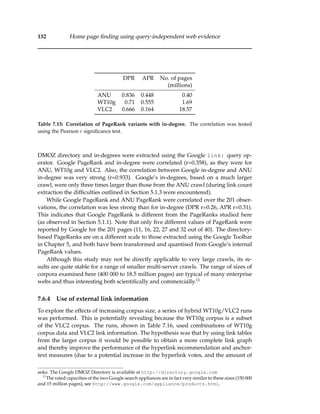
![§7.7 Discussion 133
available anchor-text). During these hybrid runs all VLC2 anchor-text that pointed to
pages outside the WT10g corpus was removed.
WT10g anchor-text VLC2 anchor-text
DPR DPR DPR DPR
— WT10g VLC2 — WT10g VLC2
WT10gC 0.69 0.72 0.69 0.78 0.79 0.78
WT10gT 0.68 0.71 0.71 0.72 0.72 0.73
Table 7.16: Using VLC2 links in WT10g. Note that the WT10g collection is a subset of the
VLC2 collection. The WT10g anchor-text scores are the baselines used throughout all other ex-
periments in this chapter. The VLC2 anchor scores are new rankings that use external anchor-
text from the VLC2 collection. WT10g DPR is a Democratic PageRank re-ranking using the
link table from the WT10g collection. VLC2 DPR is a Democratic PageRank re-ranking using
the link table from the VLC2 collection. The use of the (larger) VLC2 link table DPR scores did
not significantly improve the performance of DPR re-ranking. The use of external anchor text,
taken from the VLC2 collection, provided significant performance gains.
Surprisingly, the use of the (larger) VLC2 link table DPR scores did not noticeably
improve the performance of DPR re-ranking. However, the use of external anchor-
text, taken from the VLC2 corpus, provided significant performance gains. This would
suggest that in situations where an enterprise or small web has link information for
a larger web, benefits will be seen if the anchor-text from the external link graph is
recorded and used for the smaller corpus.12
The WT10g collection is not a uniform sample of VLC2, but was engineered to
maximise the interconnectivity of the documents selected [15]. Hence the effects of
scaling up may be smaller than would be expected in other web corpora.
7.7 Discussion
Using query-independent evidence scores as a minimum threshold for page inclusion
appears to be a useful method by which system efficiency can be improved without
significantly harming home page finding effectiveness. The use of hyperlink recom-
mendation evidence as a threshold resulted in a reduction of 10% of the corpus with-
out affecting a change in retrieval effectiveness. By comparison, using a URL-type
threshold of “> File”, corpus size was reduced by over 90%, and retrieval effective-
ness was significantly improved for two-out-of-three collections.
12
This was later investigated further by Hawking et al. [115] who found that the use of external anchor-
text did not improve retrieval effectiveness.](https://image.slidesharecdn.com/e71a8712-b24d-4089-ba76-c51104d8fb0e-150913153105-lva1-app6892/85/Upstill_Thesis_Revised_17Aug05-149-320.jpg)
![134 Home page finding using query-independent web evidence
Re-ranking query-dependent baselines (both content and anchor-text) on the basis
of URL-type produced consistent benefit. This heuristic would be a valuable compo-
nent of a home page finding system for web corpora with explicit hierarchical struc-
ture.
By contrast, in these experiments, unless Optimal re-ranking is used, hyperlink-
based recommendation schemes do not achieve significant effectiveness gains. Even
on the WT10gC collection, on which the re-ranking cutoffs were trained, the recom-
mendation results were poor. For corpora of up to twenty million pages, the hyper-
link recommendation methods do not appear to provide benefits in document rank-
ing for a home page finding task. Similarly, little benefit has previously been found
for relevance-based retrieval in the TREC web track [121]. An alternative measure for
bias towards pages that are heavily linked-to, by re-weighting the anchor-text ranking
formula to favour large volumes of anchor-text, is investigated in Chapter 8.
An ideal home page finding system would exploit both anchor-text (for superior
performance when targeting popular sites) and document full-text information (to
ensure that home pages with inadequate anchor-text are not missed). While the pre-
liminary content+anchor-text baseline presented here goes some way to investigat-
ing combined performance, further work is needed to better understand whether this
combination is optimal. Further examination is required to determine how to provide
the best all-round search effectiveness when home page queries are interspersed with
other query types. Additional work is also required to determine whether evidence
useful in home page finding is useful for other web retrieval tasks (such as Topic
Distillation). These issues are investigated in Chapter 9, through the description and
evaluation of a first-cut general-purpose document ranking function that incorporates
web evidence.](https://image.slidesharecdn.com/e71a8712-b24d-4089-ba76-c51104d8fb0e-150913153105-lva1-app6892/85/Upstill_Thesis_Revised_17Aug05-150-320.jpg)
![Chapter 8
Anchor-text in web search
Full-text ranking algorithms have been used to score aggregate anchor-text evidence
with some success, both in experiments within this thesis (see Chapters 6 and 7), and
in experiments reported elsewhere [56]. When comparing the textual contents of doc-
ument full-text and aggregate anchor-text it is clear that, in many cases, they differ
markedly. For example, aggregate anchor-text sometimes contains extremely high
rates of term repetition. Excessive term repetition may make a negligible (or even neg-
ative1) contribution to full-text evidence, but may be a useful indicator in anchor-text
evidence. This is because each term occurrence could indicate an independent “vote”
from an external author that the document is a worthwhile target for that term.
This chapter examines whether the Okapi BM25 and Field-weighted Okapi BM25
ranking algorithms, previously used with success in scoring both document full-text
and aggregate anchor-text [56, 173], can be revised to better match anchor-text evi-
dence. The investigation is split into three sections. The first section presents an inves-
tigation of how the Okapi BM25 full-text ranking algorithm is applied when scoring
aggregate anchor-text. This includes an analysis of how the document and collection
statistics used in BM25 (and commonly used in other full-text ranking algorithms)
might be modified to better score aggregate anchor-text evidence. The second section
examines four different methods for combining the aggregate anchor-text evidence
with other document evidence. The third and final section provides an empirical in-
vestigation of the effectiveness of the revised scoring methods, for both combined
anchor-text and full-text evidence, and anchor-text alone.
8.1 Document statistics in anchor-text
This section examines how document statistics used in the Okapi BM25 ranking func-
tion, and other full-text ranking methods (see Section 2.3.2), apply to aggregate anchor-
text evidence.
1
As it could indicate a spam document, which was designed explicitly to be retrieved by the search
system in response to that query term.
135](https://image.slidesharecdn.com/e71a8712-b24d-4089-ba76-c51104d8fb0e-150913153105-lva1-app6892/85/Upstill_Thesis_Revised_17Aug05-151-320.jpg)
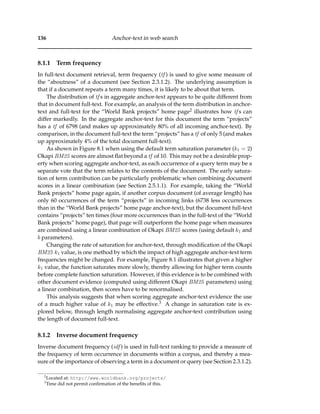
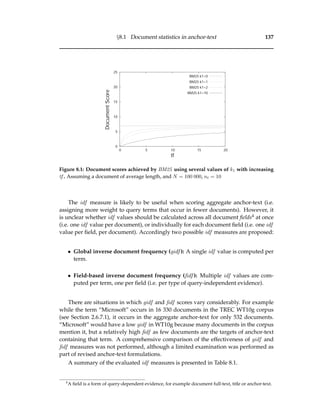
![138 Anchor-text in web search
Abbreviation Description Described in
BM25 Default Okapi BM25 Section 2.3.1.3
(calculates field-based idf values)
BM25gidf Okapi BM25 with global idf statistics, such Section 8.1.2
that idf is calculated only once using
all document fields
BM25FW Default Field-weighted Okapi BM25 Section 2.5.2.1
(a single global idf value is calculated
across all document fields)
BM25FWfidf Field-weighted Okapi BM25 with field-based Section 8.1.2
idf values
Table 8.1: Summary of idf variants used in ranking functions under examination.
8.1.3 Document length normalisation
Document length normalisation is used in full-text ranking algorithms to reduce bias
towards long documents. This bias occurs because the longer a piece of text, the
greater the likelihood that a particular query term will occur in it (see Section 2.3.1.3).
In Okapi BM25 the length normalisation function is controlled by b, with b = 1 en-
forcing strict length normalisation, and b = 0 removing length normalisation. Using
Okapi BM25 with the default length normalisation parameter (b = 0.75) [56, 186],
slightly longer documents are favoured. This was shown to be effective when scoring
document full-text in TREC ad-hoc tasks, as slightly longer (full-text) documents were
found to be more likely to be judged relevant [186] (described in Section 2.3.1.3).
The length of aggregate anchor-text is usually dependent on the number of in-
coming links. Therefore, applying length normalisation to aggregate anchor-text, and
thereby reducing the contribution of terms that occur in long aggregate anchor-text, is
in direct contrast to the use of hyperlink recommendation algorithms.
Aggregate anchor-text length is also much more variable than document full-text
length, with many documents having little or no anchor-text, and some having a very
large amount of incoming anchor-text (attributable to the power law distribution of
links amongst pages, see Section 2.4). In the TREC .GOV corpus (see Section 2.6.7.1)
the average full-text document length is around 870 terms.5 By comparison, the aver-
age aggregate anchor-text length is only 25 words.
An example of the negative effects of aggregate anchor-text length normalisation
can be studied for the query “USGS” on the .GOV corpus. Figure 8.2 contains the
aggregate anchor-text distribution for the home page of the United States Geolog-
5
Not including binary documents.](https://image.slidesharecdn.com/e71a8712-b24d-4089-ba76-c51104d8fb0e-150913153105-lva1-app6892/85/Upstill_Thesis_Revised_17Aug05-154-320.jpg)
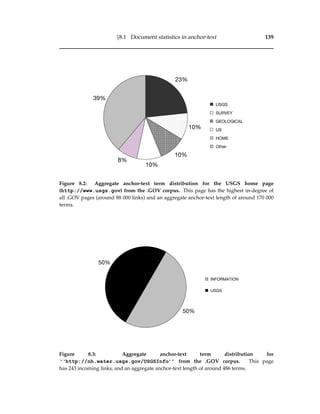
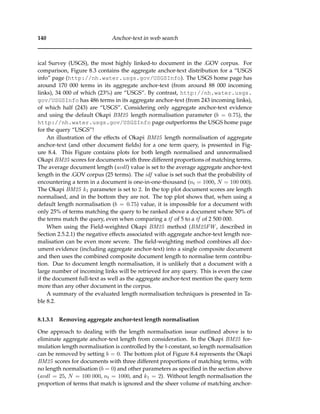
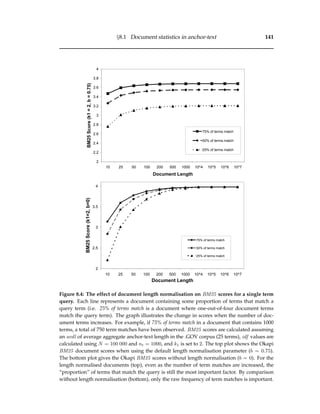
![142 Anchor-text in web search
Abbreviation Description Described in
BM25 Default Okapi BM25 formulation Section 2.3.1.3
(length normalisation using the field length)
BM25nodln Okapi BM25 using no length normalisation. Section 8.1.3.1
BM25contdln Okapi BM25 using full-text length Section 8.1.3.2
to normalise score
BM25FW Default Field-weighted Okapi BM25 Section 2.5.2.1 &
(length normalised using the composite
document length, which is the
sum of all field lengths). Section 8.2.2
BM25FWnoanchdln Field-weighted Okapi BM25 length Section 8.1.3.1
normalised using lengths of every
field except for anchor-text
Table 8.2: Summary of document length normalisation variants in ranking functions under
examination.
text terms is considered. This favours documents that have a large number of incom-
ing links and that may therefore be expected to achieve high hyperlink recommenda-
tion scores. The revised formulation of Okapi BM25 (with k1 = 2) for a document D,
and a query Q, containing terms t is:
BM25nodln(D, Q) =
t∈Q
tf t,D ×
log(N−nt+0.5
nt+0.5 )
2 × tf t,D
(8.1)
In the BM25FW formulation, the aggregate anchor-text length may be omitted
when computing the composite document length. In these experiments the removal of
aggregate anchor-text length in the BM25FW formulation is referred to as
BM25FWnoanchdln.
8.1.3.2 Anchor-text length normalisation by other document fields
Rather than using the length of aggregate anchor-text to normalise anchor-text scores,
it might be more effective to normalise aggregate anchor-text using the length of an-
other document field. For example, the length of document full-text could be used to
normalise aggregate anchor-text term contribution. Document length is known to be
useful query-independent evidence for some tasks (see Section 2.3.1.2) [186].
In experiments within this chapter, the use of document full-text length when scor-
ing aggregate anchor-text in the Okapi BM25 formulation is referred to as BM25contdln.
This approach may be more efficient than using individual document lengths as only
the full-text document lengths needs to be recorded.](https://image.slidesharecdn.com/e71a8712-b24d-4089-ba76-c51104d8fb0e-150913153105-lva1-app6892/85/Upstill_Thesis_Revised_17Aug05-158-320.jpg)
![§8.2 Combining anchor-text with other document evidence 143
8.2 Combining anchor-text with other document evidence
Four methods for combining anchor-text baselines with other document evidence are
investigated:
• BM25LC : a linear combination of Okapi BM25 scores;
• BM25FW : a combination using Field-weighted Okapi BM25 (described in Sec-
tion 2.5.2.1);
• BM25HYLC : a linear combination of Okapi BM25 and Field-weighted Okapi
BM25 scores; and
• BM25FWSn, BM25FWSnI : a combination of the best scoring anchor-text snip-
pet (repeated according to in-degree in BM25FWSnI ) with other document evi-
dence using the Field-weighted Okapi BM25 method.
In all cases the 2002 Topic Distillation task (TD 2002) was used to train combination
and ranking function parameters. It was later observed (both in experiments in Chap-
ter 9, and for reasons outlined in Section 2.6.7.2) that due to the informational nature
of the TD 2002 task it may not have been the most appropriate training set for these
navigational tasks [53]. Further gains may be achieved by re-training parameters for
a navigational-based search task (as used in Section 9.1.5).
8.2.1 Linear combination
In experiments within this chapter a linear combination of Okapi BM25 scores for
full-text and aggregate anchor-text is explored. Document title is not considered sep-
arately, and is scored as part of the document full-text baseline. A document score D
for a query Q is then:
BM25LC(D, Q) = BM25(C + T, Q) + αBM25(A, Q) (8.2)
where C + T is the full-text and title of document D, A is the aggregate anchor-text
for document D, and α is tuned according to the expected contribution of anchor-text
evidence.
Conceptually the linear combination assigns separate scores to document full-text
and aggregate anchor-text, considering them as independent descriptions of docu-
ment content. The BM25 linear combination constant was trained on the TD 2002
task, leading to α = 3.
8.2.2 Field-weighted Okapi BM25
The BM25FW formulation (see Section 2.5.2.1) includes three document fields: doc-
ument full-text (content), aggregate anchor-text, and title. The weights for each of
these fields were derived by Robertson et al. [173] for the TD 2002 task (content:1,
anchor-text:20, title:50, k1 = 3.4, b = 0.85). In this chapter, the document fields scored](https://image.slidesharecdn.com/e71a8712-b24d-4089-ba76-c51104d8fb0e-150913153105-lva1-app6892/85/Upstill_Thesis_Revised_17Aug05-159-320.jpg)
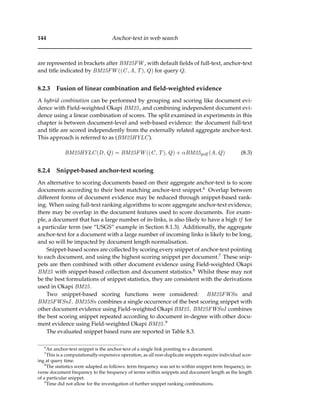
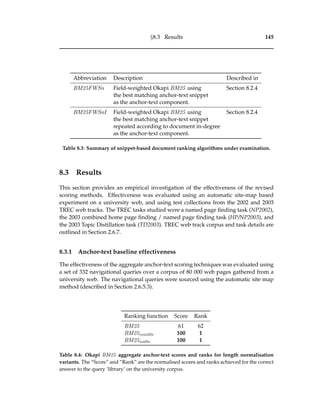
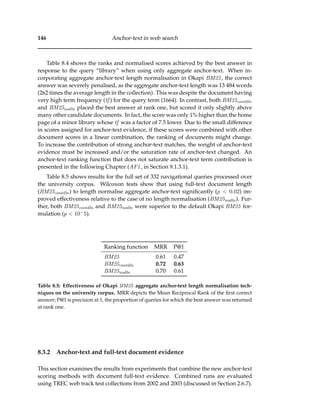
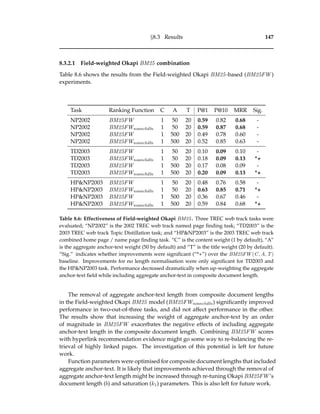
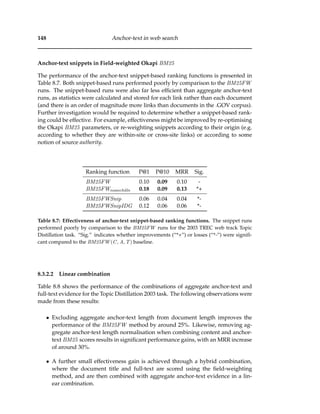

![152 A first-cut document ranking function using web evidence
different from previous informational tasks studied in TREC. Topic Distillation stud-
ies the retrieval of relevant resources, rather than relevant documents. The TD2003
submission studied in this chapter sought to determine whether the first-cut ranking
function trained for navigational search (especially home page finding queries) would
perform well for Topic Distillation. This training set was chosen in an effort to favour
the retrieval of relevant resources rather than documents.
The goal of the HP/NP2003 task was to study how well systems could retrieve
both home page documents and other documents specified by their name, without
prior knowledge of which queries were for named pages, and which were for home
pages. The HP/NP2003 submission studied in this chapter examined different meth-
ods for combining home page and named page based tunings into a single run. This
included an investigation of whether best performance was achieved by tuning for
both tasks at once, using a training set containing both types of queries, or through
“post hoc” fusion of home page and named page tuned document rankings.
A series of follow-up experiments used corpora gathered from several small cor-
porate webs to provide a preliminary study of how the ranking function performed
on diverse corporate-sized webs. In each case the effectiveness of the ranking function
studied was compared to that of the incumbent search system.
9.1.2 Document evidence
The ranking function included three important forms of document evidence: full-text,
title and URL length.
The query-dependent evidence (full-text and title) was scored using Okapi BM25
with tuned k1 and b parameters. The k1 and b parameters were tuned once per run
rather than individually per field. The application of term stemming was also eval-
uated (using the Porter stemmer [163], described in Section 2.3). Strict term coordi-
nation was applied for all query-dependent evidence, with documents containing the
most query terms ranked first. If combining Okapi BM25 scores computed for a mul-
tiple term query in a linear combination without term co-ordination, a document that
matches a single query term in multiple document fields can outperform a document
that contains all query terms in a single field. The use of strict term co-ordination
ensures that the first ranked document contains the maximum number of matched
query terms in a document field.
9.1.2.1 Full-text evidence
Okapi BM25 was used to score document full-text evidence (BM25(C)). Prior to
scoring full-text evidence all HTML tags and comments were removed. For efficiency
reasons global document length and global inverse document frequency (gidf ) values
were used (described in Section 8.1.2).](https://image.slidesharecdn.com/e71a8712-b24d-4089-ba76-c51104d8fb0e-150913153105-lva1-app6892/85/Upstill_Thesis_Revised_17Aug05-168-320.jpg)
![§9.1 Method 153
9.1.2.2 Title evidence
Title text was scored independently of other document evidence using BM25
(BM25(T)). For efficiency reasons the BM25 title formulation used global docu-
ment length and global inverse document frequency (gidf ) values (described in Sec-
tion 8.1.2).
9.1.2.3 URL length
URL lengths (URLlen) were capped at 127 for efficiency reasons. URLs longer than 127
characters recorded as being 127 characters long.
9.1.3 Web evidence
Anchor-text and two forms of in-degree were included in the ranking function. Page-
Rank and (simple) in-degree were not considered because of the relatively poor per-
formance observed in previous experiments. Instead, two important sub-types of in-
degree were examined: off-site and on-site in-degree [55].
9.1.3.1 Anchor-text
The Anchor Formula 1 (AF1) proposed here is an alternative to the revised anchor-
text models presented in the previous chapter. In AF1, term frequency (tf ) values are
not saturated (as described in Section 8.1.1) and document length normalisation is re-
moved (as described in Section 8.1.3). Multiplying AF1 values by 1.7 (using the KWT
parameter, see Section 9.1.4) the curve is similar to the BM25 saturation of an average
length document for the first three term occurrences (with default Okapi parameters,
see Figure 9.1).
The score for a document D, for query Q, over terms t, with aggregate anchor-
text A according to AF1 is:
AF1(D, Q) =
t∈Q
log(tf t,D + 1) × gidft (9.1)
As term frequency scores in the AF1 never saturate, term coordination must be en-
forced. Without term coordination a single term in a query may dominate. For exam-
ple if seeking “Microsoft Research Cambridge” the term “Microsoft” may dominate,
potentially leading to a page which matched “Microsoft” strongly in the aggregate
anchor-text, but never matched “Research” or “Cambridge” being retrieved, such as
the Microsoft home page.
9.1.3.2 In-degree
The log values of on-site (IDGon) and off-site (IDGoff) in-degrees were normalised
(according to the highest in-degree value for the collection) and quantised to 127 val-
ues (for efficiency reasons). This may have reduced ranking effectiveness, although](https://image.slidesharecdn.com/e71a8712-b24d-4089-ba76-c51104d8fb0e-150913153105-lva1-app6892/85/Upstill_Thesis_Revised_17Aug05-169-320.jpg)
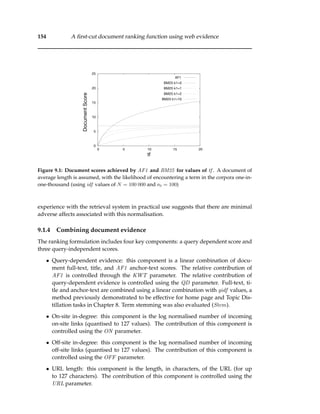
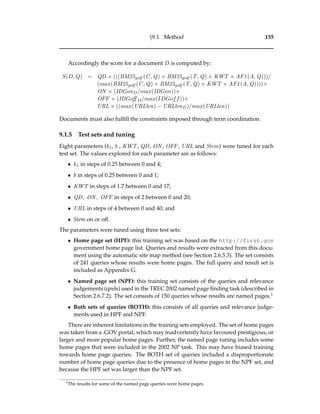
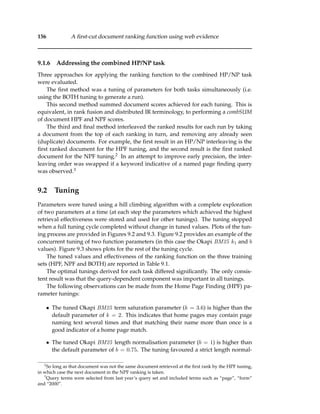
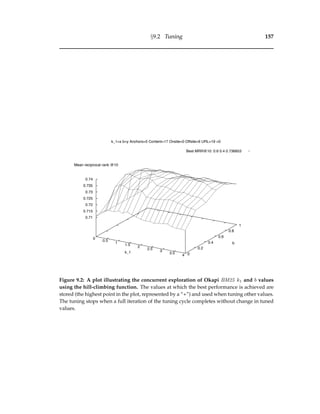
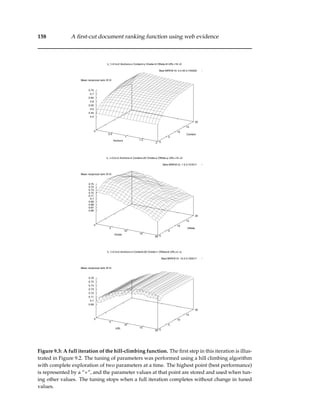
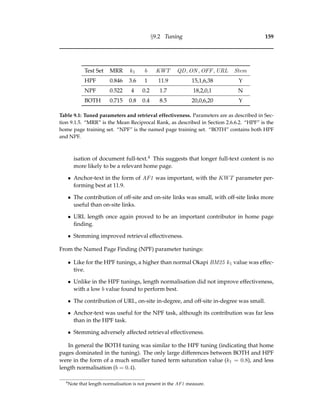
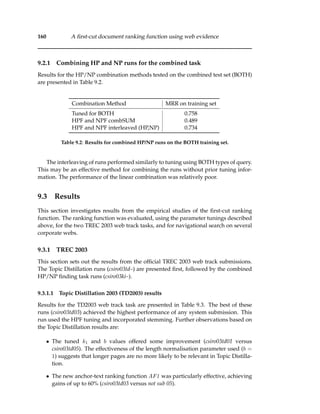
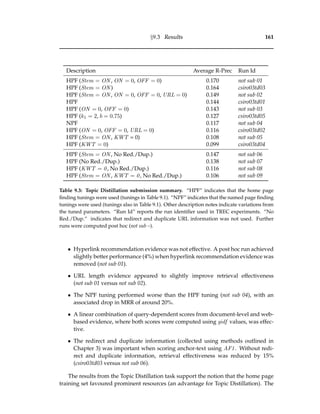
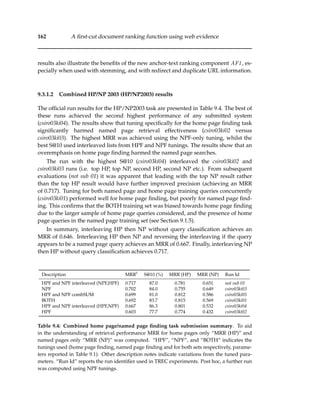
![§9.4 Discussion 163
9.3.2 Evaluating the ranking function on further corporate web collections
The ranking function was evaluated for eight further collections built from the pub-
licly available corporate webs of eight large Australian organisations: five public com-
panies, two government departments and an educational institution.
The query and result sets were generated using the automated site map method
described in Section 2.6.5.3. In each case the new ranking function was compared to
the performance of the incumbent search system. The anchor-text component was
calculated using a BM25 anchor-text formulation that used full-text document length
for normalisation (BM25contdln).
Table 9.5 presents the results from this experiment. The first-cut ranking function
performed significantly better than seven out of eight evaluated search systems, and
comparably to the other search system (University). The use of query-independent
evidence (off-site links, on-site links and URL length) did not significantly improve
retrieval effectiveness on any collection.
9.4 Discussion
The first-cut ranking function performed well over a variety of tasks and corpora. The
runs submitted to the 2003 TREC web track achieved the highest Topic Distillation
score [60], and the second highest combined HP/NP score [60]. The ranking function
also outperformed the incumbent search engines of seven-of-the-eight corporate webs
studied (and performed comparably to the other).
The tuning of ranking function parameters using the NPF training set achieved
better retrieval effectiveness than tuning using the HPF set in the HP/NP2003 task.
This indicates that the HPF-tuned ranking function may have been over-trained to-
wards prominent home pages (as would be listed on first.gov).
Arguably, the most important component of the ranking function was the anchor-
text evidence in the form of AF1. This finding re-iterates the importance of anchor-
text evidence in web document retrieval. The AF1 ranking function provided an ef-
fective alternative to scoring anchor-text using full-text ranking methods. However,
the methods used to score aggregate anchor-text evidence merit further investigation.
In particular, more work is required to determine whether the use of global inverse
document frequency values (gidf ) is preferable to the use of field-based anchor-text
(fidf) values.
The results show little performance gain through the use of query-independent
evidence, for both the web track tasks and small corporate web collections. URL
length evidence produced small gains for the home page finding and Topic Distilla-
tion tasks. By contrast hyperlink recommendation evidence never improved retrieval
effectiveness. The poor performance of query-independent evidence could indicate
that the method used to combine it with query-dependent evidence was ineffective.
More effective combination strategies might incorporate query-independent evidence
as some prior probability of document relevance [155], re-rank baselines (as in Sec-
tion 6.1.4), or may use the query-independent score to normalise or transform term](https://image.slidesharecdn.com/e71a8712-b24d-4089-ba76-c51104d8fb0e-150913153105-lva1-app6892/85/Upstill_Thesis_Revised_17Aug05-179-320.jpg)

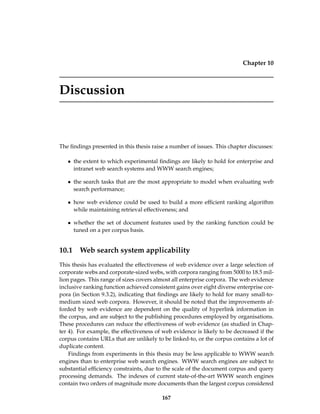
![168 Discussion
in this thesis. These systems also process thousands of concurrent queries with sub-
second response time. These efficiency requirements are likely to limit the document
features examined and scored during query processing. One benefit of a larger corpus
size is that there is likely to be more link evidence, and so differentiation between links
(e.g. on-site, off-site or nepotistic) might lead to larger gains. However, the hyperlink
recommendation scores calculated throughout experiments in this thesis were found
to be correlated with the scores for corresponding documents extracted from WWW
search engines (see Section 7.6.3). Further, a recent experiment reported that the use
of anchor-text evidence external to a web corpus (but linking to documents inside
the corpus) did not improve retrieval effectiveness [114]. Consequently, it is possible
that further link evidence may not be useful. The correlations between hyperlink
recommendation scores, and the small observed benefit achieved by using external
link evidence, indicate that hyperlink evidence used in WWW search systems is likely
to be comparable to that studied here.
WWW search engines also operate in an adversarial information retrieval envi-
ronment, where web authors may seek to bias ranking functions in their favour by
creating spam content [122]. Given the relative ease and low cost of link construction
on the WWW, one might expect hyperlink recommendation scores to be susceptible to
link spamming. Some spam-like properties were observed in thesis experiments, but
these appeared unsystematic and were deemed to have been created unintentionally.
While some experiments in this thesis cast doubts on the use of hyperlink recommen-
dation methods for spam reduction, these results are not conclusive.
Therefore, results presented in this thesis are likely to apply to ranking in enter-
prise web search, subject to publishing practices, but are less directly applicable to
ranking in WWW search systems.
10.2 Which tasks should be modelled and evaluated in web
search experiments?
It is important that the tasks evaluated and modelled for a web search system be repre-
sentative of the tasks that will be performed by the users of the system. Without access
to studies relating to the user populations, intended system usage and/or large scale
query-logs, it is difficult to determine which tasks are most frequently performed.
Document ranking functions need to be evaluated over more than one type of
search task. It is apparent, both in results from experiments presented in this thesis
and in previous TREC web track evaluations, that performance gains in a single re-
trieval task often do not carry benefits to other tasks. For example, URL length based
measures are particularly useful when seeking home pages (Chapter 7), but appear
to reduce retrieval effectiveness on other tasks (Chapter 9). Therefore a mixed query
set should be used when evaluating a general purpose ranking function. In the 2004
TREC web track, one of the tasks examined was a mixed task that included an equal
mix of named page, home page and Topic Distillation queries [54]. Alternatively a
mixed query set might be balanced in anticipation of the types of queries a system](https://image.slidesharecdn.com/e71a8712-b24d-4089-ba76-c51104d8fb0e-150913153105-lva1-app6892/85/Upstill_Thesis_Revised_17Aug05-184-320.jpg)
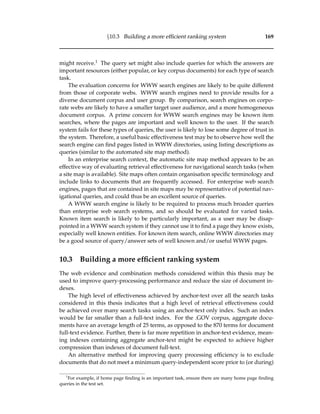


![181
R-Precision (R-Prec): a measure used to evaluate web search system performance.
R-Precision is the average of the precision of a system at the Rth document (av-
eraged across multiple queries).
Recall: a measure used in evaluating web search system performance. Recall is the
total proportion of all relevant documents that have been retrieved within a par-
ticular cut-off for a query.
Search Engine Optimisation: optimising document and web structure such that
search engines may better match a document’s content (without generating spam
content).
Spam: is the name applied to content generated by web publishers to artificially
boost the rank of their pages. Spam techniques include addition of otherwise
unneeded keywords and hyperlinks.
Stemming: stripping term suffixes or prefixes to collapse a term down to its canon-
ical form (or stem). The Porter suffix stemmer [163] is used for this purpose in
some thesis experiments.
Test collection: a snapshot of a user task and document corpus used to evaluate
system effectiveness. A test collection includes a set of documents (corpus), a set
of queries, and relevance judgements for documents in the corpus according to
the queries.
Topic Distillation: a user task in which the goal is to find entry points to relevant sites
given a broad query.
Text REtrieval Conference (TREC): an annual conference run by the US National
Institute of Science and Technologies (NIST) and the US Defense Advanced Re-
search Projects Agency (DARPA) since 1992. The goal of the conference is to
promote the understanding of information retrieval algorithms by allowing re-
search groups to compare system effectiveness on common test collections.
Traditional information retrieval: information retrieval performed over flat corpus
using full-text fields.
Transactional search task: a user search task where the user needs to perform some
activity on, or using, the WWW.
URL-type: a URL class breakdown, proposed by Westerveld et al. [212], in which
some URLs are deemed more important than others on the basis of structure
and depth (outlined in Section 2.3.3.2).
web: a corpus containing linked documents.
web evidence: evidence derived from some web property or context.](https://image.slidesharecdn.com/e71a8712-b24d-4089-ba76-c51104d8fb0e-150913153105-lva1-app6892/85/Upstill_Thesis_Revised_17Aug05-197-320.jpg)

![Appendix D
TREC participation in 2002
This appendix is included for reference only and is drawn directly from [57].
TREC2002 included a named page finding task and a Topic Distillation task. A
preliminary exploration of forms of evidence which might be useful for named page
finding and topic distillation was performed. For this reason there was heavy use of
evidence other than page content.
D.1 Topic Distillation
In Topic Distillation the following forms of evidence were used:
• BM25 on full-text (content). Pages returned should be “relevant”. The .GOV
was corpus indexed and applied BM25, sometimes with stemming sometimes
without.
• BM25 on content and referring anchor-text. An alternative to content-only BM25
is to include referring anchor-text words in the BM25 calculation (content and
anchors).
• In-link counting and filtering. To test whether pages with more in-links are po-
tentially better answers, with differentiation between on-host and off-host links.
Many results were eliminated on the grounds that they had insufficient in-links.
• URL length. Short URLs are expected to be better answers than long URLs.
• BM25 score aggregation. Sites with many BM25-matching pages are expected
to be better than those with few.
In the 2002 Topic Distillation (TD2002) task, the focus on local page content rele-
vance (BM25 content only) was probably too high for the non-content and aggrega-
tion methods to succeed. Most correct answers were expected to be shallow URLs of
sites containing much useful content. In fact, correct answers were deeper, and the ag-
gregation method for finding sites rich with relevant information was quite harmful
(csiro02td3 and csiro02td4). The focus on page content is borne out by the improve-
ment in effectiveness achieved when simple BM25 was applied in an unofficial run
195](https://image.slidesharecdn.com/e71a8712-b24d-4089-ba76-c51104d8fb0e-150913153105-lva1-app6892/85/Upstill_Thesis_Revised_17Aug05-211-320.jpg)
![196 TREC participation in 2002
BM25 BM25 In-link URL BM25
Run P@10 cont. cont. & anch. counting & filtering length aggr.
csiro02td1 0.1000 y y y
csiro02td2 0.0714 y y
csiro02td3 0.0184 y y y y
csiro02td4 0.0184 y y y
csiro02td5 0.0939 y (stem) y y
csiro02unoff 0.1959 y
Table D.1: Official results for submissions to the 2002 TREC web track Topic Distillation
task
(csiro02unoff). To perform better in the TD2002 task, less (or no) emphasis should have
been put on distillation evidence and far more emphasis on relevance. However, in
some Web search situations, it is likely that the distillation evidence would be more
important than it was in this TD2002 task.
D.2 Named page finding
In the named page finding experiments the following forms of evidence was used:
• Okapi BM25 on document full-text (content) and/or anchor text. Okapi BM25
was used to score document content and to aggregate anchor-text documents.
• Stemming of query terms.
• Extra Title Weighting. To bias the results towards “page naming text” further
emphasis was placed on document titles.
• PageRank. To see whether link recommendation could be used to improve re-
sults [31].
Prior to submission twenty named page training queries were generated. This
training found that content with extra title weighting performed best. Therefore page
titles were expected to be important evidence in the official named page finding task.
However this appeared not to be the case, in fact extra title weighting for the TREC
queries appeared to reduce effectiveness (csiro02np01 vs csiro02np03). While there
was some anchor text evidence present for the query set (csiro02np02), when this ev-
idence was combined with content (csiro02np04 and csiro02np16) results were notice-
ably worse than for the content-only run (csiro02np01). PageRank harmed retrieval
effectiveness (run csiro02np16 versus csiro02np04).](https://image.slidesharecdn.com/e71a8712-b24d-4089-ba76-c51104d8fb0e-150913153105-lva1-app6892/85/Upstill_Thesis_Revised_17Aug05-212-320.jpg)