
Recommended
Recommended
More Related Content
Similar to Architecture
Similar to Architecture (20)
Recently uploaded
Recently uploaded (20)
Architecture
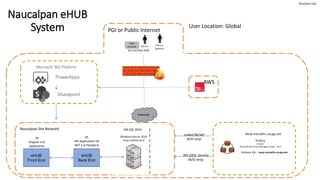
- 1. Business Use AWS PGI or Public Internet (HTTPS) Port 443 User Location: Global Naucalpan Site Network Internet eHUB Front End Naucalpan eHUB System MS SQL 2016 (admin) eHUB Back End IIS Angular v12 Application IIS API Application C# .NET 5.0 Plataform Database SQL : naup-mesrpthc.na.pg.com Proficy Versión: Microsoft SQL Server Managent Studio – 18.4 Naup-mesrpthc.na.pg.com Linked Server (R/O only) API-iODS Service (R/O only) Sharepoint Microsoft 365 Platform PowerApps
- 2. Business Use eHUB Application P&G eHUB Administrator P&G eHUB User Web browser Web browser Captura Variables Manuales Remote Client / Pulse Secure Remote Client / Pulse Secure LDAP LDAP Access Report of Variables Total Plant/ View Report of Variables Total Plant Captura y Reportes de Triggers de Seguridad/Calidad Pizarrones PDCA (Configuracion y Visualizacion) Reporte Total Planta Capture / Visualization of variable daily values by Area/ Family / Line /Unit Capture/ Visualization of Action Plans values by Area/ Family / Line /Unit Role based application Authentication through Active Directory Access Report of Variables Total Plant / View Report of Variables Total Plant Capture / Visualization of Trigger daily values by Area/ Family / Line /Unit Capture/ Visualization of Action Plans values by Area/ Family / Line /Unit Reporte ODM Reporte Graficas PR/ PDT/UPDT/Paros/ ChangeOvers Configuración eRTT Captura y Reportes Healtcheck Captura Y Reportes Ya Meritos Captura y Reporte Planes de Accion Access Report of ODM Variables/ View Report of ODM Variables Access Report of ODM Variables/ View Report of ODM Variables Capture / Visualization of variable daily values by Area/ Family / Line /Unit Capture / Visualization of Trigger daily values by Area/ Family / Line /Unit Access /View Graphic Report values of PR/UPDT/PDT/Stops/ChangeOvers Variables Access /View Graphic Report values of PR/UPDT/PDT/Stops/ChangeOvers Variables Capture/ Visualization of eRTT Configuration (PGTSs , Members, etc.) Capture/ Visualization of eRTT Configuration (PGTSs , Members, etc.) Capture/ Configuration/ Visualization of PDCA Dashboards Capture/ Configuration/ Visualization of PDCA Dashboards Capture/ Visualization of Healthcheck values by DMS and by Area/ Family / Line /Unit Capture/ Visualization of Healthcheck values by DMS and by Area/ Family / Line /Unit NAUP- WEBSERVER2 IIS Capture/ Visualization of “Ya Meritos” values by Area/ Family / Line /Unit Capture/ Visualization of “Ya Meritos” values by Area/ Family / Line /Unit
Editor's Notes
- Naming convention on vendor cloud
- Toggle back and forth between the next slide to show generic object types and what it looks like in a completed diagram. When creating diagrams, prioritize readability (does it help your audience understand the solution). inputs on left/top – outputs on right/bottom add sequence numbers to the different flows Platform: Show the platform behind the application A sequence diagram could be used to communicate order of interaction. Sequence diagrams are not included in the iRisk process. At the conclusion of discussing these slides, flash back to the checklist to assess the quality of the diagram. Use the RTIS acronym to emphasize readability. If I search for the application in EASE, would I find it? Single signon, authentication tool