Download as PDF, PPTX


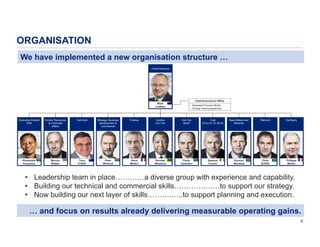


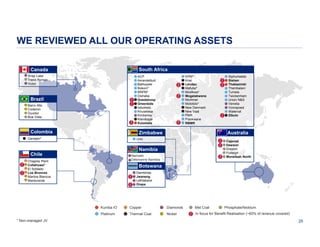
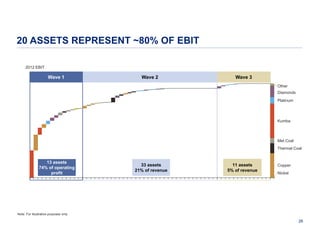
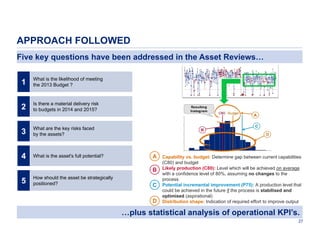
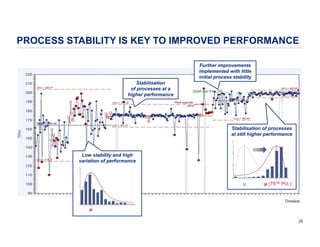


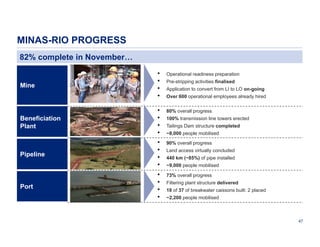
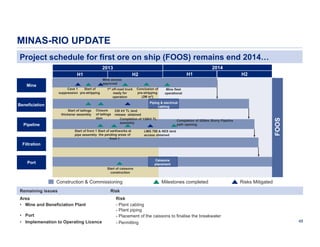
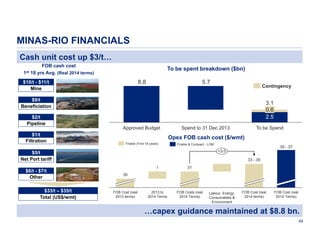


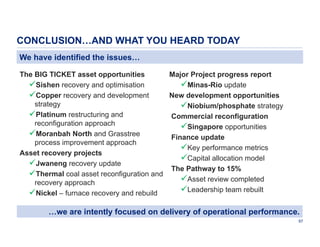
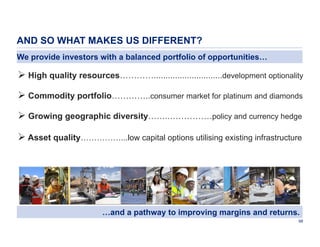

The presentation by Anglo American plc provides an overview of the company's asset portfolio, highlighting strategic priorities, operational improvements, and financial objectives aimed at enhancing returns and cash flow. It contains forward-looking statements regarding the company's financial performance, market risks, and operational strategies, emphasizing the importance of capital allocation, asset recovery projects, and a diversified commodity portfolio. The document also discusses the leadership team's focus on optimizing operations and increasing production efficiency across various assets.


![[DSC Europe 23] Tamara Stankovic - From Prompt To Product Microsoft 365 Copil...](https://cdn.slidesharecdn.com/ss_thumbnails/dsceurope23tamarastankovic-fromprompttoproductmicrosoft365copilot-231128230444-9b77578f-thumbnail.jpg?width=640&height=640&fit=bounds)


