The document contains information about the real estate market in Rockwall, Texas from April 2009 to April 2010. It shows that the median price of for-sale properties decreased 2% from $219,450 to $214,900 while the median price of sold properties decreased 3% from $195,000 to $188,588 over this period. The number of for-sale properties increased 2% from 496 to 507 units while the number of properties sold remained the same at 37 units. Additionally, the average months supply of inventory decreased 3% from 7.1 to 6.9 months.
The median price of for sale properties in March 2010 was unchanged from March 2009 at $214,900. However, the median price of sold properties decreased 3% from $185,609 in March 2009 to $180,000 in March 2010. Additionally, the number of for sale properties decreased 4% from 501 in March 2009 to 483 in March 2010, while the number of sold properties remained unchanged at 49.
The document compares median home prices and housing inventory from April 2009 to April 2010 in Mckinney, Texas. It finds that the median price of homes for sale decreased 5% while the median price of homes sold increased 2%. The number of homes for sale decreased 8% and the number of homes sold decreased 6%. Additionally, the average months of inventory decreased 12%.
The document compares median home prices and housing inventory in April 2009 to April 2010 in Frisco, Texas. It finds that the median price of for-sale homes decreased 2% from $300,000 to $295,000 while the median price of sold homes decreased 7% from $241,500 to $225,000 over this period. The number of for-sale homes decreased 1% from 1,486 to 1,475 homes, while the number of homes sold decreased slightly from 202 to 201. The average months of inventory decreased 19% from 5.5 to 4.5 months.
The median price of for-sale properties in March 2010 decreased 4% from March 2009, while the median price of sold properties increased 1%. The number of for-sale properties increased 8% from March 2009 to March 2010, while the number of sold properties decreased 4%. Additionally, the average months of inventory increased 12% from March 2009 to March 2010.
The median price of for-sale properties in March 2010 was down 2% from March 2009, and the median price of sold properties was down 3%. The number of for-sale properties was down 3% from March 2009 to March 2010, while the number of sold properties was down 9%. The document provides data on housing prices and supply/demand in the city of Frisco from March 2009 to March 2010.
The document compares median home prices and housing inventory levels in April 2009 to April 2010 in Plano, Texas. It finds that the median price of homes for sale decreased 4% while the median price of homes sold decreased 5%. The number of homes for sale increased 11% and the number of homes sold increased 9%. Additionally, the average months of inventory increased 21%.
- The median price of for-sale properties increased 1% from May 2009 to May 2010, while the median price of sold properties decreased 9% over the same period.
- The number of for-sale properties decreased 5% from May 2009 to May 2010, while the number of sold properties increased 45% over the same period.
- The average months supply of inventory, a measure of how long it will take to sell current for-sale inventory, increased 140% from May 2009 to May 2010.
The document summarizes real estate data for Allen, Texas from April 2009 to April 2010. It shows that the median price of for-sale properties decreased 4% from April 2009 to April 2010, while the median price of sold properties increased 3% in that time period. The number of for-sale properties decreased 1% from 677 to 672 units, while the number of sold properties increased 5% from 114 to 120 units. Additionally, the average months supply of inventory, a measure of housing demand and supply, increased 9% from 3.4 to 3.8 months over the one-year period.
The document compares housing market data from April 2009 to April 2010 in Corinth, Texas. It states that the median price of for-sale properties increased 1% while the median price of sold properties rose 16%. The number of for-sale properties decreased 8% and the number of properties sold decreased 7%. Additionally, the average months supply of inventory, a measure of housing demand and supply balance, increased 27% from April 2009 to April 2010.
The document summarizes real estate data for Rowlett, Texas from April 2009 to April 2010. It states that the median price of for-sale properties increased 3% from $159,945 to $164,950 while the median price of sold properties rose 8% from $129,900 to $140,000 over this period. The number of for-sale properties decreased slightly by 2 units but the number of properties sold declined by 2%. The average months of inventory increased 10% from 3.7 to 4.1 months.
The document compares housing market data from May 2009 to May 2010 in Rockwall, Texas. It finds that the median price of for-sale properties increased 2% while the median price of sold properties rose 6%. The number of for-sale properties decreased 2% whereas the number of sold properties was up 22%. Additionally, the average months of inventory increased 25% from May 2009 to May 2010.
The document compares real estate data from April 2009 to April 2010 in Carrollton, Texas. It finds that the median price of for-sale properties was unchanged, while the median price of sold properties increased 10%. The number of for-sale properties increased 13% and the number of sold properties rose 6%. Additionally, the average months of inventory decreased 11%.
The median price of for sale properties increased 1% from May 2009 to May 2010, while the median price of sold properties increased 7% over the same period. The number of for sale properties decreased 1% from 328 to 326 properties, while the number of sold properties decreased 27% from 48 to 35 properties sold. Additionally, the average months supply of inventory, a measure of housing demand and supply balance, increased 77% from 4.8 months in May 2009 to 8.4 months in May 2010.
The document compares housing market data from April 2009 to April 2010 in Forney, Texas. It states that the median price of for-sale properties decreased 3% while the median price of sold properties increased 14%. Additionally, the number of for-sale properties increased 12% while the number of properties sold decreased 8%. Finally, the average months supply of inventory decreased 4% over this time period.
The median price of for-sale properties in May 2010 was up 1% from May 2009, while the median price of sold properties was down 8%. The number of for-sale properties decreased 7% from May 2009 to May 2010, while the number of sold properties increased 9%. Additionally, the average months supply of inventory increased 52% from May 2009 to May 2010.
The document compares housing market data from June 2009 to June 2010 in Heath, Texas. It finds that the median price of for-sale properties decreased 2% while the median price of sold properties increased 14%. The number of for-sale properties rose 3% and the number of sold properties increased 73%. Additionally, the average months of inventory increased 49%.
The document compares median home prices and housing inventory statistics from April 2009 to April 2010 in Heath, Texas. It shows that the median price of homes for sale decreased by 13% while the median price of homes sold decreased by 17% in that period. The number of homes for sale decreased by 2% while the number of homes sold decreased by 27%. Additionally, the average months of inventory decreased by 4%.
The document compares housing data from April 2009 to April 2010 in The Colony. It shows that the median price of for-sale properties decreased 2% while the median price of sold properties increased 10%. The number of for-sale properties increased 6% while the number of properties sold decreased 25%. Additionally, the average months supply of inventory, a measure of housing demand and supply balance, increased 43% from April 2009 to April 2010.
The document compares housing market data from May 2009 to May 2010 in Addison, Texas. It shows that the median price of for-sale properties increased 2% while the median price of sold properties decreased 3%. The number of for-sale properties increased 16% while the number of sold properties remained the same. Additionally, the average months of inventory increased 21%.
The median price of for-sale properties in May 2010 was down 5% from May 2009, and the median price of sold properties was down 3%. The number of for-sale properties was down 2% from May 2009 to May 2010, while the number of sold properties was down 6%. Additionally, the average months supply of inventory was up 7% from May 2009 to May 2010.
The median price of for-sale properties in March 2010 was down 5% from March 2009, while the median price of sold properties was up 11%. The number of for-sale properties decreased by 8% from March 2009 to March 2010, and the number of sold properties decreased by 6% over the same period.
The median price of for-sale properties in March 2010 was down 8% from March 2009, while the median price of sold properties was up 3%. The number of for-sale properties was down 6% from March 2009 to March 2010, and the number of sold properties was down 1%. The document provides data on median prices and number of units for both for-sale and sold residential properties in Allen, Texas from March 2009 to March 2010.
The document compares real estate data from March 2009 to March 2010 in Carrollton. It shows that:
- The median price of for-sale properties increased 6% while the median price of sold properties rose 3%.
- The number of for-sale properties grew 17% while the number of sold properties declined slightly by 2%.
- The average months of inventory decreased 15% from 4.1 months in March 2009 to 3.5 months in March 2010.
The document compares housing market data from June 2009 to June 2010 in Corinth, Texas. It states that the median price of for-sale properties decreased 3% while the median price of sold properties increased 5%. The number of for-sale properties decreased 2% and the number of sold properties decreased 21%. Additionally, the average months of inventory increased 91% from 4.3 to 8.2 months.
The document compares real estate data from April 2009 to April 2010 in Addison, Texas. It states that the median price of for-sale properties increased 3% while the median price of sold properties decreased 32%. Additionally, the number of for-sale properties rose 35% but the number of sold properties declined 57%. Finally, the average months supply of inventory, a measure of housing demand and supply balance, increased 69% from April 2009 to April 2010.
The document contains information from a real estate report comparing housing market statistics from May 2009 to May 2010 in Richardson, Texas. It states that the median price of for-sale properties decreased 2% from May 2009 to May 2010, while the median price of sold properties decreased 7% in that period. Additionally, the number of for-sale properties increased 17% from May 2009 to May 2010, while the number of sold properties decreased 7%. Finally, the average months supply of inventory, a measure of housing demand and supply, increased 144% from May 2009 to May 2010.
The document contains real estate data for Richardson, TX comparing April 2009 to April 2010. It shows that the median price of for-sale properties was unchanged, while the median price of sold properties increased 7%. The number of for-sale properties increased 30% from 388 to 505, while the number of properties sold increased 47% from 53 to 78. The average months supply of inventory, which measures how long it would take to sell all listed properties, increased 45% from 3.3 months to 4.9 months.
The median price of for sale properties increased 3% from June 2009 to June 2010, while the median price of sold properties rose 12%. The number of for sale properties decreased 1% while the number of sold properties remained the same. Additionally, the average months supply of inventory was up 52% from June 2009 to June 2010.
2010 Toyota Camry Hybrid - Carson Toyota Los Angeles, CACarson Toyota
2010 Toyota Camry Hybrid brochures provided by West Herr Suzuki located near Los Angeles, CA. Find the 2010 Toyota Camry Hybrid for sale in California; call about our current sales and incentives at (800) 90-TOYOTA.
The all new Carson Toyota dealership now exceeds 130,000 square feet on 10 acres. We offer a great selecction of new and pre-owned vehicles in stock, expanded state-of-the-art Service and Parts Departments, with more service bays and expanded capacity, and a new accessories boutique.Carson Toyota has been serving Southern California residents since 1974. Our commitment as been and always will be, to provide the best service possible to our valued customers.
Plano TX - Housing Market Report - August 2010Valarie Littles
The document compares housing market data from August 2009 to August 2010 in Plano, Texas. It finds that the median price of homes for sale decreased 7% over this period, while the median price of homes sold increased 7%. Additionally, the number of homes for sale increased 17% from August 2009 to August 2010, while the number of homes sold decreased 31% over the same period.
This document discusses commercial property in the UK. It notes that commercial property is a major part of the UK economy, provides space for industries and activities, and is larger than several other economic sectors. It owns that commercial property totals over £820 billion, with the largest components being offices, retail, and warehousing. The property is owned by a range of institutional investors, collective investment schemes, and property companies. The commercial property sector connects the economy by facilitating investment, construction, and business activity that has multiplier effects on communities. Higher quality properties can benefit businesses and owners through increased rents, lower vacancies, and better relations.
Only 1411 tigers remain in the wild. Poachers kill tigers and sell their parts for money, endangering the survival of the species. White tigers are especially at risk of extinction. The document calls on people to help save tigers, which are a wonderful creation and the national animal of India, by stopping poaching and the abuse and killing of tigers.
2011 Toyota Sienna - Carson Toyota Carson, CACarson Toyota
2011 Toyota Sienna brochures provided by Carson Toyota located near Los Angeles, CA. Find the 2011 Toyota Sienna for sale in California; call about our current sales and incentives at (800) 90-TOYOTA.
Equity workshop: Social equity matters in Payments for Ecosystem Services IIED
Social equity matters in Payments for Ecosystem Services.
A presentation by Unai Pascual, Basque Centre for Climate Change.
This presentation was given at the Expert Workshop on Equity, Justice and Well-being in Ecosystem Governance, held at the International Institute for Environment and Development (IIED) in London, March, 2015.
The document contains three real estate market reports from Ultima Real Estate for Valarie Littles comparing April 2009 to April 2010. It shows that the median price of for sale properties decreased 1% while the median price of sold properties decreased 2%. The number of for sale properties increased 1% and the number of sold properties increased 23%. Finally, the average months supply of inventory decreased 28%.
The document contains information from a real estate report comparing housing market data from June 2009 to June 2010 in Richardson, Texas. It shows that:
- The median price of for-sale properties decreased 2% while the median price of sold properties increased 10% between June 2009 and June 2010.
- The number of for-sale properties increased 27% while the number of sold properties decreased 25% between June 2009 and June 2010.
- The average months supply of inventory, a measure of how long it will take to sell current for-sale inventory, increased 253% from June 2009 to June 2010.
The document compares housing market data from April 2009 to April 2010 in Little Elm, Texas. It finds that the median price of for-sale properties decreased 1% while the median price of sold properties decreased 2%. The number of for-sale properties increased 1% and the number of sold properties increased 23%. Additionally, the average months of inventory decreased 28%.
The document compares housing market data from May 2009 to May 2010 in Allen, Texas. It finds that the median price of for-sale properties increased 1% while the median price of sold properties decreased 4%. The number of for-sale properties decreased 7% and the number of sold properties increased 37%. Additionally, the average months of inventory increased 64% from 3.7 to 6.1 months.
The document contains real estate data from June 2009 to June 2010 for Savannah, GA. It shows that during this period:
- The median price of for-sale properties decreased 3% while the median price of sold properties increased 2%.
- The number of for-sale properties increased 20% while the number of sold properties increased 50%.
- The average months of inventory increased 104%, from 5.5 months in June 2009 to 11.2 months in June 2010.
The document compares housing market data from May 2009 to May 2010 in Carrollton, Texas. It shows that the median price of for-sale properties was unchanged, while the median price of sold properties decreased by 4%. The number of for-sale properties decreased by 2% and the number of sold properties also decreased by 2%. Additionally, the average months of inventory increased by 84% from 4.1 months to 7.6 months.
- In March 2010, the median price of for-sale properties was down 1% from March 2009, while the median price of sold properties was down 2%.
- The number of for-sale properties was down 2% from March 2009 to March 2010, and the number of sold properties was also down 2%.
- The average months supply of inventory was down 28% from March 2009 to March 2010.
The document compares housing market data from June 2009 to June 2010 in Forney, Texas. It finds that the median price of for-sale properties decreased 1% while the median price of sold properties increased 10%. The number of for-sale properties increased 12% and the number of sold properties rose 2%. Additionally, the average months of inventory increased 38% from June 2009 to June 2010.
The document compares real estate data from March 2009 to March 2010 in Richardson, Texas. It finds that the median price of for-sale properties was unchanged while the median price of sold properties increased 8%. The number of for-sale properties rose 27% and the number of sold properties fell 24%. Additionally, the average months of inventory increased 11% from 4.0 to 4.4 months.
The document compares housing market data from April 2009 to April 2010 in Heartland. It shows that:
- The median price of for-sale properties increased 6% while the median price of sold properties rose 16%.
- The number of for-sale properties was up 26% whereas the number of properties sold declined 38%.
- The average months supply of inventory, a measure of how long it will take to sell all listed homes, increased 53% from 2.8 months to 4.2 months.
The document compares housing market data from June 2009 to June 2010 in Little Elm, Texas. It finds that the median price of for-sale properties was unchanged, while the median price of sold properties rose 14%. The number of for-sale properties increased 9% while the number of sold properties declined 34%. Additionally, the average months of inventory increased 33% from June 2009 to June 2010.
The document summarizes real estate data from May 2009 to May 2010 in Savannah, Georgia. It shows that during this period:
- The median price of for-sale properties decreased 5% (from $162,445 to $155,000) while the median price of sold properties decreased 8% (from $139,900 to $129,000).
- The number of for-sale properties increased 26% (from 54 to 68 properties) while the number of sold properties increased 71% (from 7 to 12 properties).
- The average months of inventory increased 418% (from 3.8 months to 19.7 months).
Similar to Rockwall TX - April 2010 - Market Report (12)
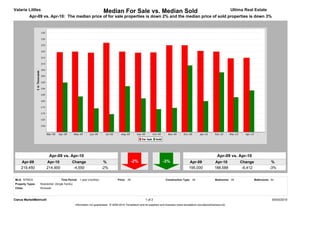
The document compares housing market data from March 2010 to March 2011 in The Colony, Texas. It finds that the median price of for-sale properties was unchanged, while the median price of sold properties declined 17%. The number of for-sale properties increased 12% from March 2010 to March 2011, while the number of properties sold declined 62% over the same period.
The document compares real estate data from March 2010 to March 2011 in Rockwall, Texas. It finds that the median price of for-sale properties decreased 4% while the median price of sold properties decreased 13%. Additionally, the number of for-sale properties decreased 5% and the number of sold properties decreased 41%. The average months of inventory increased 12% from March 2010 to March 2011.
The document compares real estate data from March 2010 to March 2011 in McKinney, Texas. It finds that the median price of for-sale properties decreased 5% while the median price of sold properties increased 4%. Additionally, the number of for-sale properties decreased 8% and the number of properties sold decreased 34%. Finally, the average months of inventory increased 19% from March 2010 to March 2011.
Plano TX - Feb/March 2011 - Housing Market ReportValarie Littles
The document compares housing market data from March 2010 to March 2011 in Plano, Texas. It finds that the median price of for-sale properties decreased 2% while the median price of sold properties increased 1%. Additionally, the number of for-sale properties decreased 6% and the number of properties sold decreased 15% from one year ago.
Little Elm - Feb/March 2011 - Housing Market ReportValarie Littles
The document compares real estate data from March 2010 to March 2011 in Little Elm, Texas. It finds that the median price of for-sale properties decreased 2% while the median price of sold properties decreased 13%. The number of for-sale properties increased 3% while the number of properties sold decreased 46%.
The document compares real estate data from March 2010 to March 2011 in Heath, Texas. It shows that the median price of for-sale properties increased 2% while the median price of sold properties decreased 11%. The number of for-sale properties increased 2% and the number of sold properties increased 33%. Additionally, the average months of inventory decreased 13% from March 2010 to March 2011.
The document contains two tables comparing housing market data from March 2010 to March 2011 in a certain region:
1) The median price of for-sale properties decreased 10% while the median price of sold properties increased 2%.
2) The number of for-sale properties increased 30% while the number of properties sold decreased 80%.
The document compares real estate market data from March 2010 to March 2011 in Frisco, Texas. It shows that the median price of for-sale properties was unchanged, while the median price of sold properties decreased slightly. The number of for-sale properties decreased 10% from March 2010 to March 2011, while the number of properties sold decreased more sharply at 40%.
The document summarizes real estate data from March 2010 to March 2011 in Forney, Texas. It shows that the median price of for-sale properties decreased 3% from March 2010 to March 2011, while the median price of sold properties decreased 12%. The number of for-sale properties increased 5% while the number of sold properties decreased 34%. Additionally, the average months of inventory increased 2% from March 2010 to March 2011.
The document compares real estate data from March 2010 to March 2011 in Carrollton, Texas. It finds that the median price of for-sale properties decreased 3% from $179,000 to $173,950, while the median price of sold properties decreased 1% from $164,750 to $163,500. The number of for-sale properties increased 12% from 563 to 630, while the number of properties sold decreased 44% from 98 to 55.
Allen TX - Feb/March 2011 - Housing Market ReportValarie Littles
The document contains real estate data for Allen, Texas from March 2010 to March 2011. It shows that:
1) The median price of homes for sale increased 2% from March 2010 to March 2011, while the median price of homes sold increased 6%.
2) The number of homes for sale decreased 7% from March 2010 to March 2011, while the number of homes sold decreased 35% over the same period.
3) Both the supply of homes for sale and demand as measured by homes sold declined from March 2010 to March 2011 in Allen, Texas according to the data presented.
The document compares real estate data from March 2010 to March 2011 in Rowlett, Texas. It finds that the median price of for-sale properties decreased 1% while the median price of sold properties increased 1%. The number of for-sale properties decreased slightly by 0% while the number of properties sold decreased more sharply by 38%. Finally, the average months of inventory increased by 32% from 3.9 to 5.1 months.
Allen TX - January 2011 - Housing Market ReportValarie Littles
The document compares housing market data from January 2010 to January 2011 in Allen, Texas. It finds that:
- The median price of homes for sale decreased 5% while the median price of homes sold increased 6% between January 2010 and January 2011.
- The number of homes for sale increased 7% while the number of homes sold increased 5% between January 2010 and January 2011.
Plano TX - January 2011 - Housing Market ReportValarie Littles
The median price of for-sale properties in January 2011 was down 7% from January 2010, while the median price of sold properties was up 6%. The number of for-sale properties increased 11% from January 2010 to January 2011, and the number of sold properties was up 17%. Additionally, the average months supply of inventory was up 27% in January 2011 compared to January 2010.
Forney TX - January 2011 - Housing Market ReportValarie Littles
The document summarizes real estate data from January 2010 to January 2011 for Forney, Texas. It shows that the median price of for-sale properties decreased 11% from January 2010 to January 2011, while the median price of sold properties decreased 18%. Additionally, the number of for-sale properties increased 15% from January 2010 to January 2011, while the number of sold properties decreased 21% over the same period.
Rowlett TX - January 2011 - Housing Market ReportValarie Littles
The document compares real estate data from January 2010 to January 2011 in Rowlett, Texas. It finds that the median price of for-sale properties decreased 6% while the median price of sold properties increased 14%. Additionally, the number of for-sale properties increased 17% while the number of properties sold decreased 8%.
Rockwall TX - January 2011 - Housing Market ReportValarie Littles
The document compares housing market data from January 2010 to January 2011 in Rockwall, Texas. It finds that the median price of homes for sale decreased 9% from $219,500 to $200,000 over this period, while the median price of homes sold decreased 6% from $180,250 to $170,000. The number of homes for sale increased 7% from 417 to 447 properties, while the number of homes sold decreased 13% from 30 to 26 properties over the same period.
Rowlett TX - January 2011 - Housing Market ReportValarie Littles
The document compares real estate data from January 2010 to January 2011 in Rowlett, Texas. It finds that the median price of for-sale properties decreased 6% while the median price of sold properties increased 14%. Additionally, the number of for-sale properties increased 17% while the number of properties sold decreased 8%.
Richardson TX - January 2011 - Housing Market ReportValarie Littles
The document compares housing market data from January 2010 to January 2011 in Richardson, Texas. It shows that the median price of for-sale properties was unchanged, while the median price of sold properties decreased by 17%. The number of for-sale properties increased by 33%, while the number of properties sold decreased by 33%.
McKinney TX - January 2011 - Housing Market ReportValarie Littles
The number of properties for sale increased 4% from January 2010 to January 2011, while the number of properties sold increased 1%. The average months of inventory, which measures the supply and demand of properties, increased 3% from 4.9 months in January 2010 to 5.0 months in January 2011.
AVRUPA KONUTLARI ESENTEPE - ENGLISH - Listing TurkeyListing Turkey
Looking for a new home in Istanbul? Look no further than Avrupa Konutlari Esentepe! Our beautifully designed homes provide the perfect blend of luxury and comfort, making them the perfect choice for anyone looking for a high-quality home in the city.
With a wide range of apartment types available, from 1+1 to 4+1, we have something to suit every need and budget. Each apartment is designed with attention to detail and features spacious and bright living areas, making them the perfect place to relax and unwind after a long day.
One of the things that sets Avrupa Konutlari Esentepe apart from other developments is our focus on creating a community that is both comfortable and convenient. Our homes are surrounded by lush green spaces, perfect for enjoying a peaceful stroll or having a picnic with friends and family. Additionally, our complex includes a variety of social and recreational amenities, such as swimming pools, sports fields, and playgrounds, making it easy for residents to stay active and socialize with their neighbors.
https://listingturkey.com/property/avrupa-konutlari-esentepe/
Anilesh Ahuja Pioneering a Paradigm Shift in Real Estate Success.pptxneilahuja668
Anilesh Ahuja journey is a testament to the power of vision, resilience, and unwavering determination. As a visionary leader, he continues to inspire and empower others to dream big and challenge the status quo. His legacy extends far beyond the realm of real estate, leaving an indelible mark on the industry and the world at large.
Stark Builders: Where Quality Meets Craftsmanship!shuilykhatunnil
At Stark Builders our vision is to redefine the renovation experience by combining both stunning design and high quality construction skills. We believe that by delivering both these key aspects together we are able to achieve incredible results for our clients and ensure every project reflects their vision and enhances their lifestyle.
Although we are not all related by blood we have created a team of highly professional and hardworking individuals who share the common goal of delivering beautiful and functional renovated spaces. Our tight nit team are able to work together in a way where we pour our passion into each and every project as we have a love for what we do. Building is our life.
The SVN® organization shares a portion of their new weekly listings via their SVN Live® Weekly Property Broadcast. Visit https://svn.com/svn-live/ if you would like to attend our weekly call, which we open up to the brokerage community.
Kumar Codename Fireworks at Hadapsar Link Road, Pune - PDF.pdfmonikasharma630
Codename Fireworks developed by Kumar Properties is a new residential development that offers 2/3 BHK premium residences with easy access to proposed ring road, airport, metro station.
For More Details:
Visit Here: kumar.developerprojects.com
Living in an UBER World - June '24 Sales MeetingTom Blefko
June 2024 Lancaster County Sales Meeting for Berkshire Hathaway HomeServices Homesale Realty covering the following topics: 1. VA Suspends Buyer Agent Payment Plan (article), 2. Frequently Used Terms in title, 3. Zillow Showcase Overview, 4. QuickBuy commission promotion, 5. Documenting Cooperative Compensation, 6. NAR's Code of Ethics - Mass Media Solicitations, 7. Is it really cheaper to rent? 8. Do's and Don't's when Terminating the Agreement of Sale, 9. Living in an UBER World
BEST FARMLAND FOR SALE | FARM PLOTS NEAR BANGALORE | KANAKAPURA | CHICKKABALP...knox groups real estate
welcome to knox groups real estate company in Bangalore. best farm land for sale near Bangalore and madhugiri . Managed farmland near Kanakapura and Chickkabalapur get know more details about the projects .Knox groups is a leading real estate company dedicated to helping individuals and businesses navigate the dynamic real estate market. With our extensive knowledge, experience, and commitment to excellence, we deliver exceptional results for our clients. Discover the perfect foundation for your agricultural aspirations with KNOX Groups' prime farm lands. These aren't just plots; they're the fertile grounds where vibrant crops flourish, livestock thrives, and unique agricultural ventures come to life. At KNOX, we go beyond selling land we curate sustainable ecosystems, ensuring that your journey toward agricultural success is seamless and prosperous.