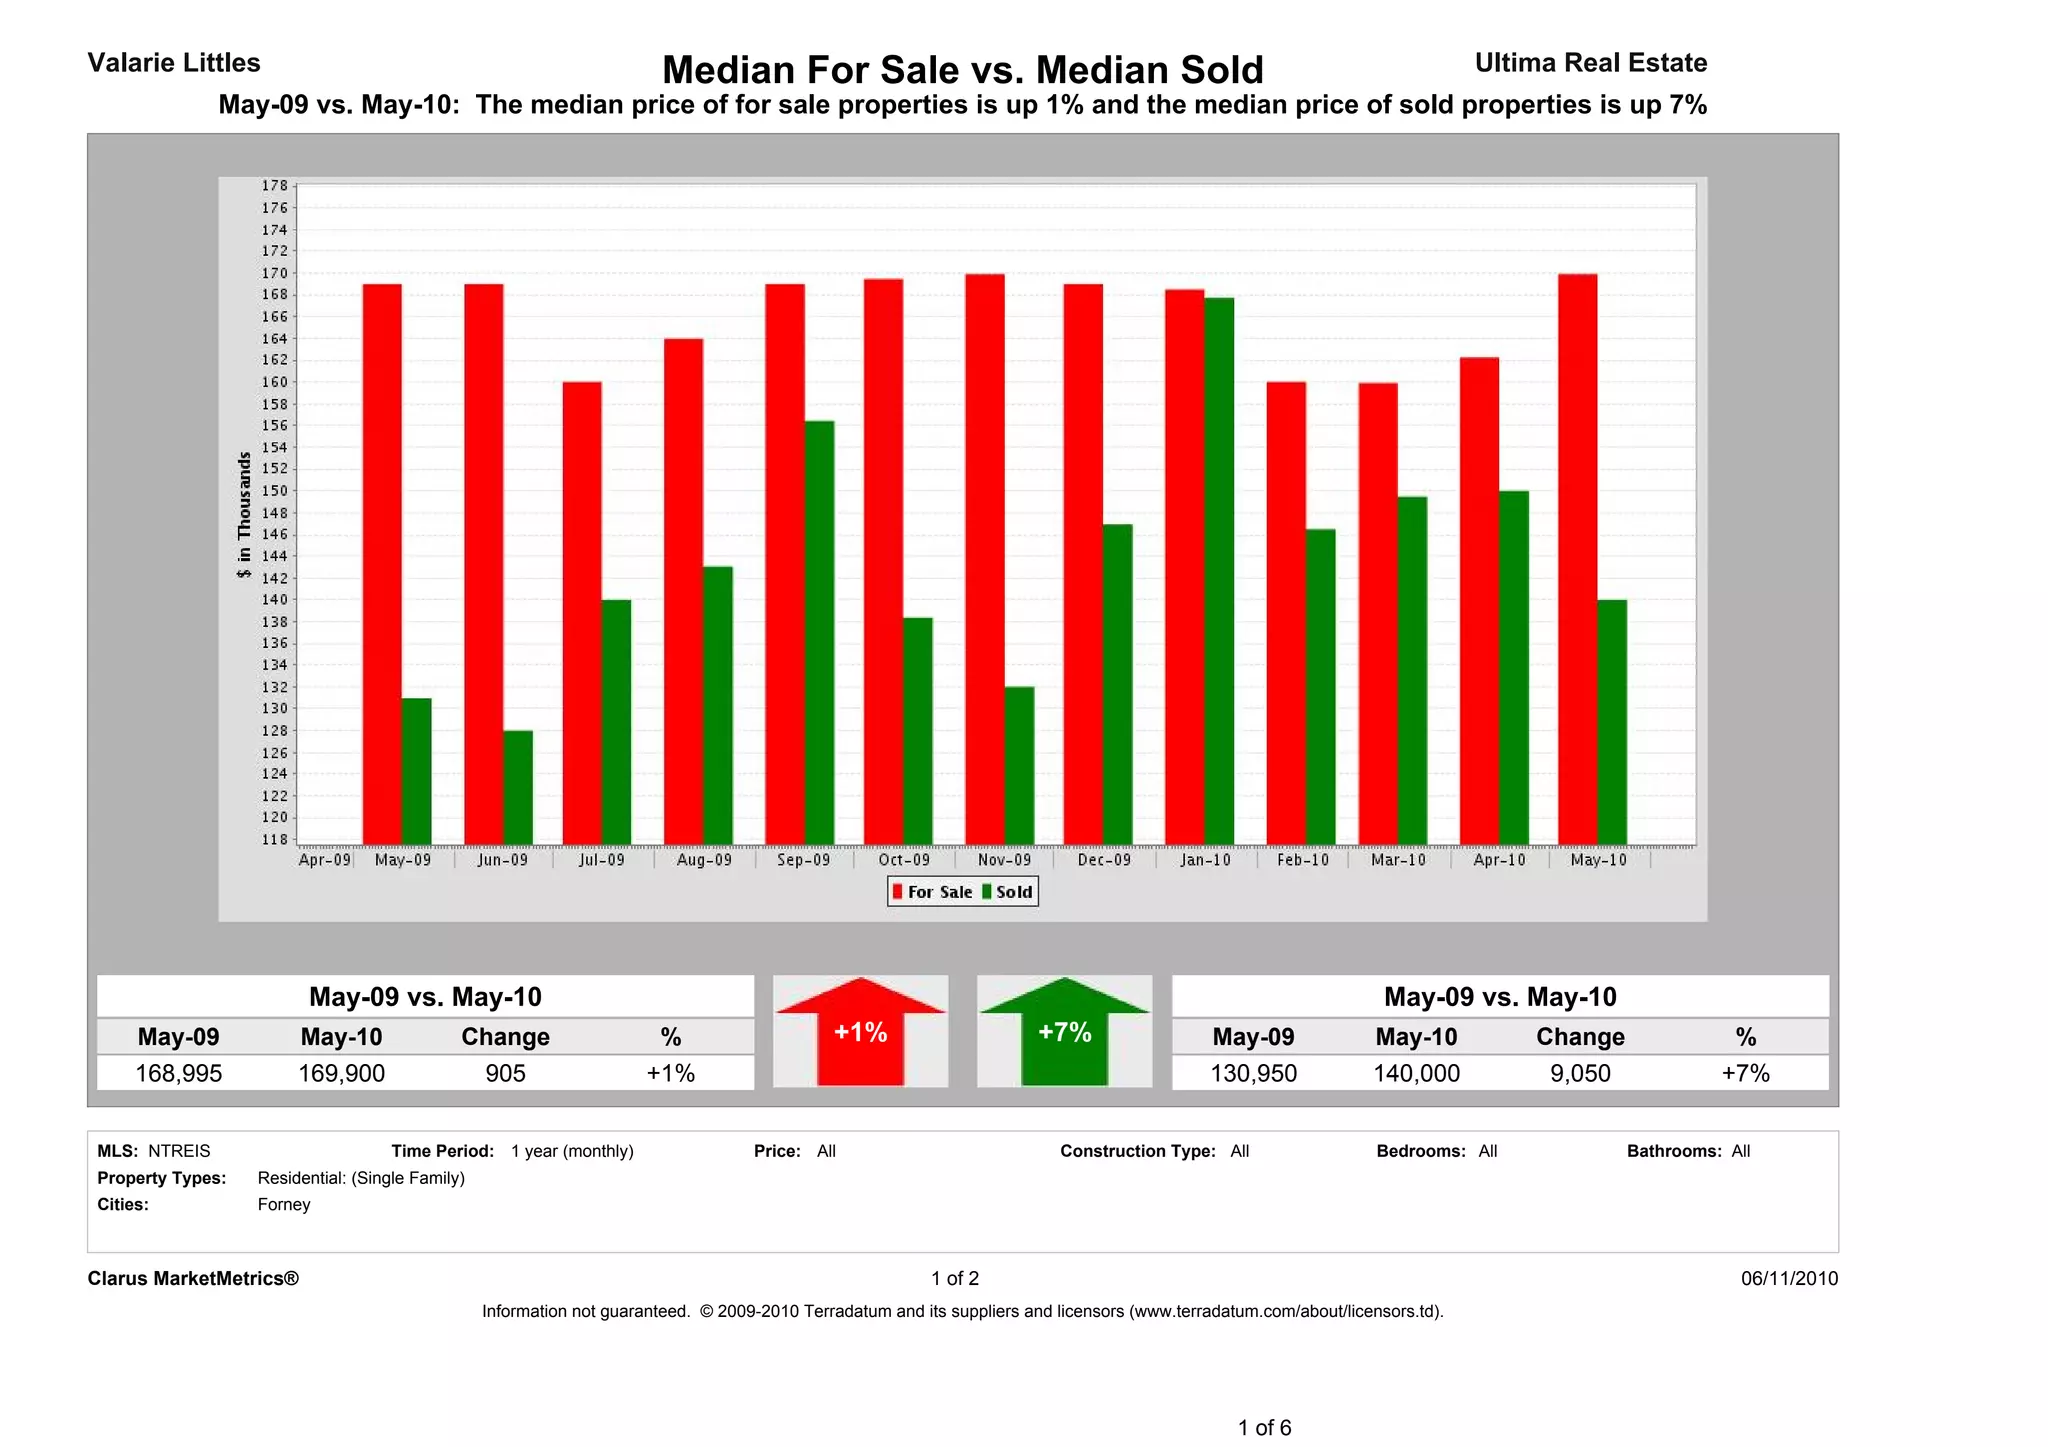
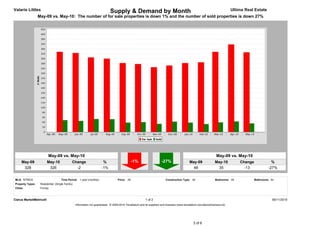
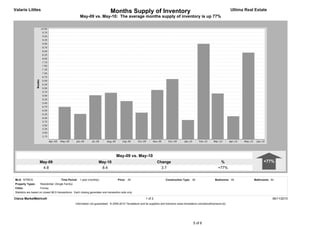
The median price of for sale properties increased 1% from May 2009 to May 2010, while the median price of sold properties increased 7% over the same period. The number of for sale properties decreased 1% from 328 to 326 properties, while the number of sold properties decreased 27% from 48 to 35 properties sold. Additionally, the average months supply of inventory, a measure of housing demand and supply balance, increased 77% from 4.8 months in May 2009 to 8.4 months in May 2010.