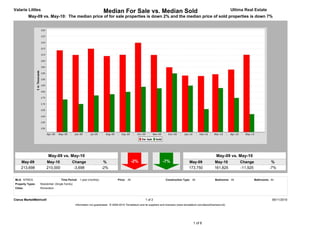
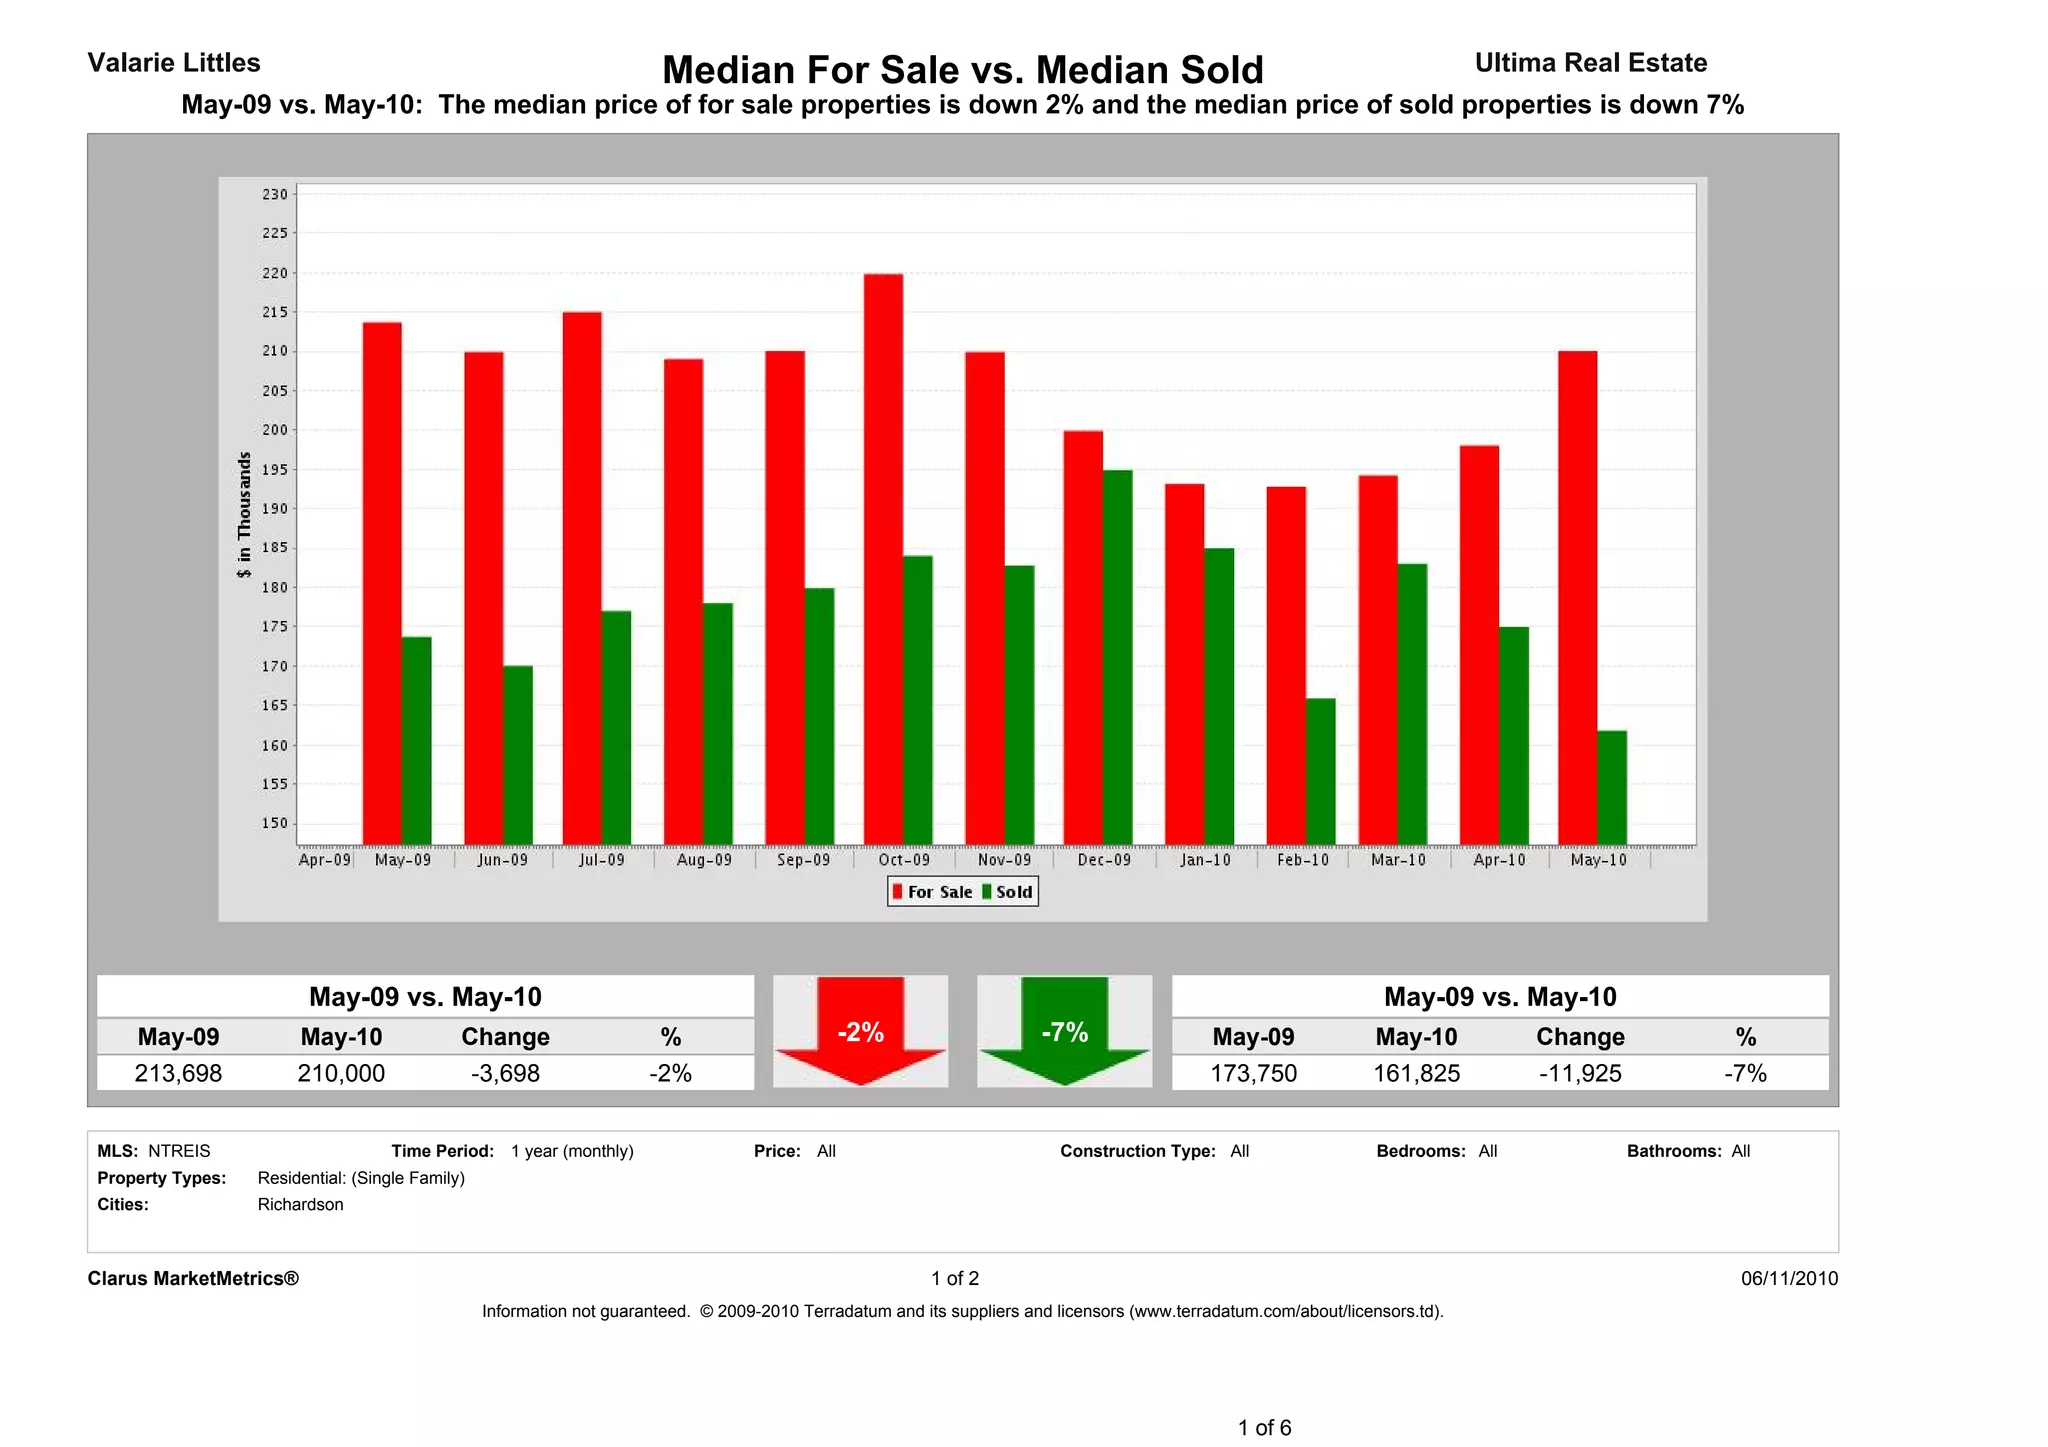
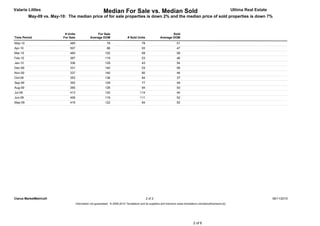
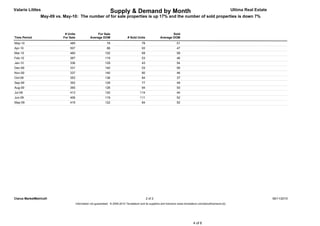
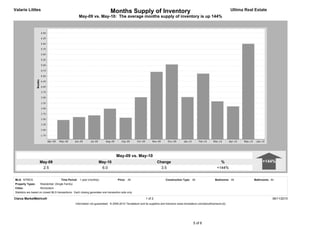
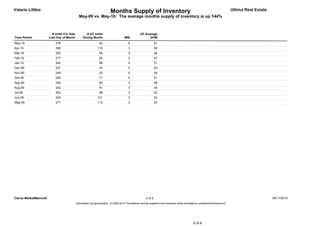
Valarie Littles                                                        Median For Sale vs. Median Sold                                                                         Ultima Real Estate
          May-09 vs. May-10: The median price of for sale properties is down 2% and the median price of sold properties is down 7%


                        May-09 vs. May-10                                                                                                                           May-09 vs. May-10
     May-09            May-10                Change                    %                        -2%                     -7%                   May-09              May-10           Change                %
     213,698           210,000                -3,698                  -2%                                                                     173,750             161,825          -11,925              -7%


MLS: NTREIS                         Time Period: 1 year (monthly)                  Price: All                             Construction Type: All                   Bedrooms: All             Bathrooms: All
Property Types:   Residential: (Single Family)
Cities:           Richardson


Clarus MarketMetrics®                                                                                     1 of 2                                                                                         06/11/2010
                                                 Information not guaranteed. © 2009-2010 Terradatum and its suppliers and licensors (www.terradatum.com/about/licensors.td).


                                                                                                                                                 1 of 6
Valarie Littles                                            Median For Sale vs. Median Sold                                                                         Ultima Real Estate
         May-09 vs. May-10: The median price of for sale properties is down 2% and the median price of sold properties is down 7%


                           # Units                   For Sale                                                     Sold
Time Period               For Sale              Average DOM                    # Sold Units               Average DOM
May-10                        485                             78                           78                          51
Apr-10                        507                             88                           93                          47
Mar-10                        460                            102                           69                          58
Feb-10                        367                            119                           53                          46
Jan-10                        336                            129                           43                          54
Dec-09                        331                            140                           53                          56
Nov-09                        337                            140                           80                          46
Oct-09                        353                            136                           84                          37
Sep-09                        352                            129                           77                          49
Aug-09                        365                            126                           94                          50
Jul-09                        413                            120                         114                           44
Jun-09                        406                            119                         111                           52
May-09                        416                            122                           84                          52


Clarus MarketMetrics®                                                                           2 of 2                                                                                  06/11/2010
                                     Information not guaranteed. © 2009-2010 Terradatum and its suppliers and licensors (www.terradatum.com/about/licensors.td).


                                                                                                                                     2 of 6
Valarie Littles                                                              Supply & Demand by Month                                                                          Ultima Real Estate
                  May-09 vs. May-10: The number of for sale properties is up 17% and the number of sold properties is down 7%


                        May-09 vs. May-10                                                                                                                           May-09 vs. May-10
     May-09             May-10               Change                   %                      +17%                       -7%                   May-09               May-10          Change               %
      416                485                   69                    +17%                                                                       84                   78              -6                -7%


MLS: NTREIS                         Time Period: 1 year (monthly)                  Price: All                             Construction Type: All                   Bedrooms: All            Bathrooms: All
Property Types:   Residential: (Single Family)
Cities:           Richardson


Clarus MarketMetrics®                                                                                     1 of 2                                                                                        06/11/2010
                                                 Information not guaranteed. © 2009-2010 Terradatum and its suppliers and licensors (www.terradatum.com/about/licensors.td).


                                                                                                                                                 3 of 6
Valarie Littles                                                   Supply & Demand by Month                                                                          Ultima Real Estate
                May-09 vs. May-10: The number of for sale properties is up 17% and the number of sold properties is down 7%


                            # Units                   For Sale                                                     Sold
Time Period                For Sale              Average DOM                    # Sold Units               Average DOM
May-10                         485                             78                           78                          51
Apr-10                         507                             88                           93                          47
Mar-10                         460                            102                           69                          58
Feb-10                         367                            119                           53                          46
Jan-10                         336                            129                           43                          54
Dec-09                         331                            140                           53                          56
Nov-09                         337                            140                           80                          46
Oct-09                         353                            136                           84                          37
Sep-09                         352                            129                           77                          49
Aug-09                         365                            126                           94                          50
Jul-09                         413                            120                         114                           44
Jun-09                         406                            119                         111                           52
May-09                         416                            122                           84                          52


Clarus MarketMetrics®                                                                            2 of 2                                                                                  06/11/2010
                                      Information not guaranteed. © 2009-2010 Terradatum and its suppliers and licensors (www.terradatum.com/about/licensors.td).


                                                                                                                                      4 of 6
Valarie Littles                                                                Months Supply of Inventory                                                                        Ultima Real Estate
                                                     May-09 vs. May-10: The average months supply of inventory is up 144%


                                                                                    May-09 vs. May-10
                    May-09                                           May-10                                          Change                                             %                        +144%
                     2.5                                              6.0                                              3.5                                            +144%


MLS: NTREIS                           Time Period: 1 year (monthly)                  Price: All                             Construction Type: All                   Bedrooms: All          Bathrooms: All
Property Types:     Residential: (Single Family)
Cities:             Richardson
Statistics are based on closed MLS transactions. Each closing generates one transaction side only.

Clarus MarketMetrics®                                                                                       1 of 2                                                                                       06/11/2010
                                                   Information not guaranteed. © 2009-2010 Terradatum and its suppliers and licensors (www.terradatum.com/about/licensors.td).


                                                                                                                                                   5 of 6
Valarie Littles                                                          Months Supply of Inventory                                                                        Ultima Real Estate
                                               May-09 vs. May-10: The average months supply of inventory is up 144%


                          # Units For Sale          # UC Units                                   UC Average
Time Period             Last Day of Month         During Month                      MSI                DOM
May-10                      378                                 63                      6                      51
Apr-10                      356                               115                       3                      59
Mar-10                      320                                 96                      3                      48
Feb-10                      277                                 60                      5                      47
Jan-10                      240                                 68                      4                      51
Dec-09                      237                                 47                      5                      53
Nov-09                      249                                 53                      5                      54
Oct-09                      250                                 71                      4                      51
Sep-09                      229                                 89                      3                      48
Aug-09                      242                                 81                      3                      45
Jul-09                      263                                 98                      3                      52
Jun-09                      263                               101                       3                      42
May-09                      271                               110                       2                      53


Clarus MarketMetrics®                                                                                 2 of 2                                                                                    06/11/2010
                                             Information not guaranteed. © 2009-2010 Terradatum and its suppliers and licensors (www.terradatum.com/about/licensors.td).


                                                                                                                                             6 of 6

Richardson - May 2010 Market Report

  • 1.
    Valarie Littles Median For Sale vs. Median Sold Ultima Real Estate May-09 vs. May-10: The median price of for sale properties is down 2% and the median price of sold properties is down 7% May-09 vs. May-10 May-09 vs. May-10 May-09 May-10 Change % -2% -7% May-09 May-10 Change % 213,698 210,000 -3,698 -2% 173,750 161,825 -11,925 -7% MLS: NTREIS Time Period: 1 year (monthly) Price: All Construction Type: All Bedrooms: All Bathrooms: All Property Types: Residential: (Single Family) Cities: Richardson Clarus MarketMetrics® 1 of 2 06/11/2010 Information not guaranteed. © 2009-2010 Terradatum and its suppliers and licensors (www.terradatum.com/about/licensors.td). 1 of 6
  • 2.
    Valarie Littles Median For Sale vs. Median Sold Ultima Real Estate May-09 vs. May-10: The median price of for sale properties is down 2% and the median price of sold properties is down 7% # Units For Sale Sold Time Period For Sale Average DOM # Sold Units Average DOM May-10 485 78 78 51 Apr-10 507 88 93 47 Mar-10 460 102 69 58 Feb-10 367 119 53 46 Jan-10 336 129 43 54 Dec-09 331 140 53 56 Nov-09 337 140 80 46 Oct-09 353 136 84 37 Sep-09 352 129 77 49 Aug-09 365 126 94 50 Jul-09 413 120 114 44 Jun-09 406 119 111 52 May-09 416 122 84 52 Clarus MarketMetrics® 2 of 2 06/11/2010 Information not guaranteed. © 2009-2010 Terradatum and its suppliers and licensors (www.terradatum.com/about/licensors.td). 2 of 6
  • 3.
    Valarie Littles Supply & Demand by Month Ultima Real Estate May-09 vs. May-10: The number of for sale properties is up 17% and the number of sold properties is down 7% May-09 vs. May-10 May-09 vs. May-10 May-09 May-10 Change % +17% -7% May-09 May-10 Change % 416 485 69 +17% 84 78 -6 -7% MLS: NTREIS Time Period: 1 year (monthly) Price: All Construction Type: All Bedrooms: All Bathrooms: All Property Types: Residential: (Single Family) Cities: Richardson Clarus MarketMetrics® 1 of 2 06/11/2010 Information not guaranteed. © 2009-2010 Terradatum and its suppliers and licensors (www.terradatum.com/about/licensors.td). 3 of 6
  • 4.
    Valarie Littles Supply & Demand by Month Ultima Real Estate May-09 vs. May-10: The number of for sale properties is up 17% and the number of sold properties is down 7% # Units For Sale Sold Time Period For Sale Average DOM # Sold Units Average DOM May-10 485 78 78 51 Apr-10 507 88 93 47 Mar-10 460 102 69 58 Feb-10 367 119 53 46 Jan-10 336 129 43 54 Dec-09 331 140 53 56 Nov-09 337 140 80 46 Oct-09 353 136 84 37 Sep-09 352 129 77 49 Aug-09 365 126 94 50 Jul-09 413 120 114 44 Jun-09 406 119 111 52 May-09 416 122 84 52 Clarus MarketMetrics® 2 of 2 06/11/2010 Information not guaranteed. © 2009-2010 Terradatum and its suppliers and licensors (www.terradatum.com/about/licensors.td). 4 of 6
  • 5.
    Valarie Littles Months Supply of Inventory Ultima Real Estate May-09 vs. May-10: The average months supply of inventory is up 144% May-09 vs. May-10 May-09 May-10 Change % +144% 2.5 6.0 3.5 +144% MLS: NTREIS Time Period: 1 year (monthly) Price: All Construction Type: All Bedrooms: All Bathrooms: All Property Types: Residential: (Single Family) Cities: Richardson Statistics are based on closed MLS transactions. Each closing generates one transaction side only. Clarus MarketMetrics® 1 of 2 06/11/2010 Information not guaranteed. © 2009-2010 Terradatum and its suppliers and licensors (www.terradatum.com/about/licensors.td). 5 of 6
  • 6.
    Valarie Littles Months Supply of Inventory Ultima Real Estate May-09 vs. May-10: The average months supply of inventory is up 144% # Units For Sale # UC Units UC Average Time Period Last Day of Month During Month MSI DOM May-10 378 63 6 51 Apr-10 356 115 3 59 Mar-10 320 96 3 48 Feb-10 277 60 5 47 Jan-10 240 68 4 51 Dec-09 237 47 5 53 Nov-09 249 53 5 54 Oct-09 250 71 4 51 Sep-09 229 89 3 48 Aug-09 242 81 3 45 Jul-09 263 98 3 52 Jun-09 263 101 3 42 May-09 271 110 2 53 Clarus MarketMetrics® 2 of 2 06/11/2010 Information not guaranteed. © 2009-2010 Terradatum and its suppliers and licensors (www.terradatum.com/about/licensors.td). 6 of 6