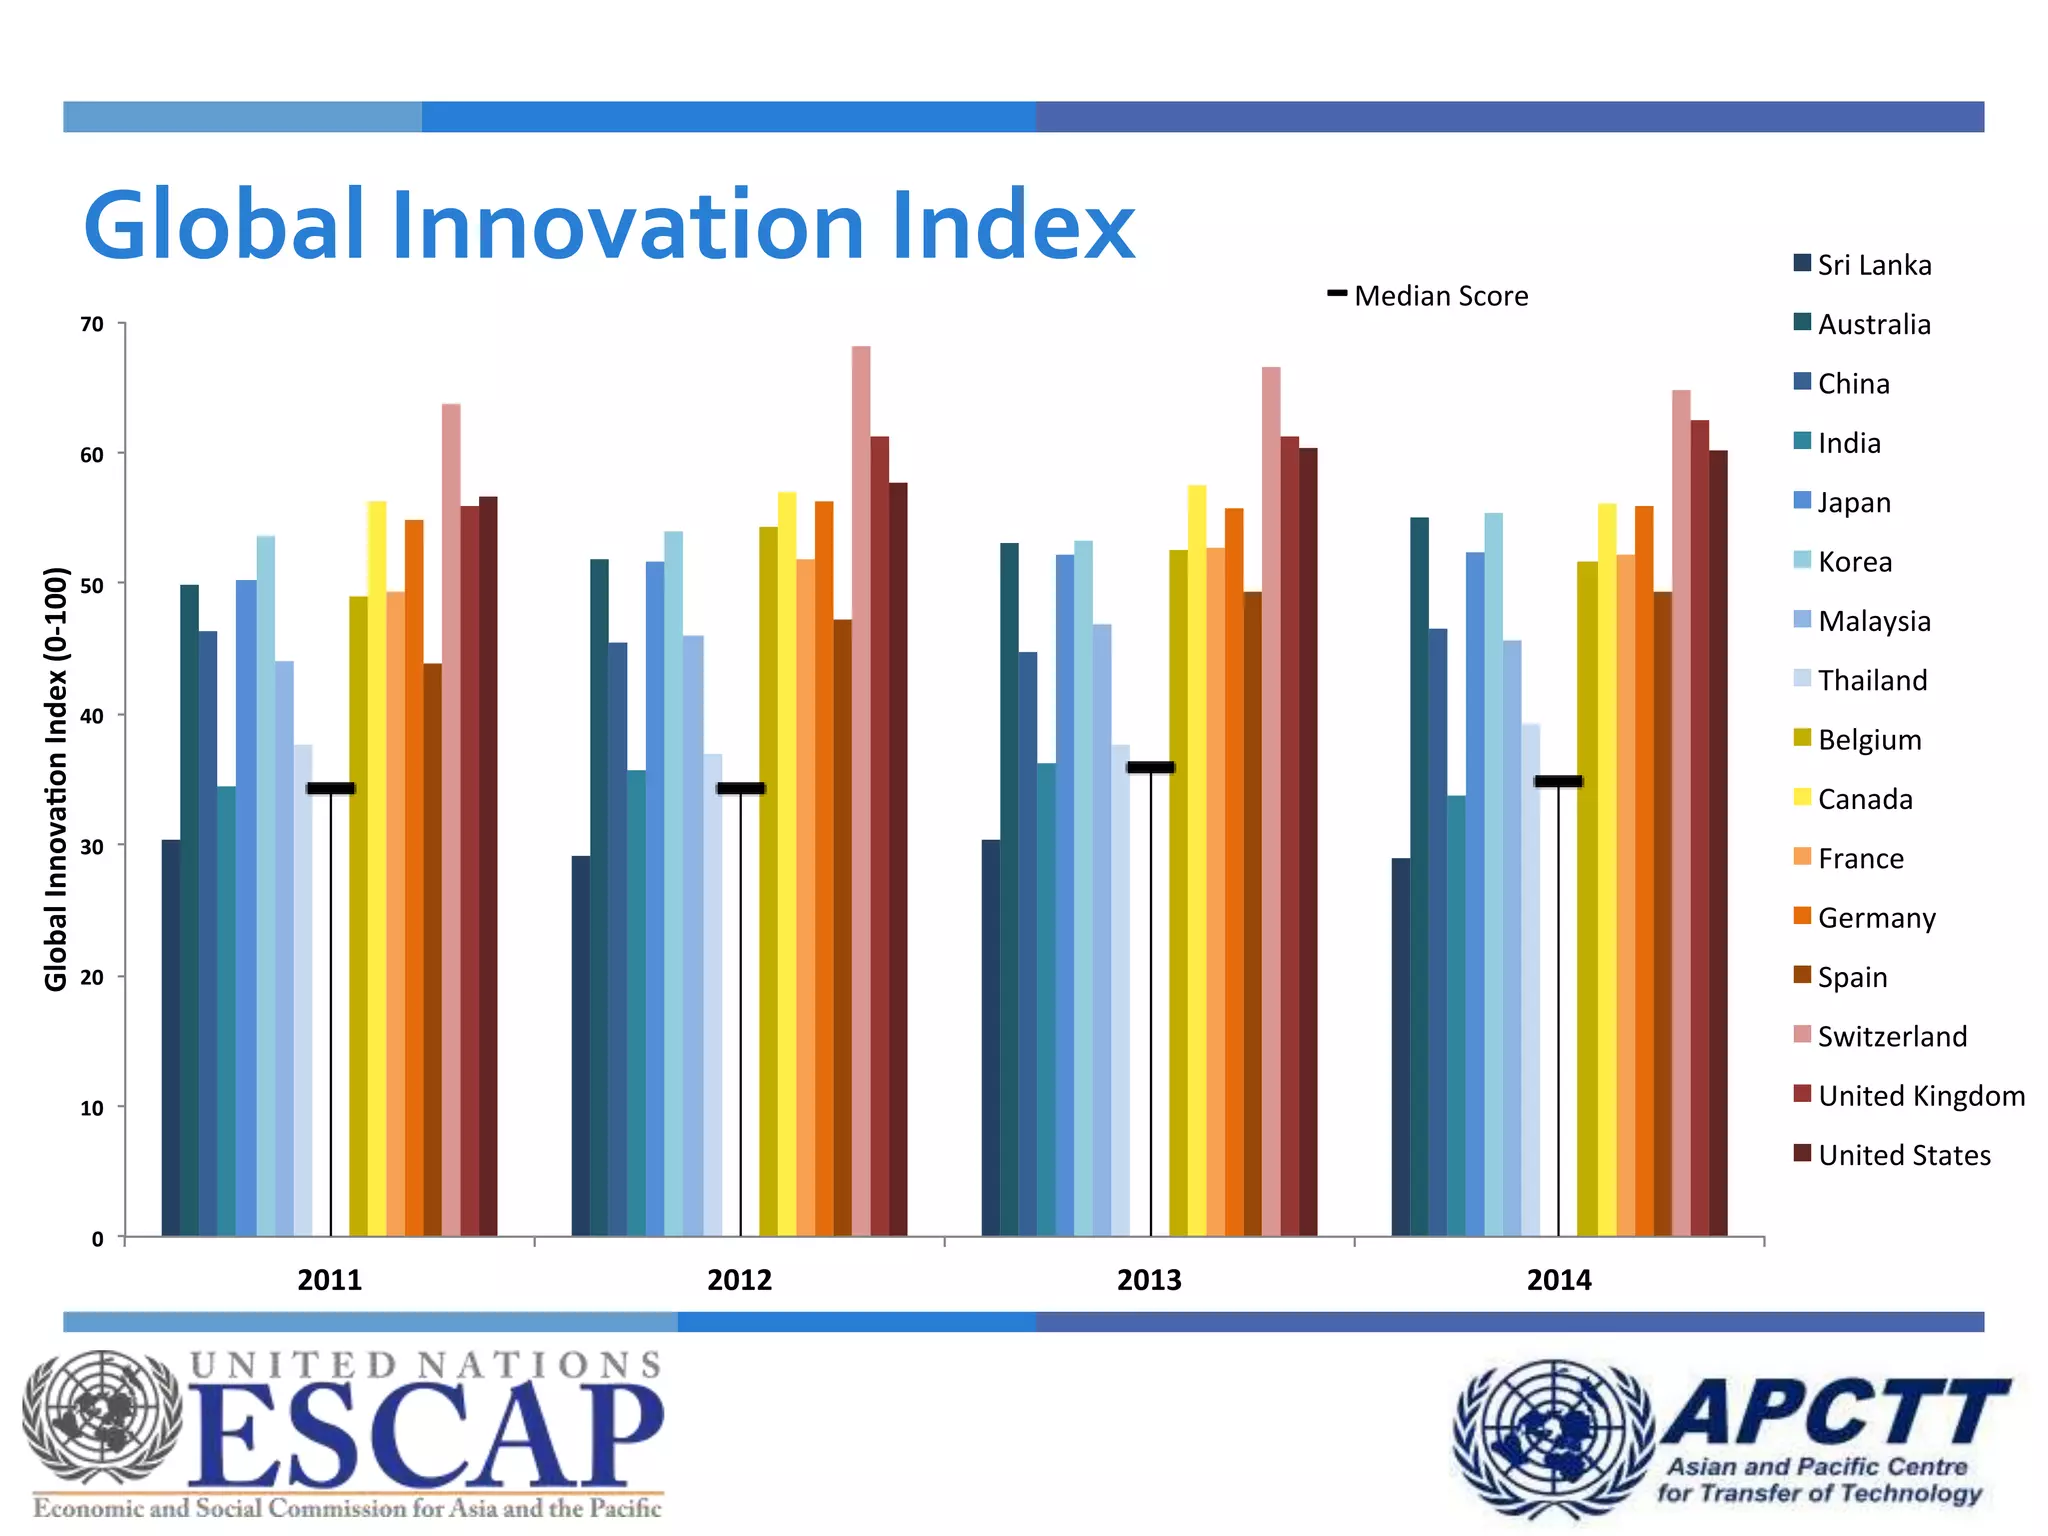
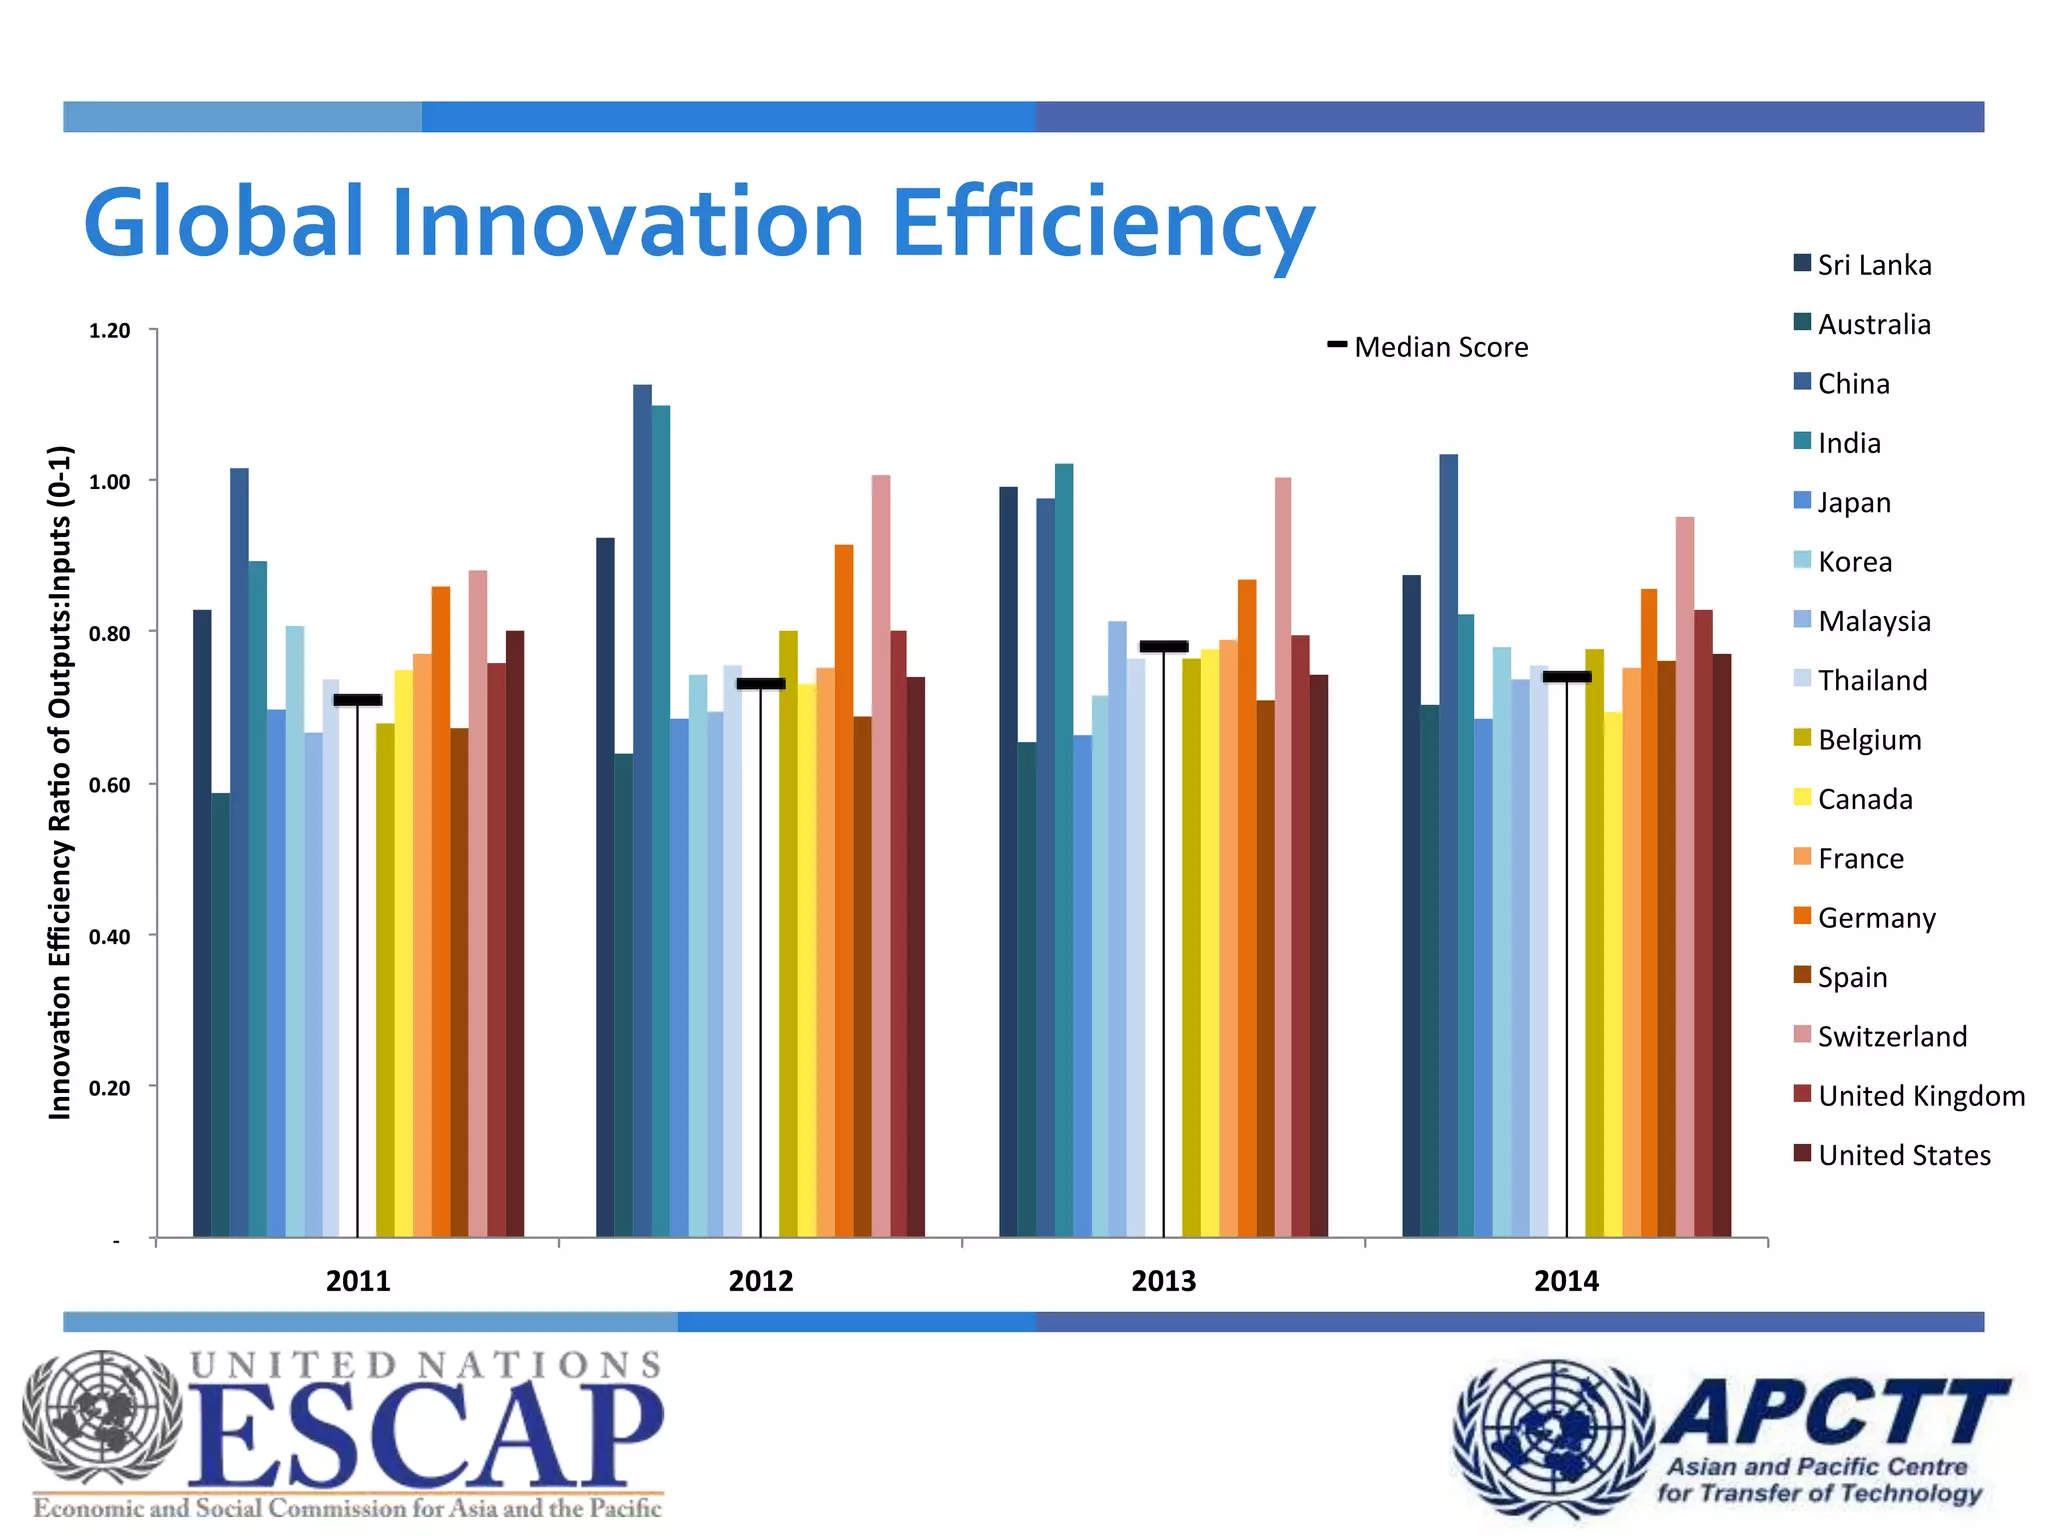
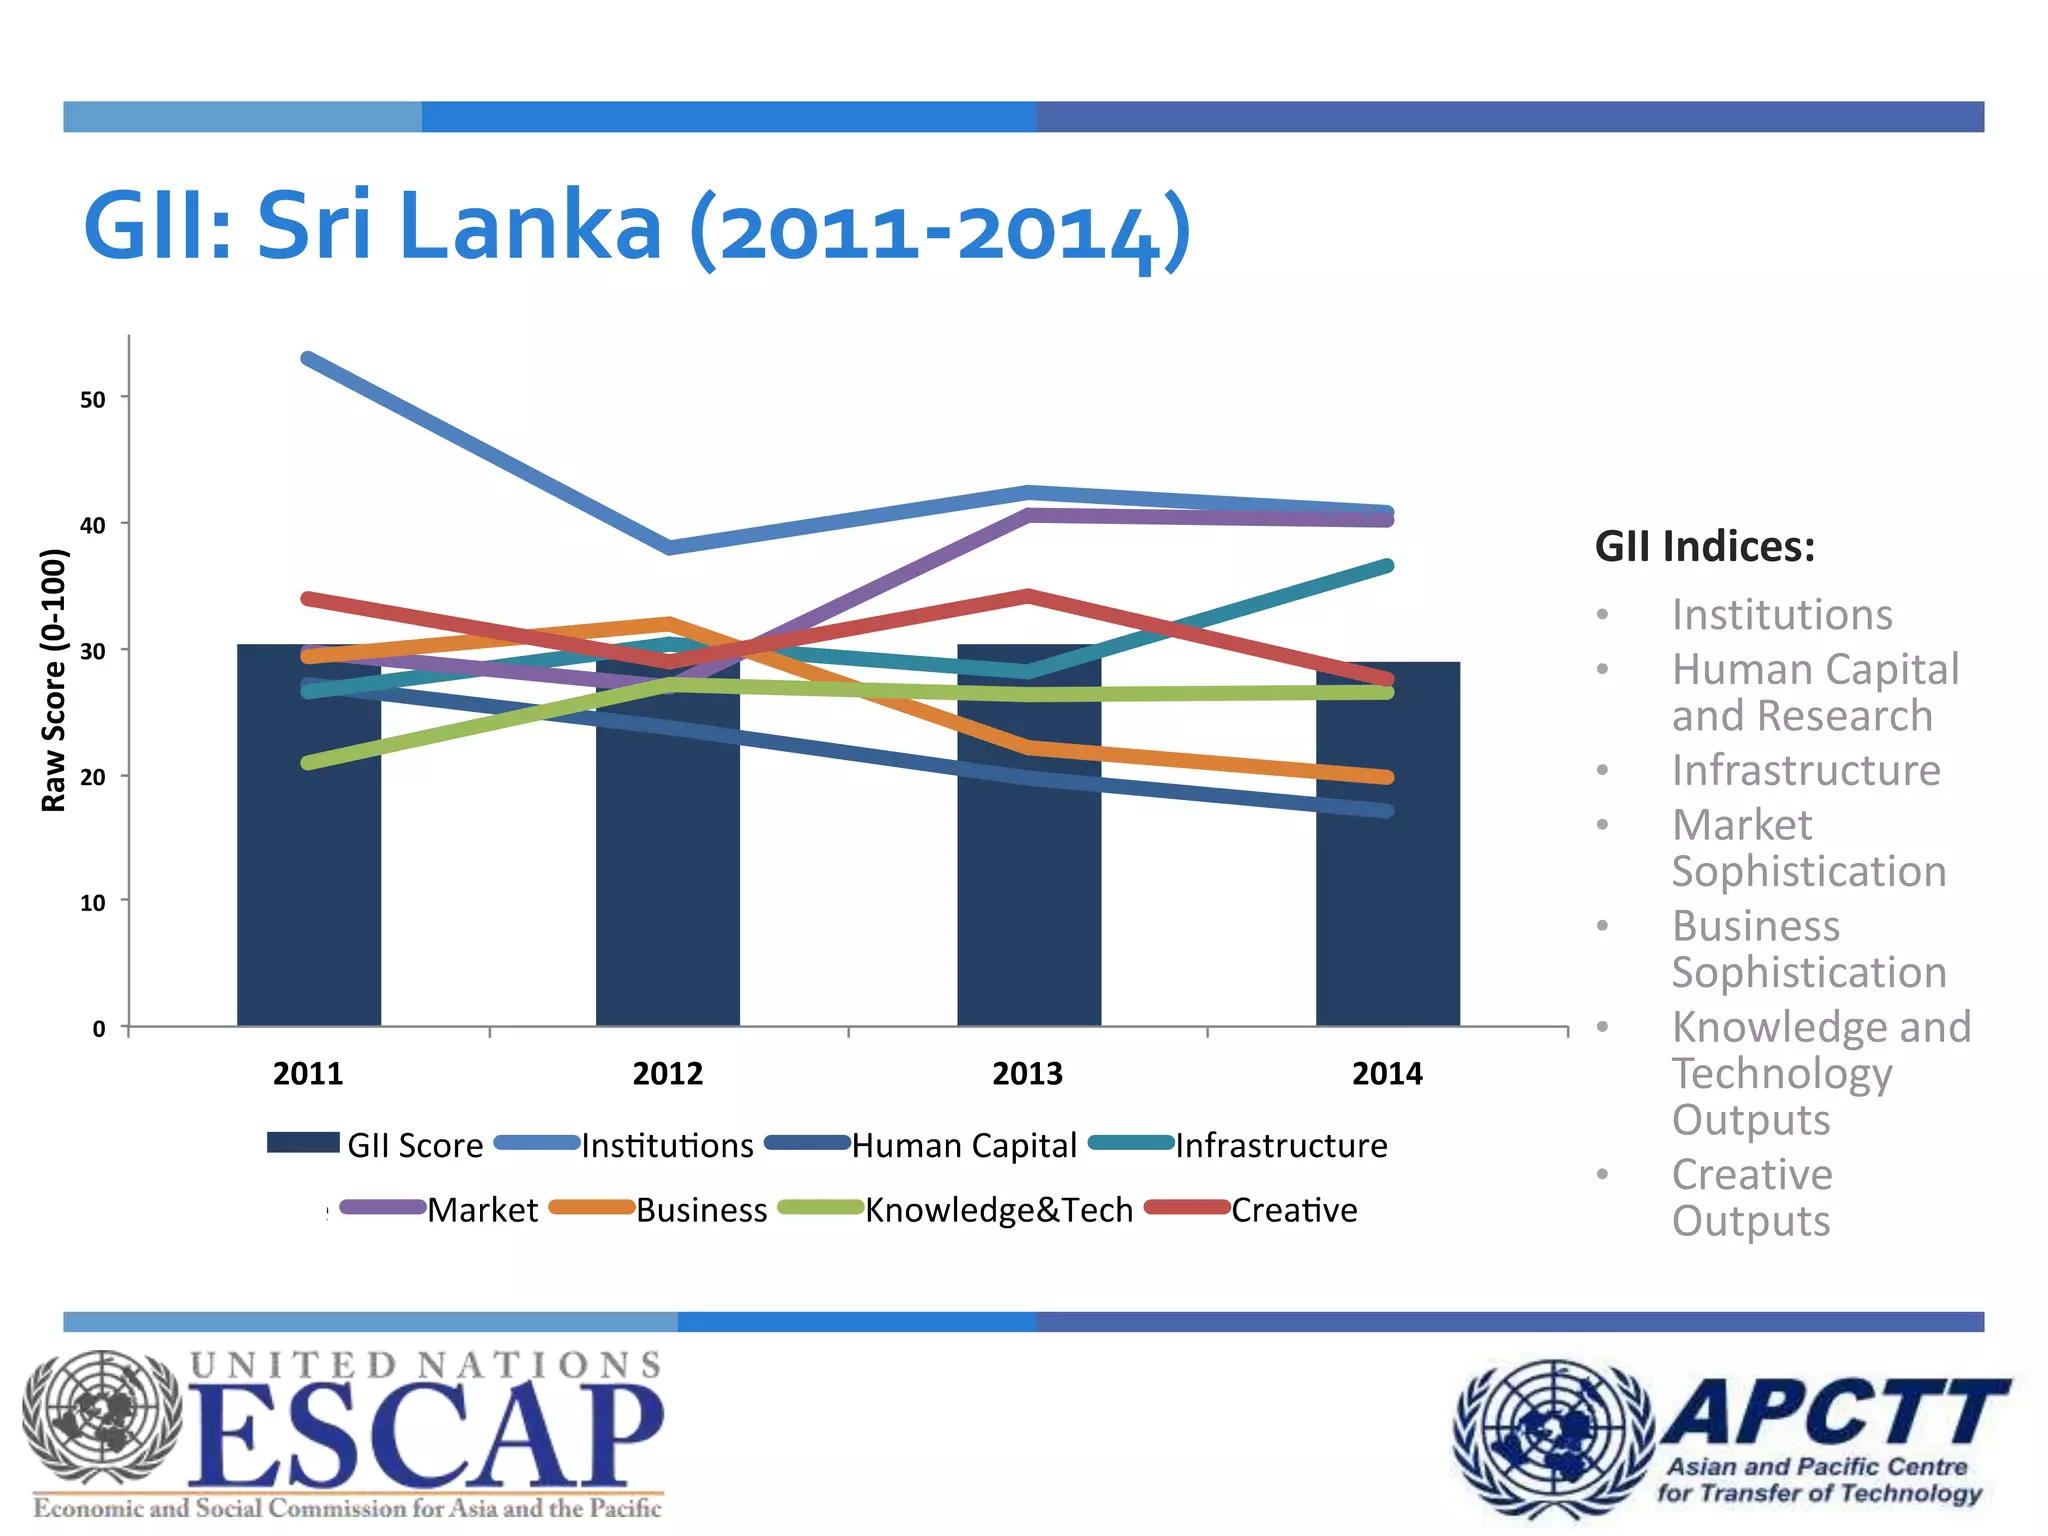
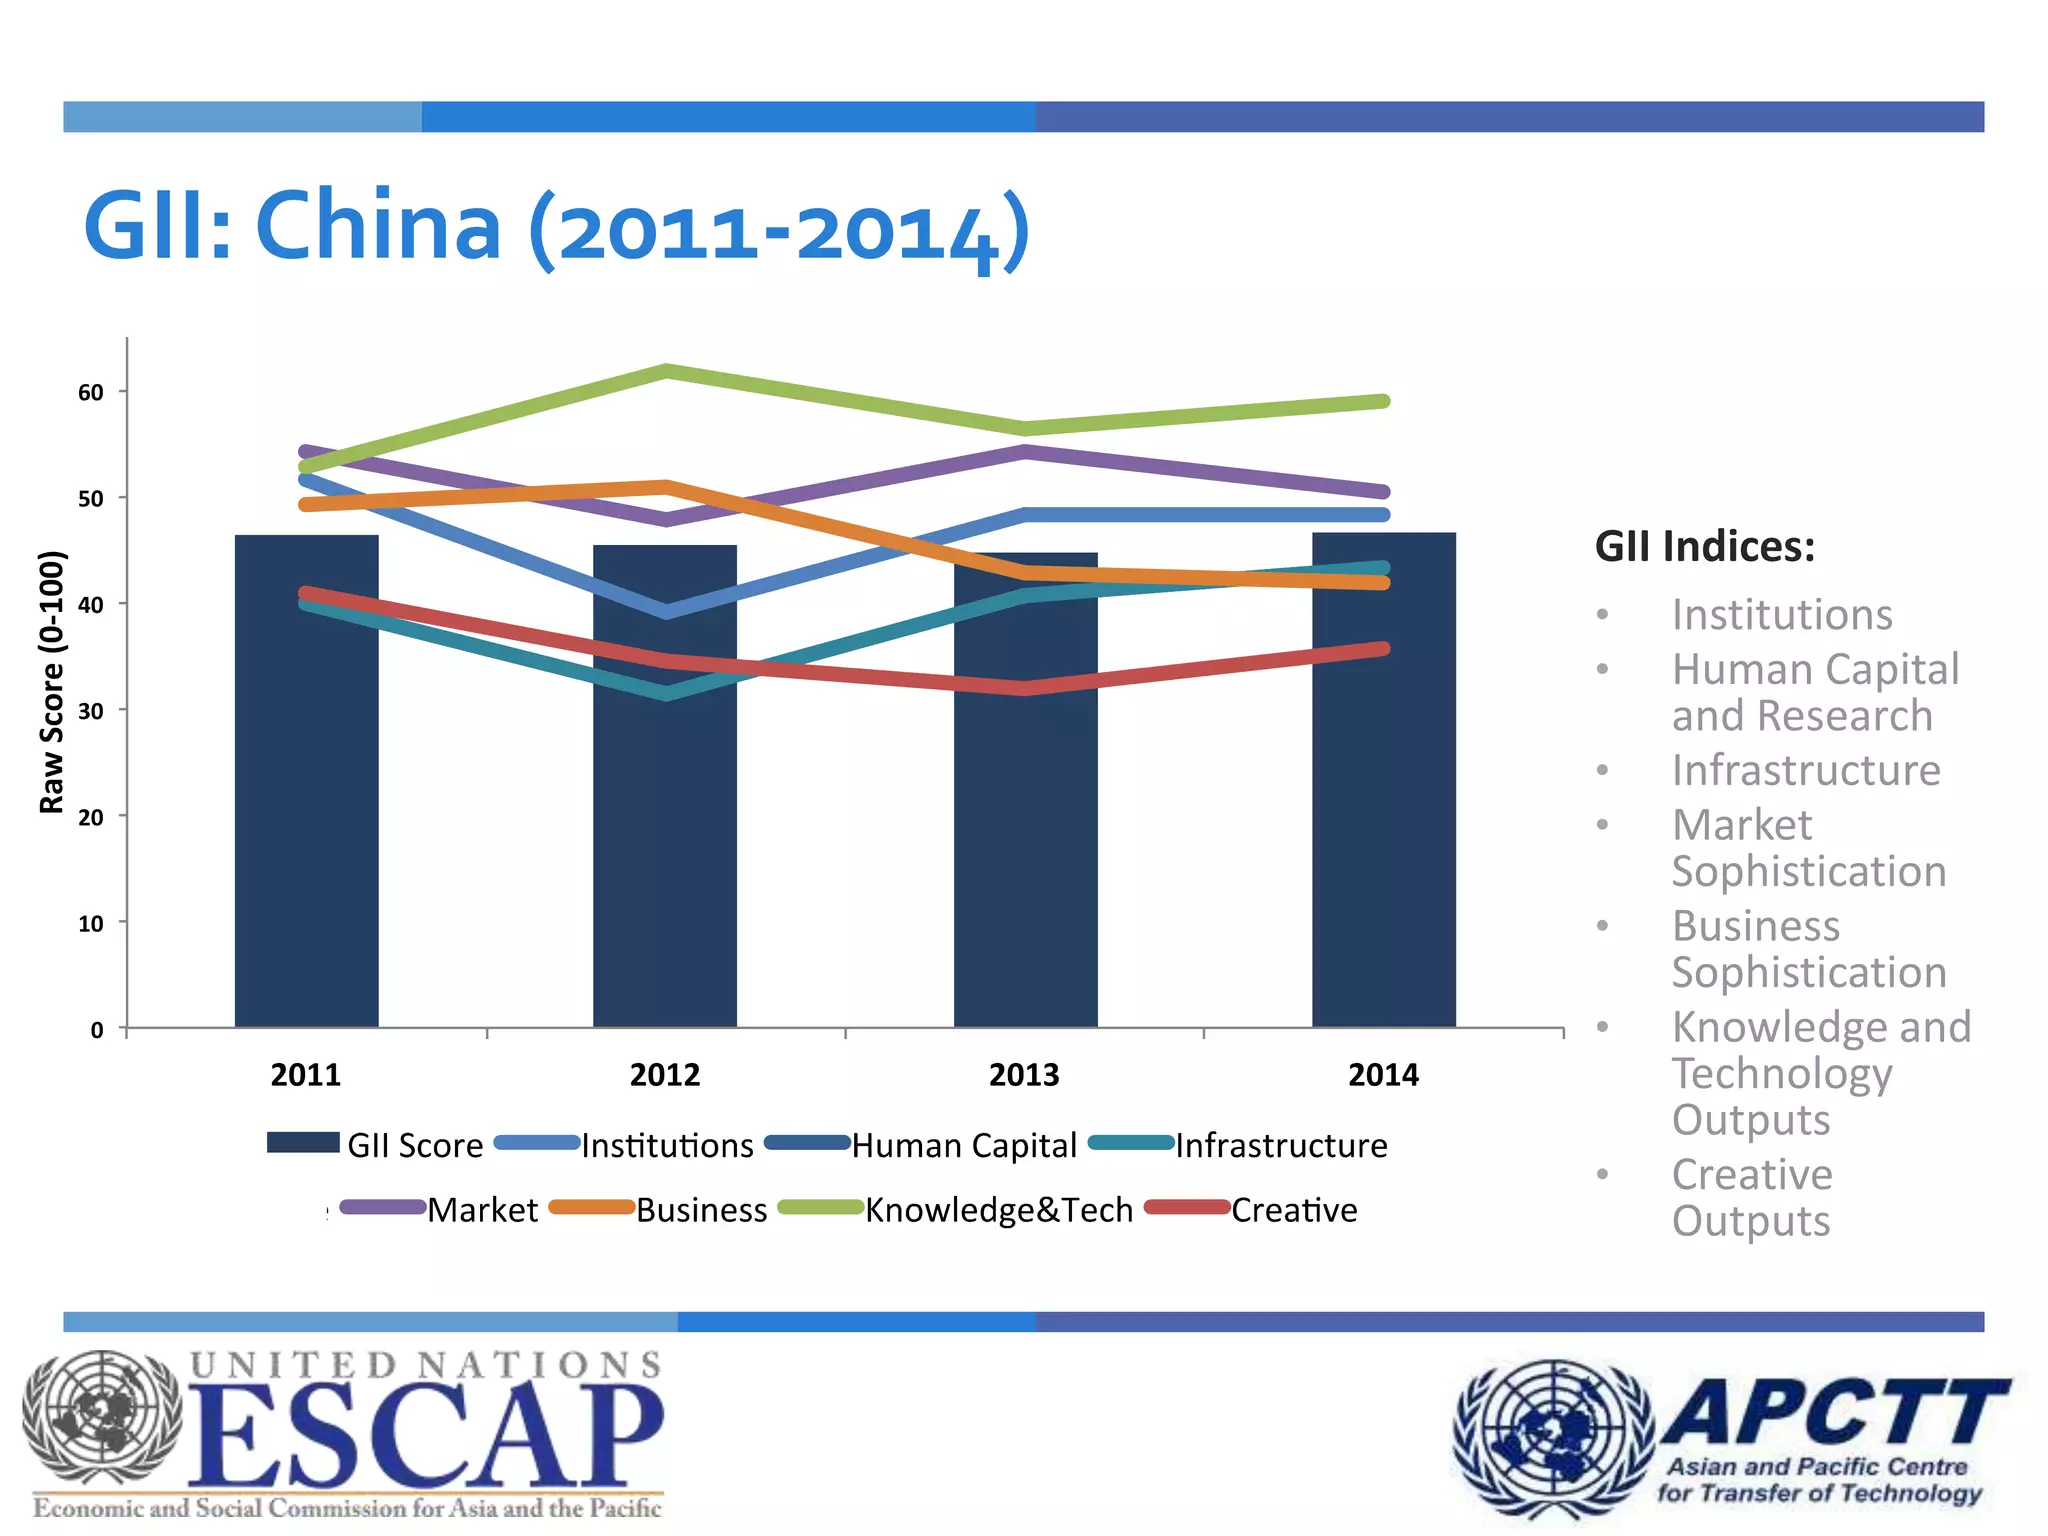
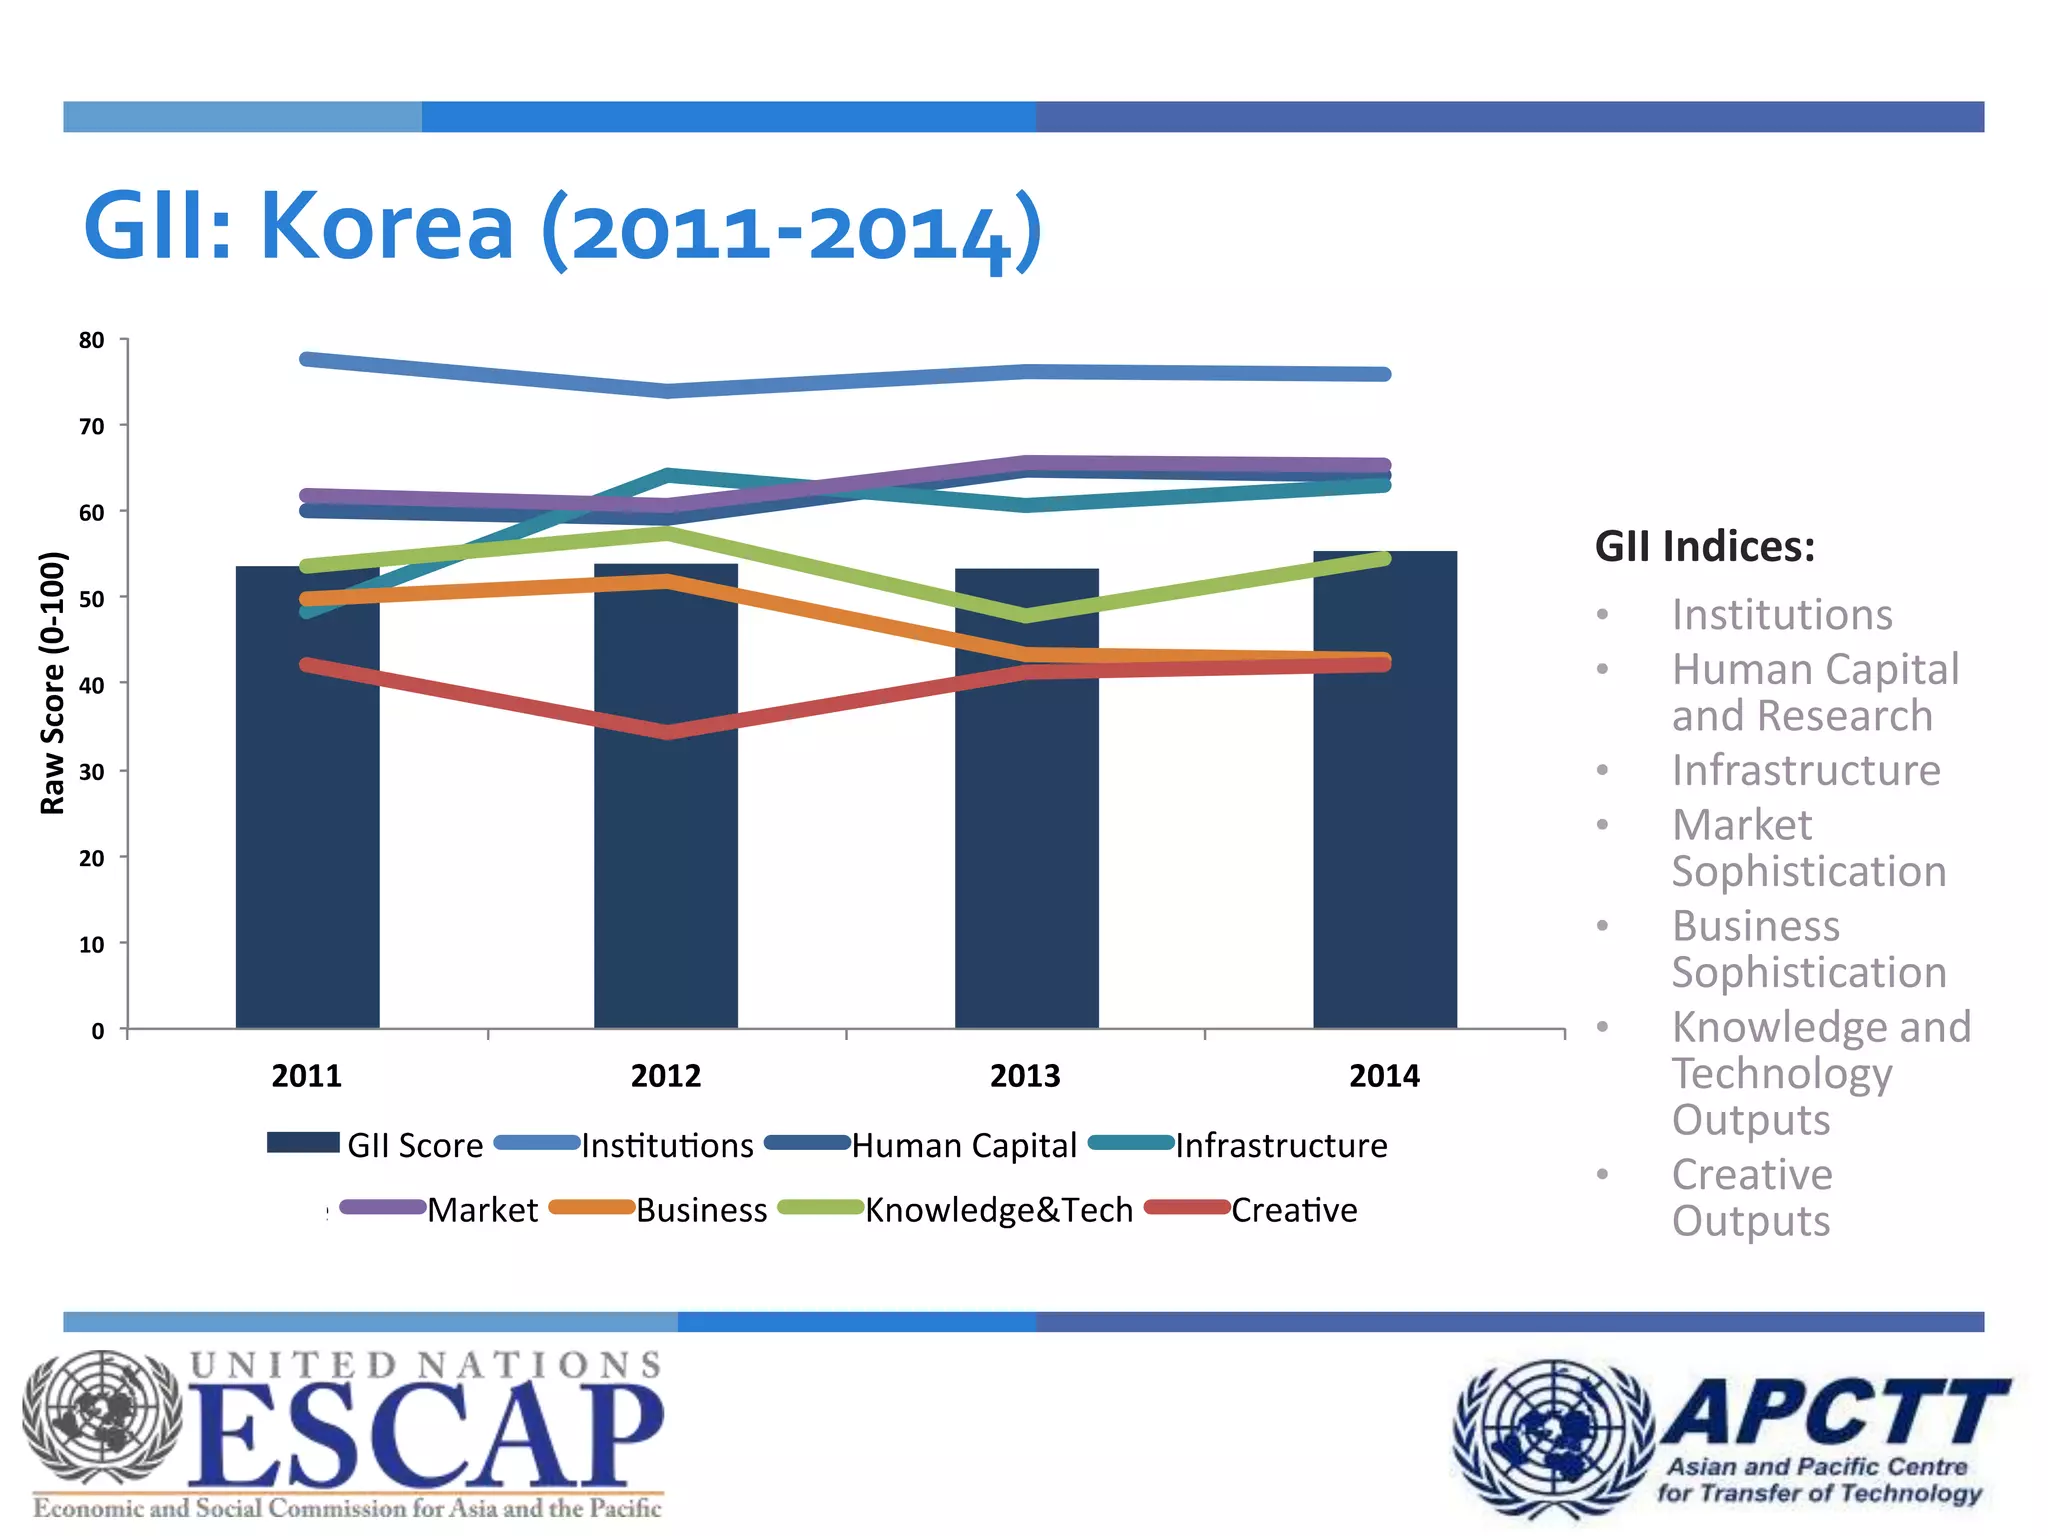
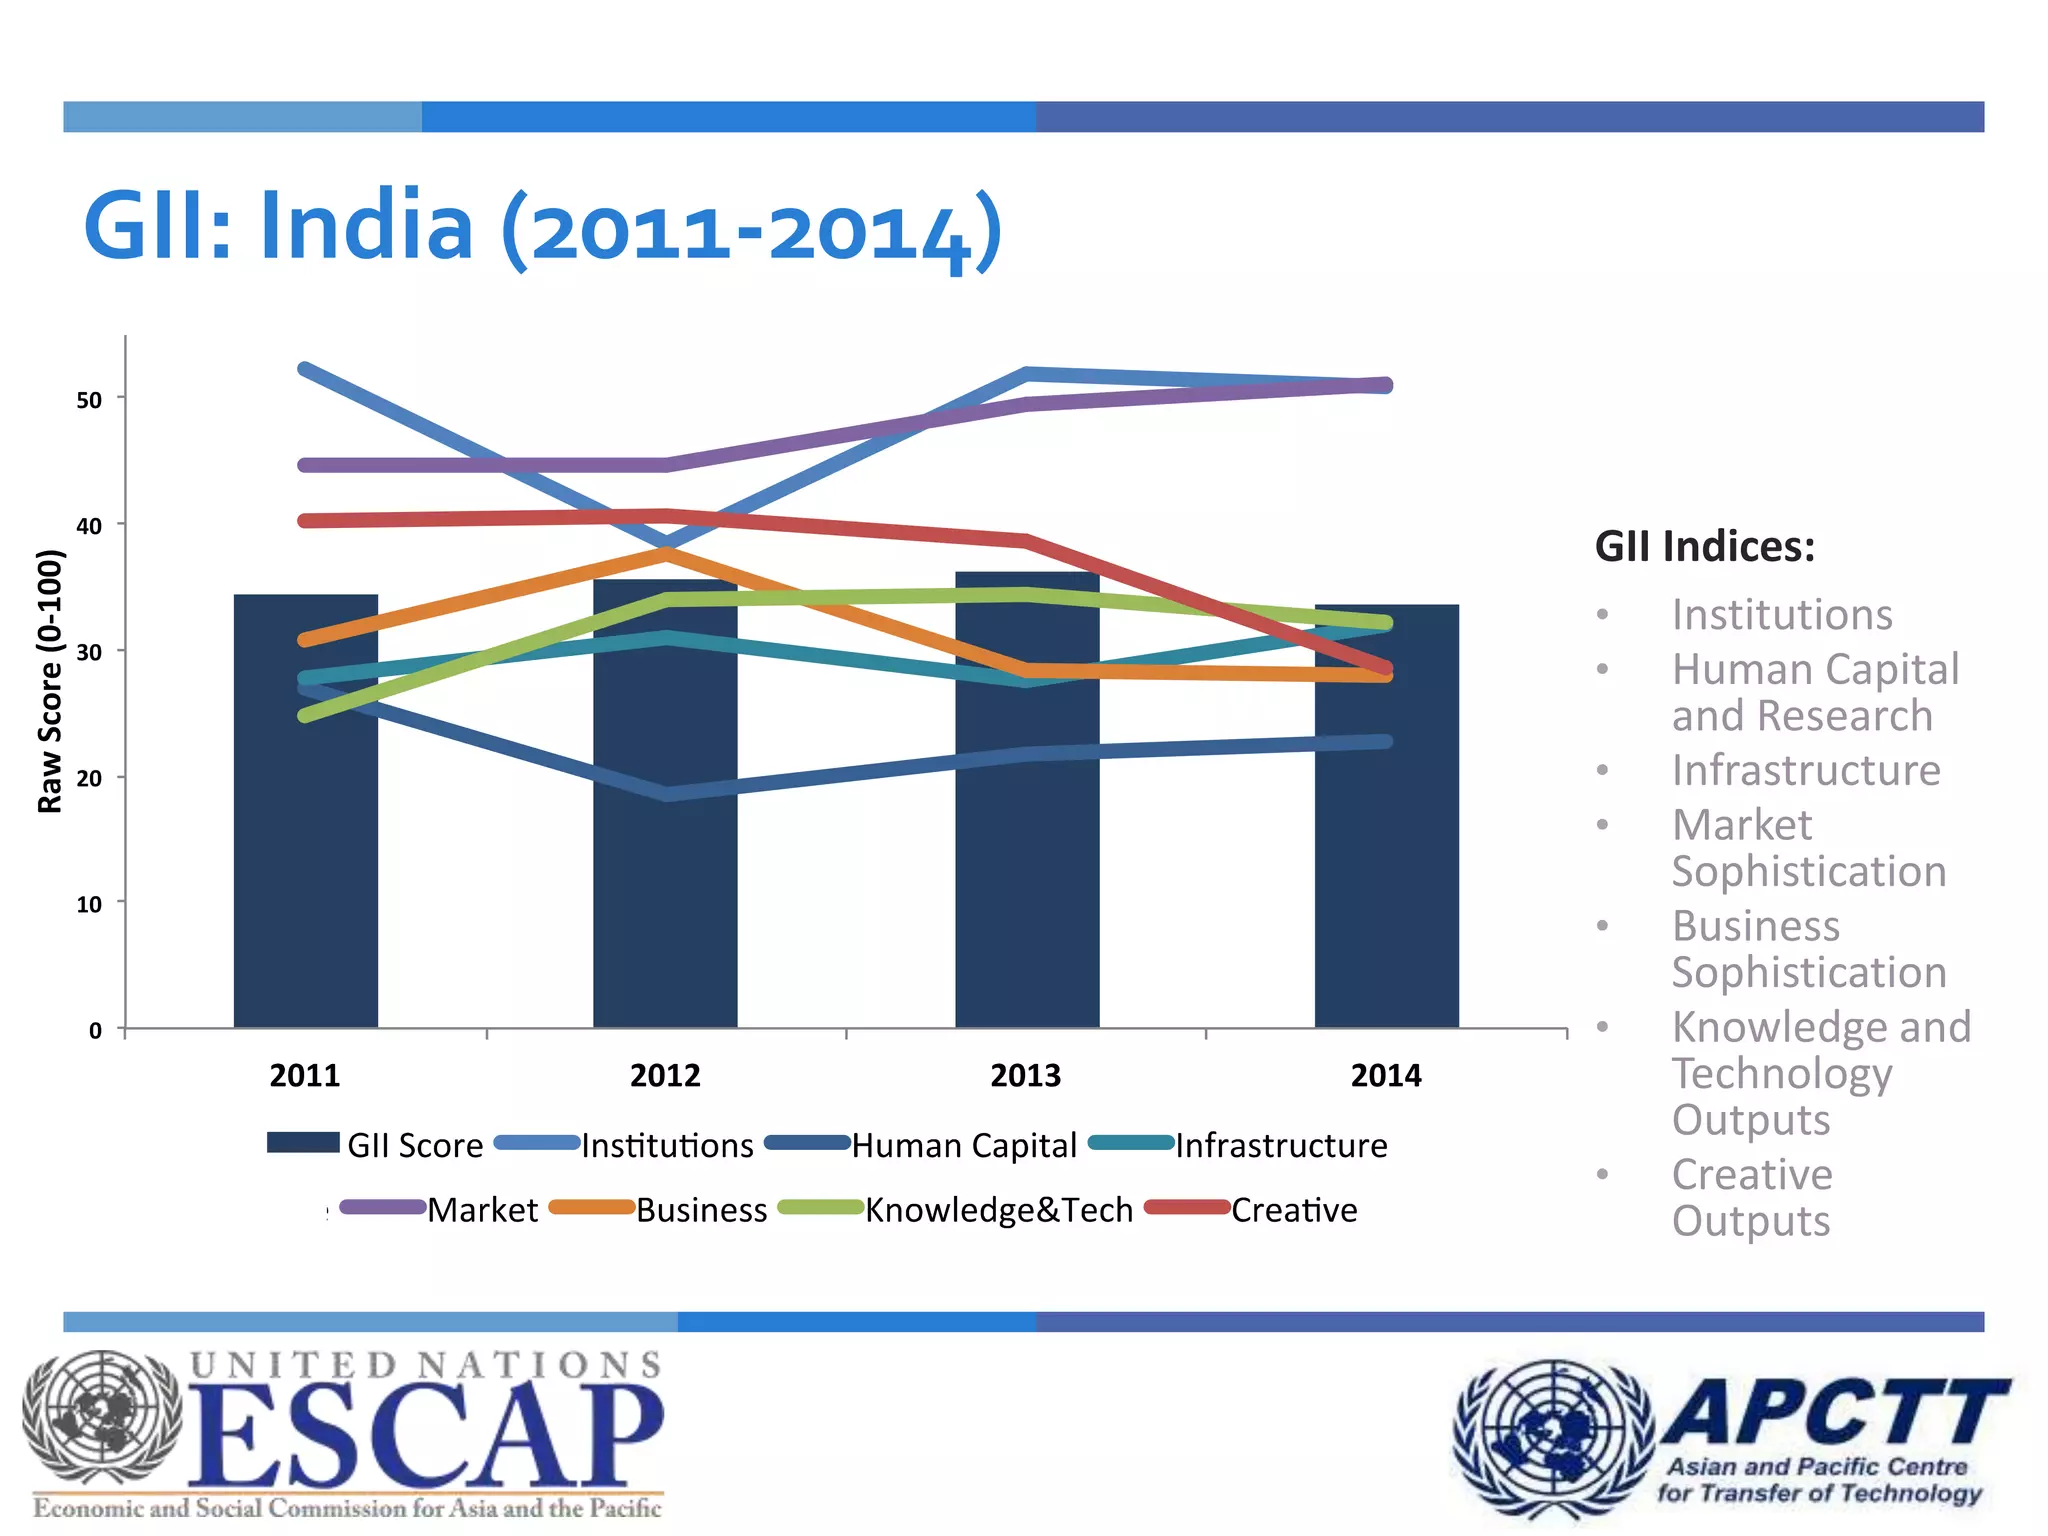
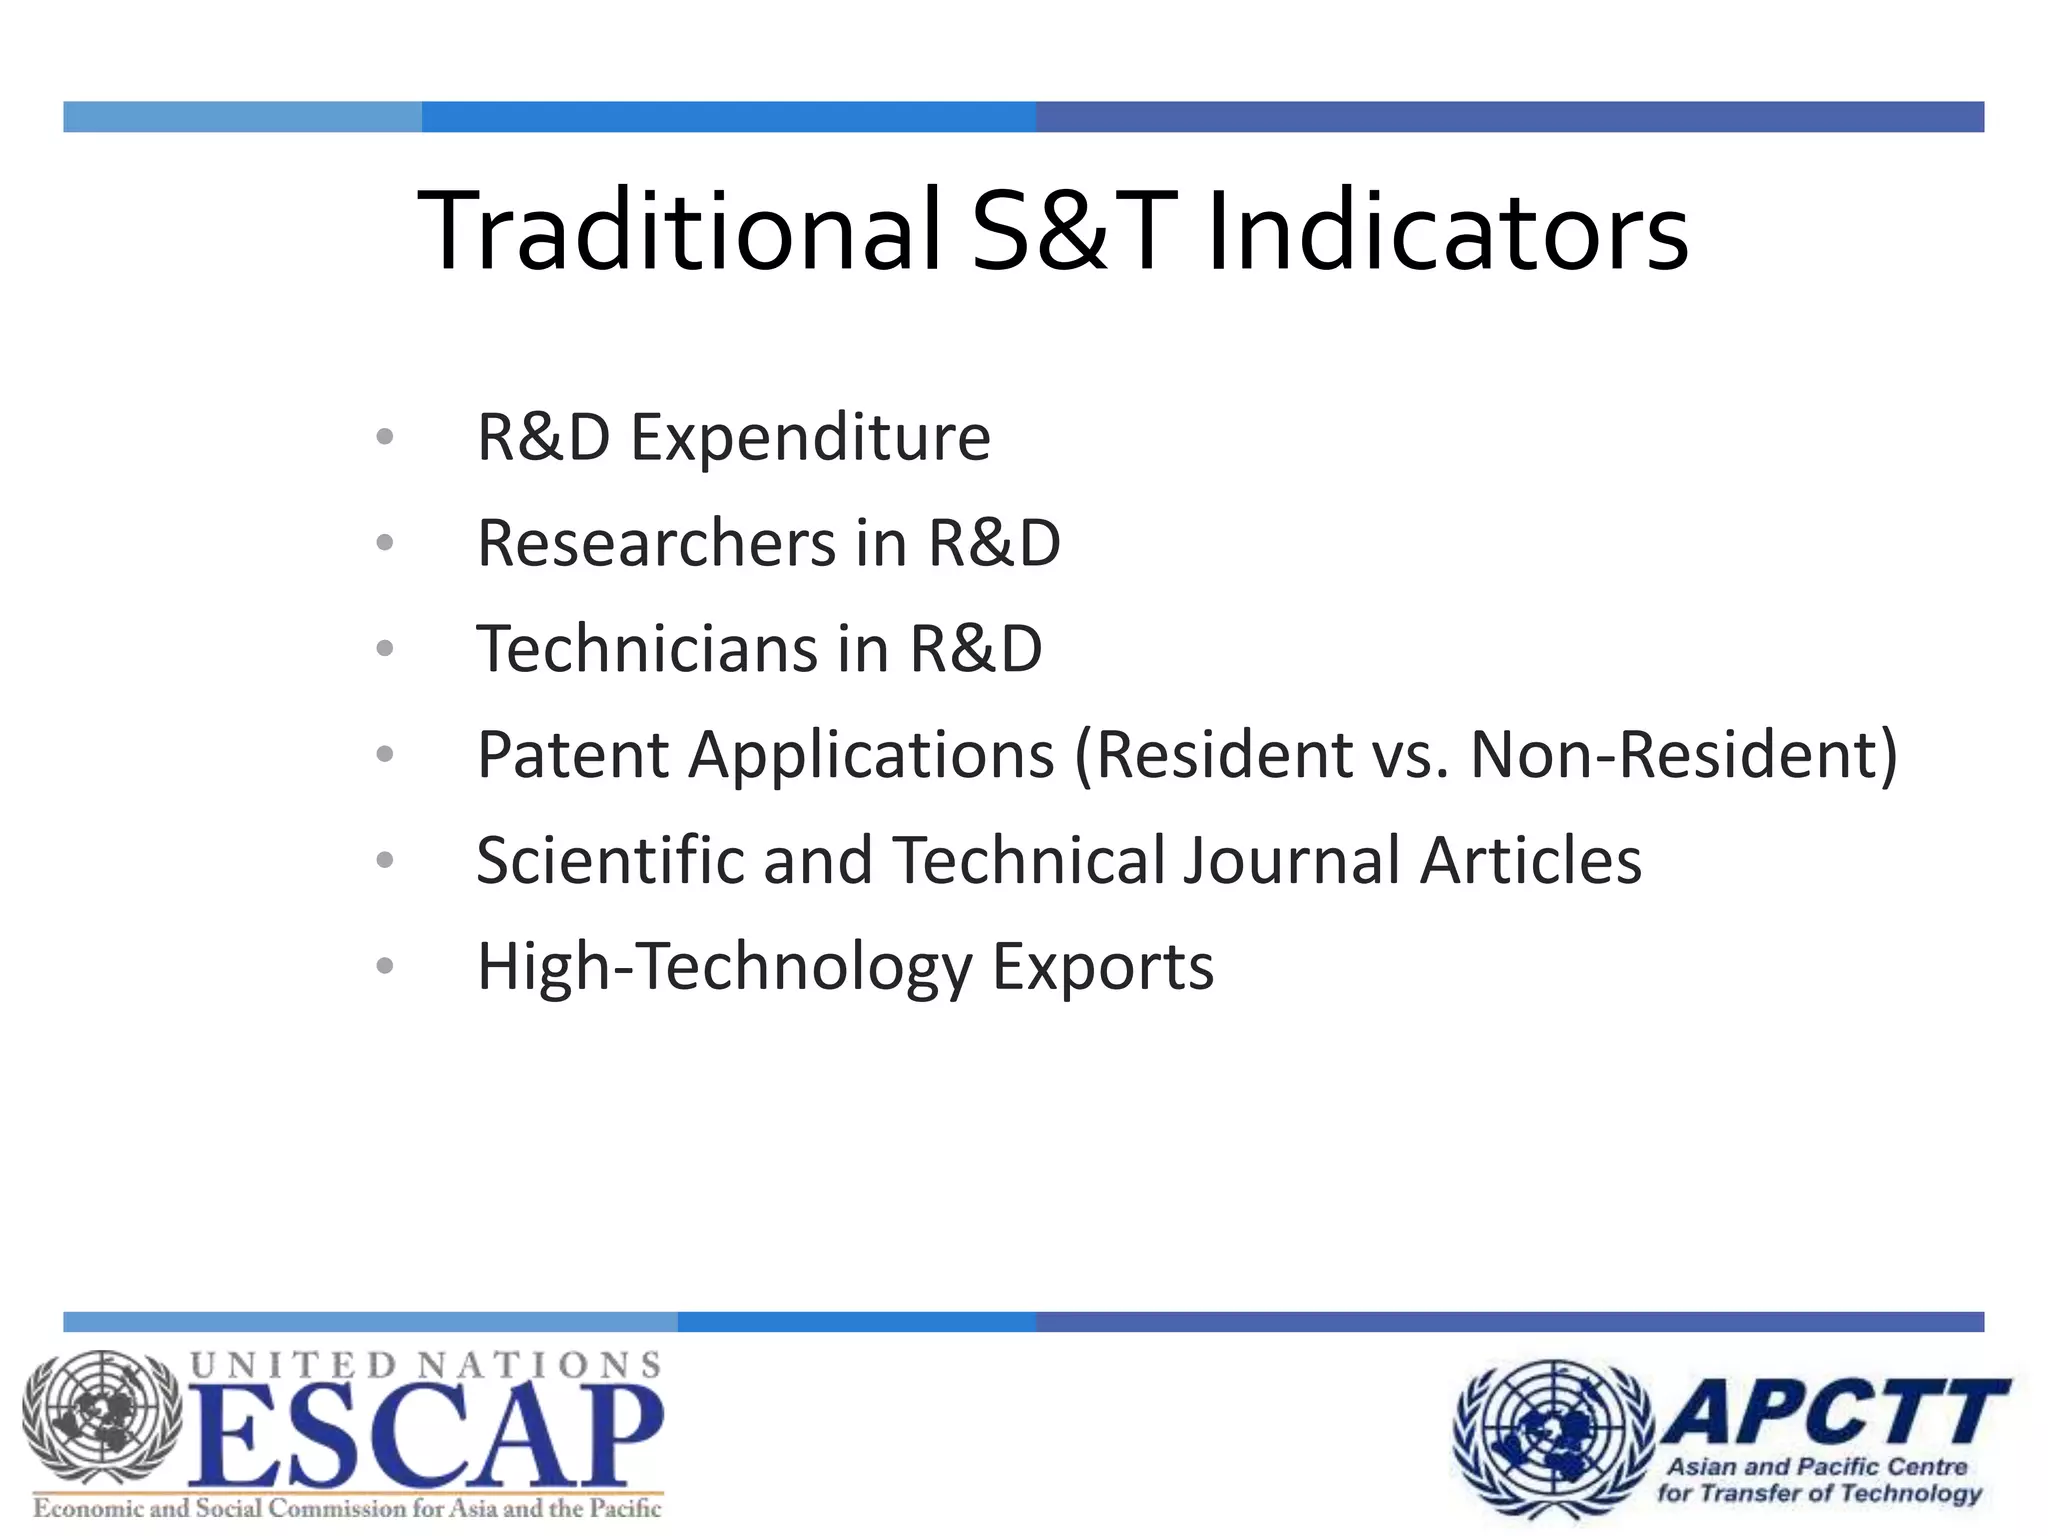
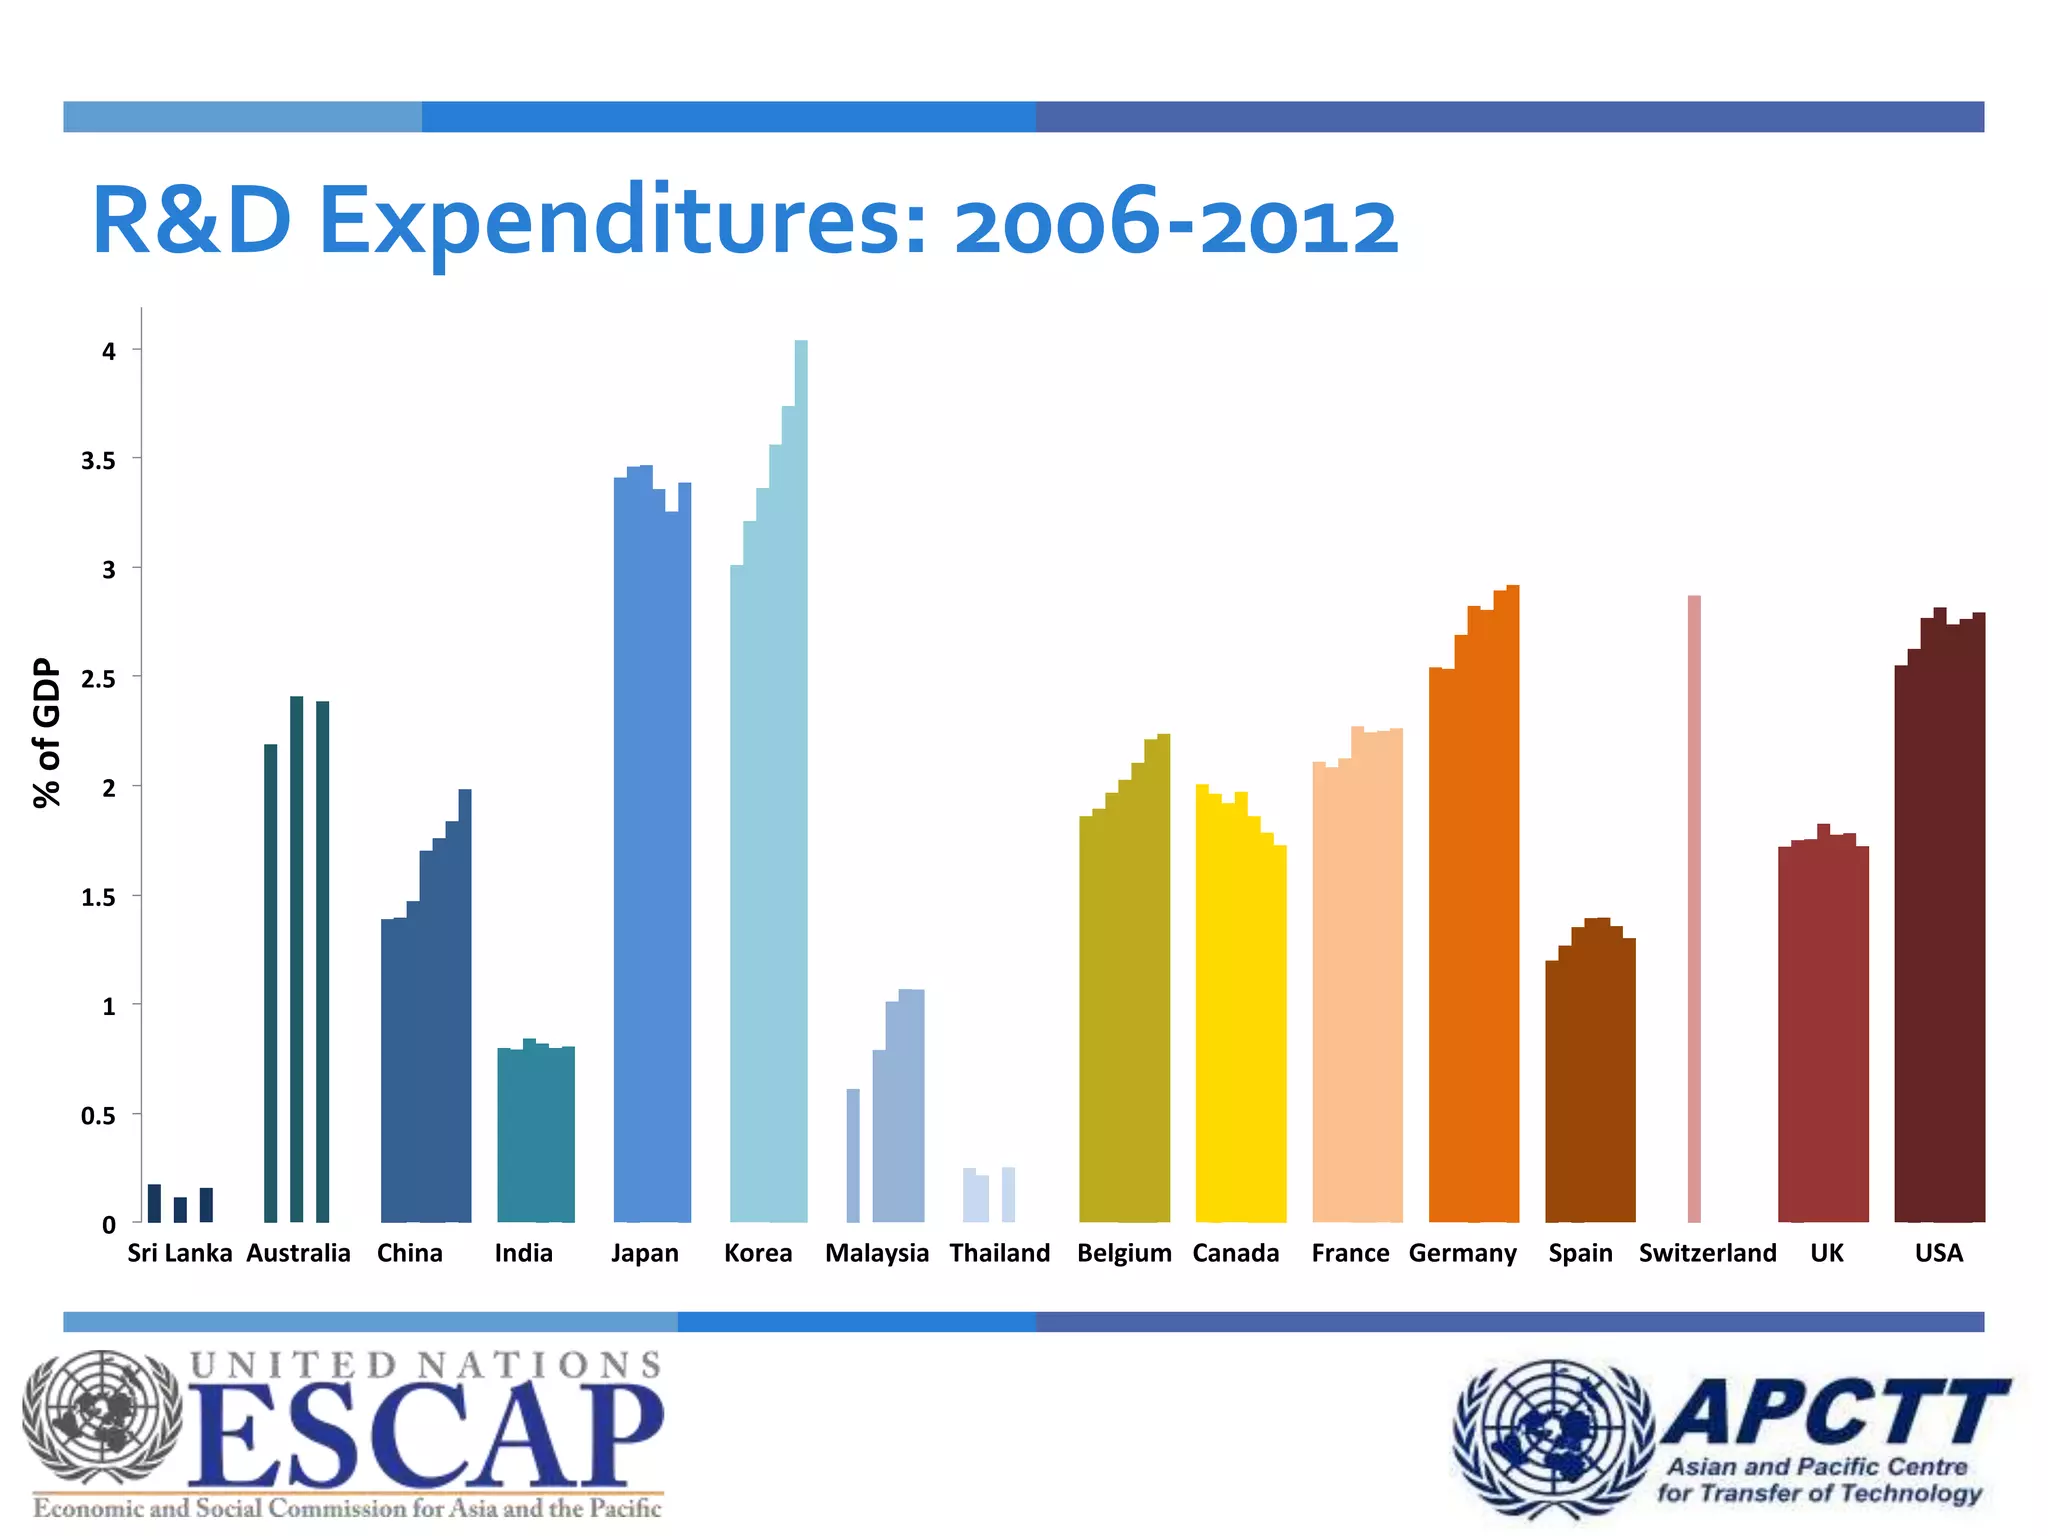
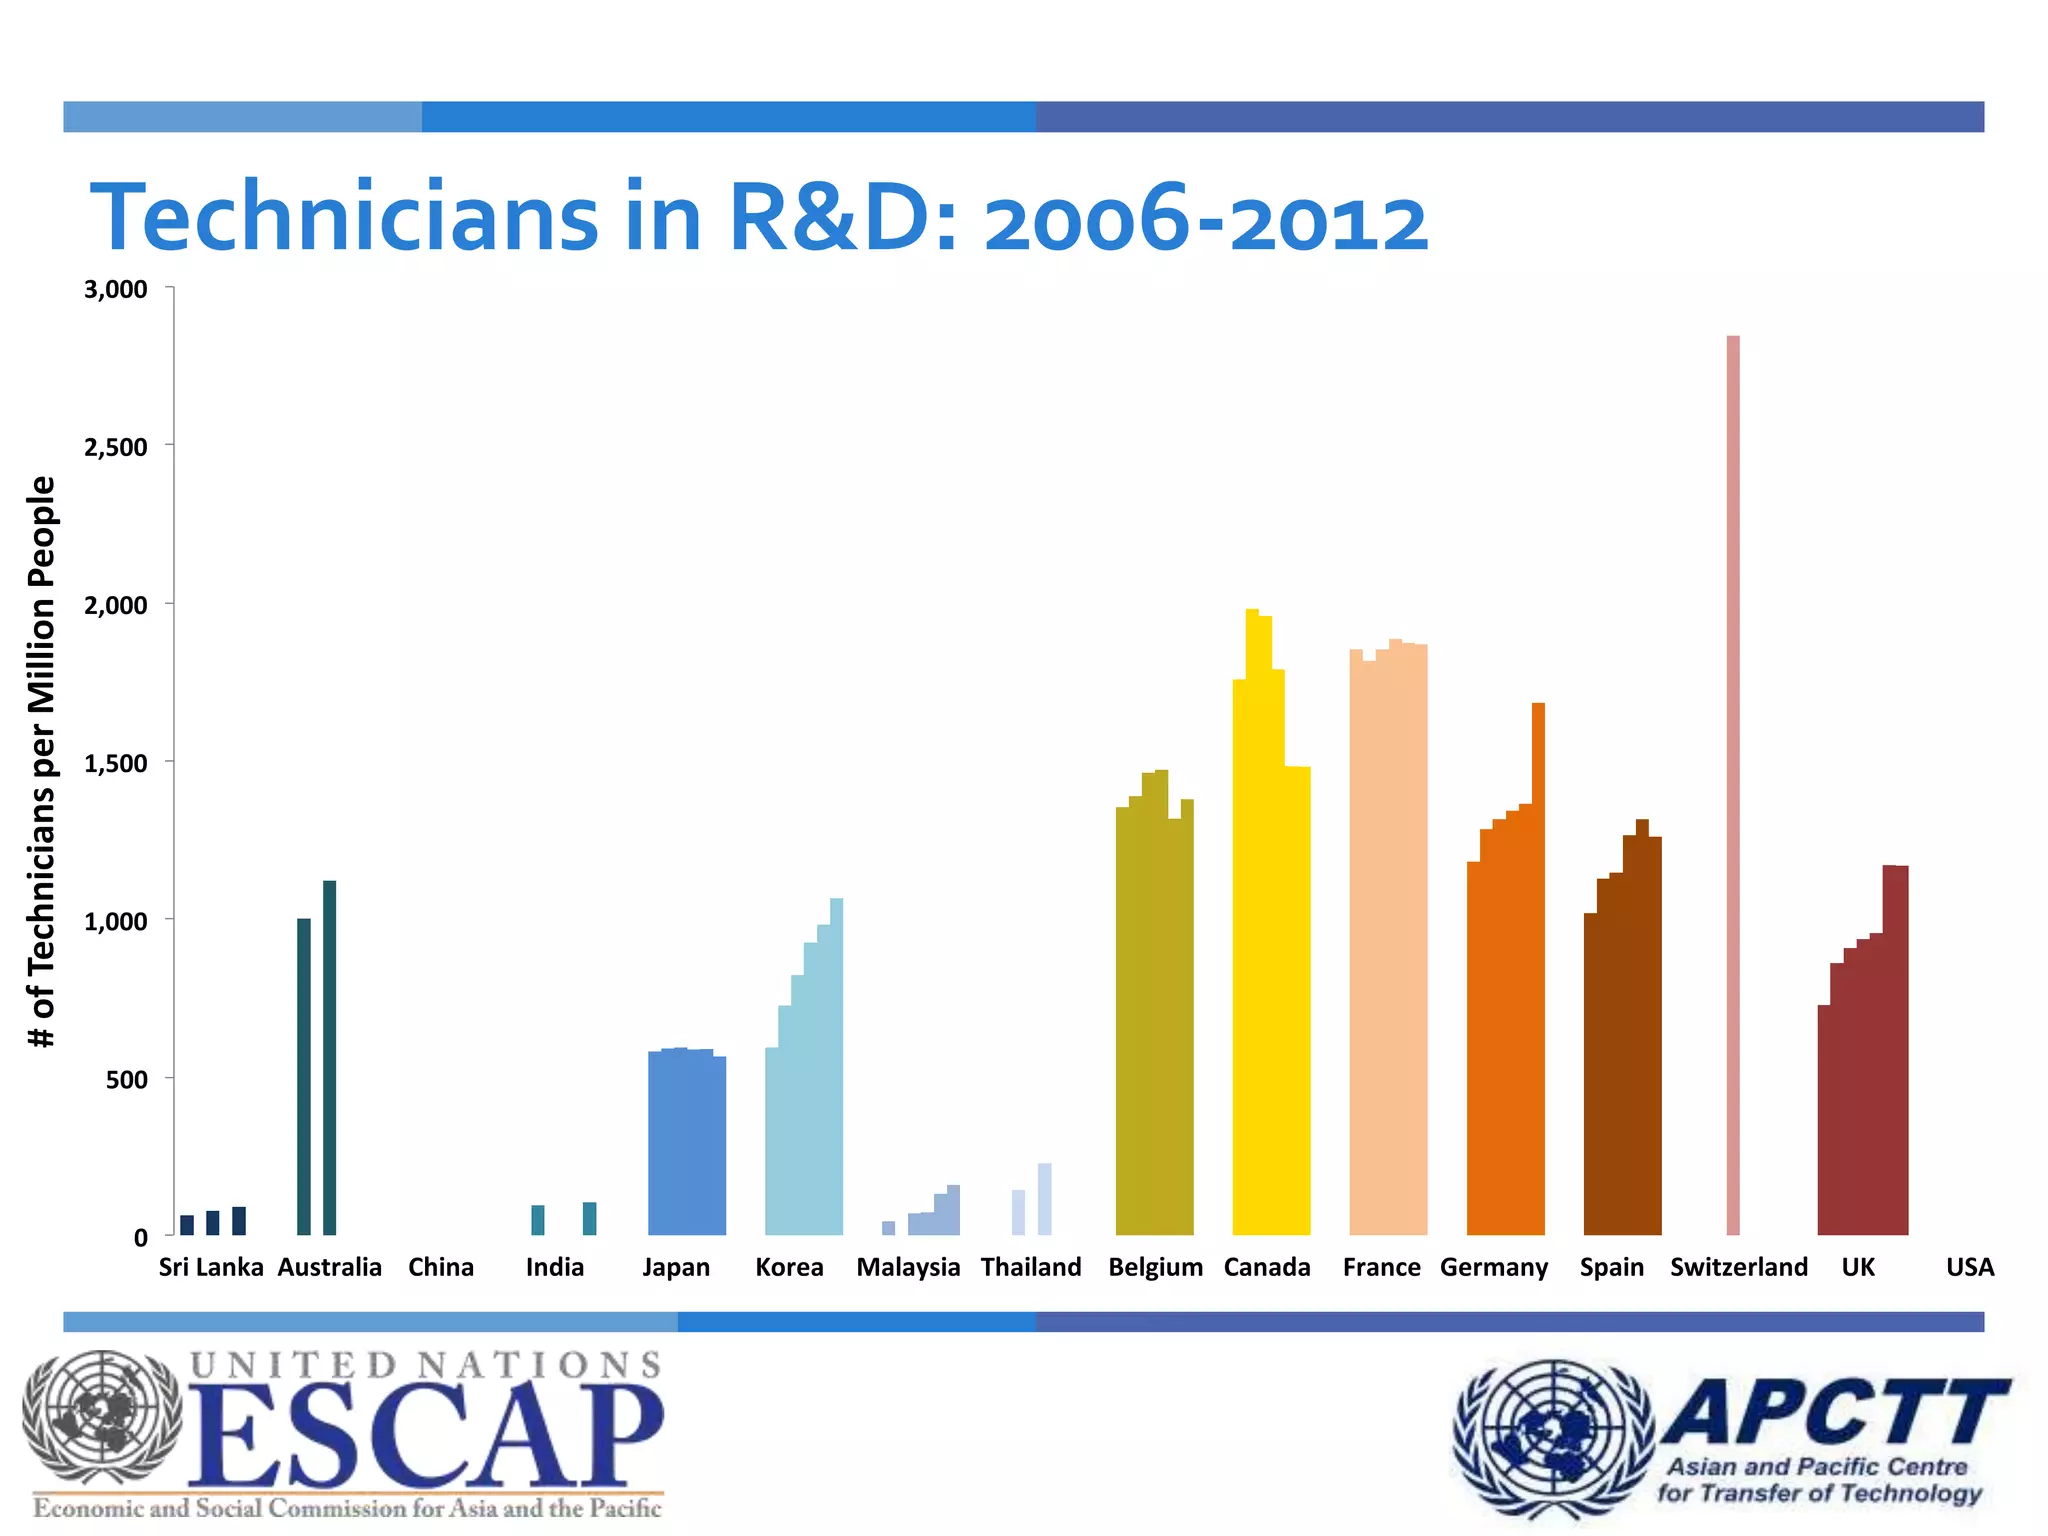
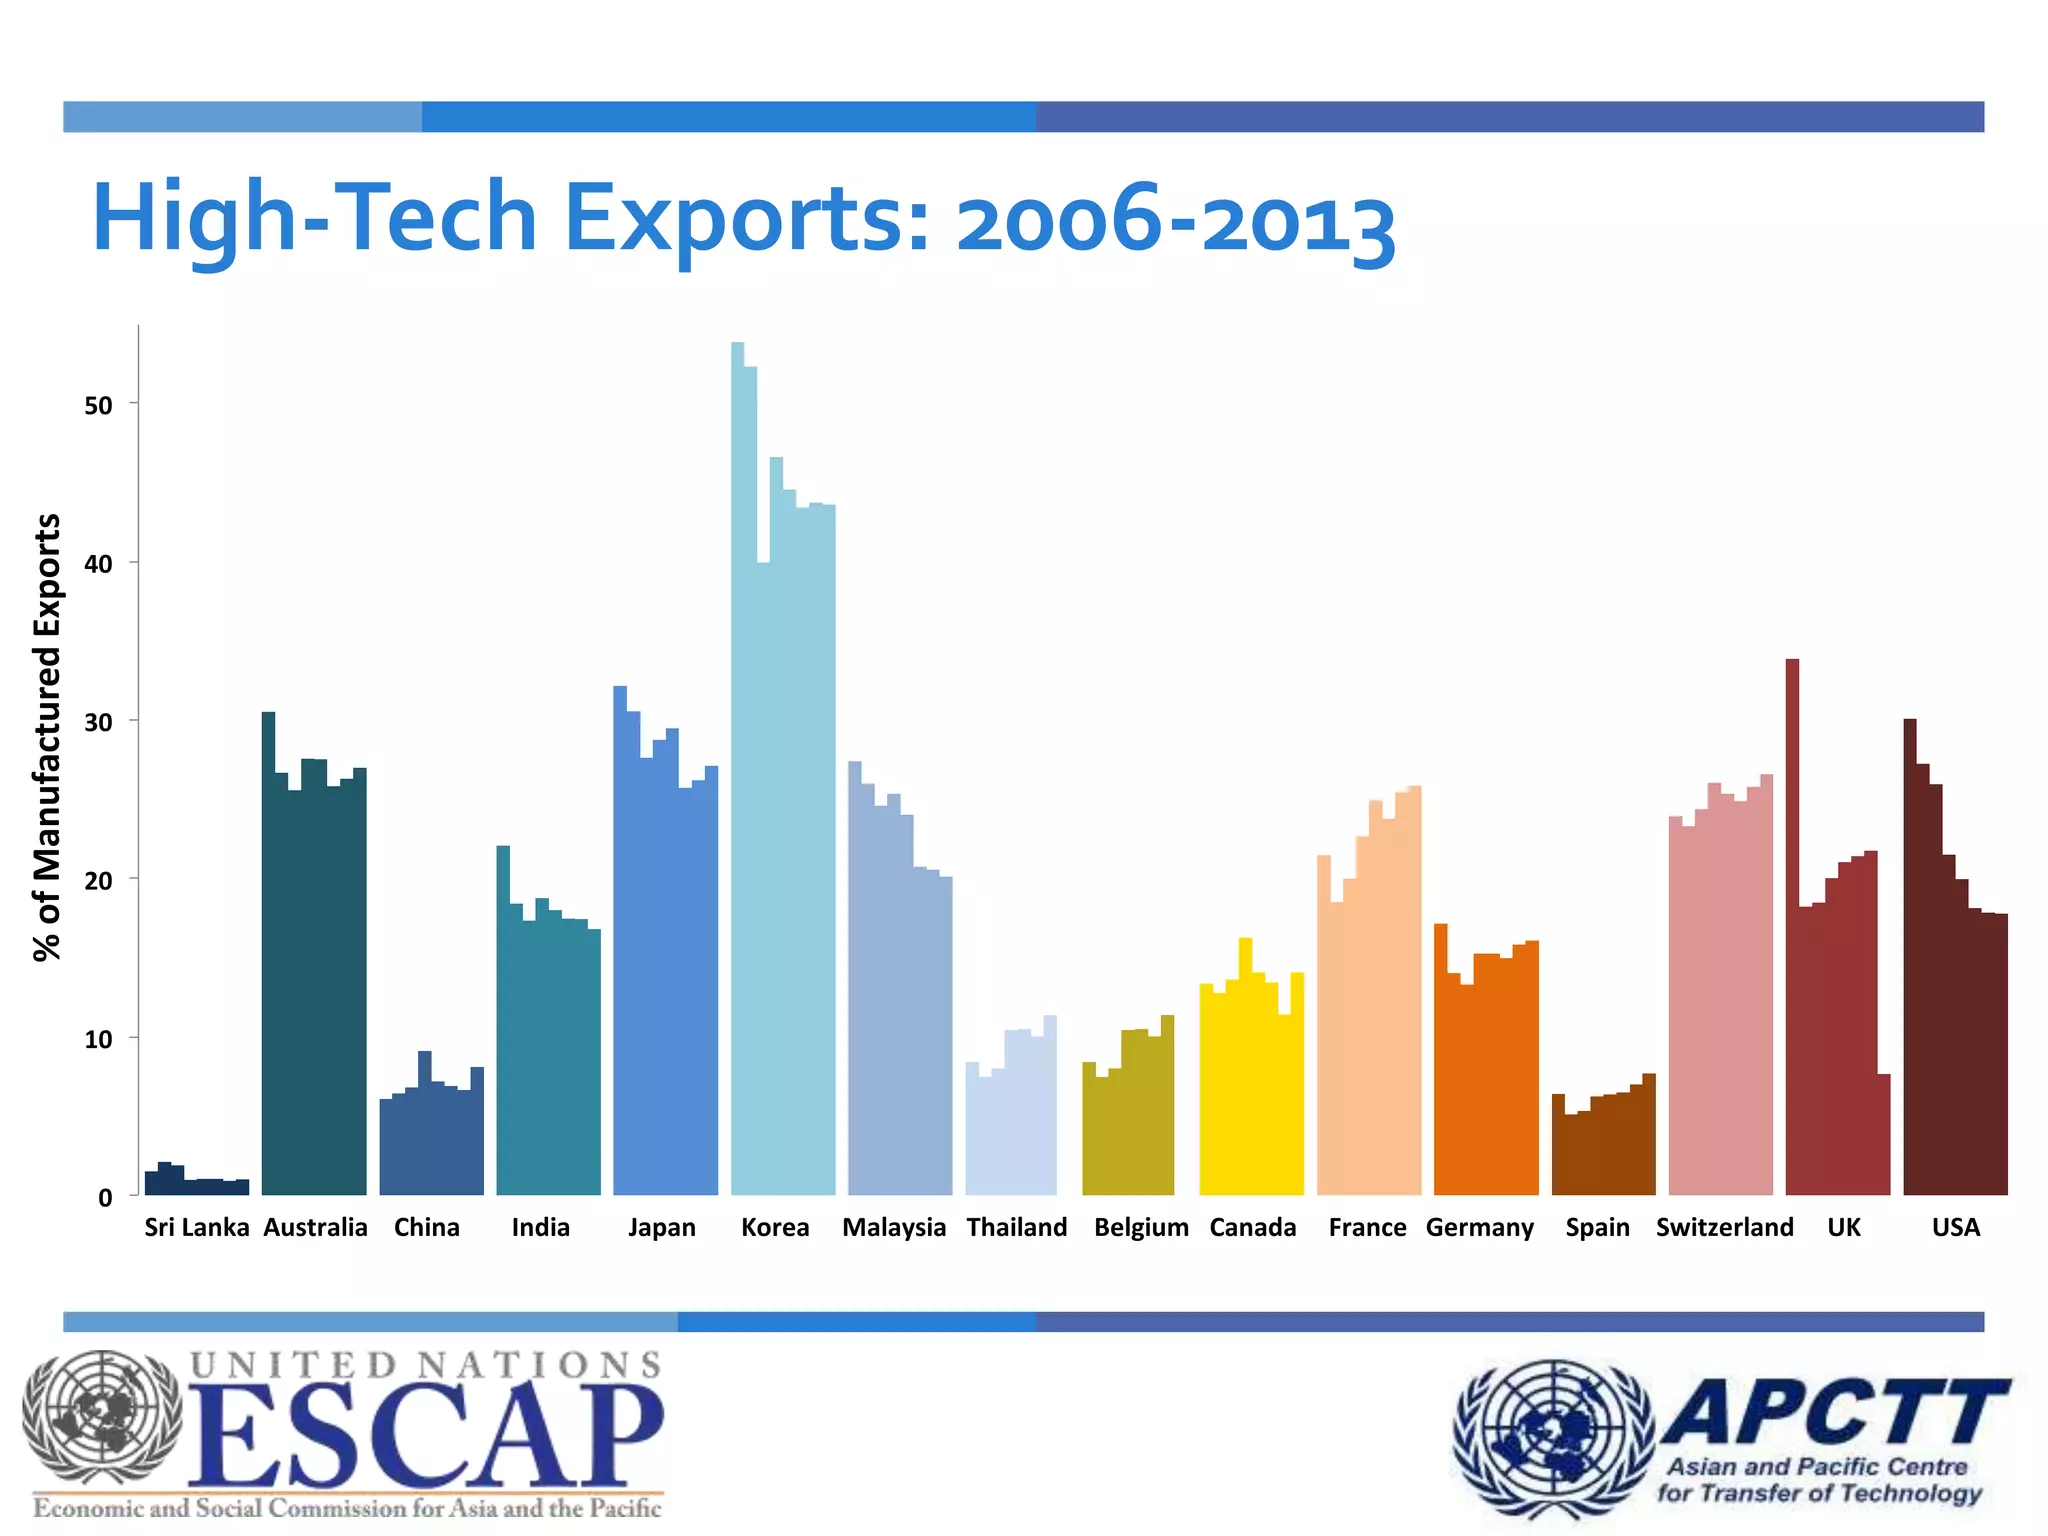
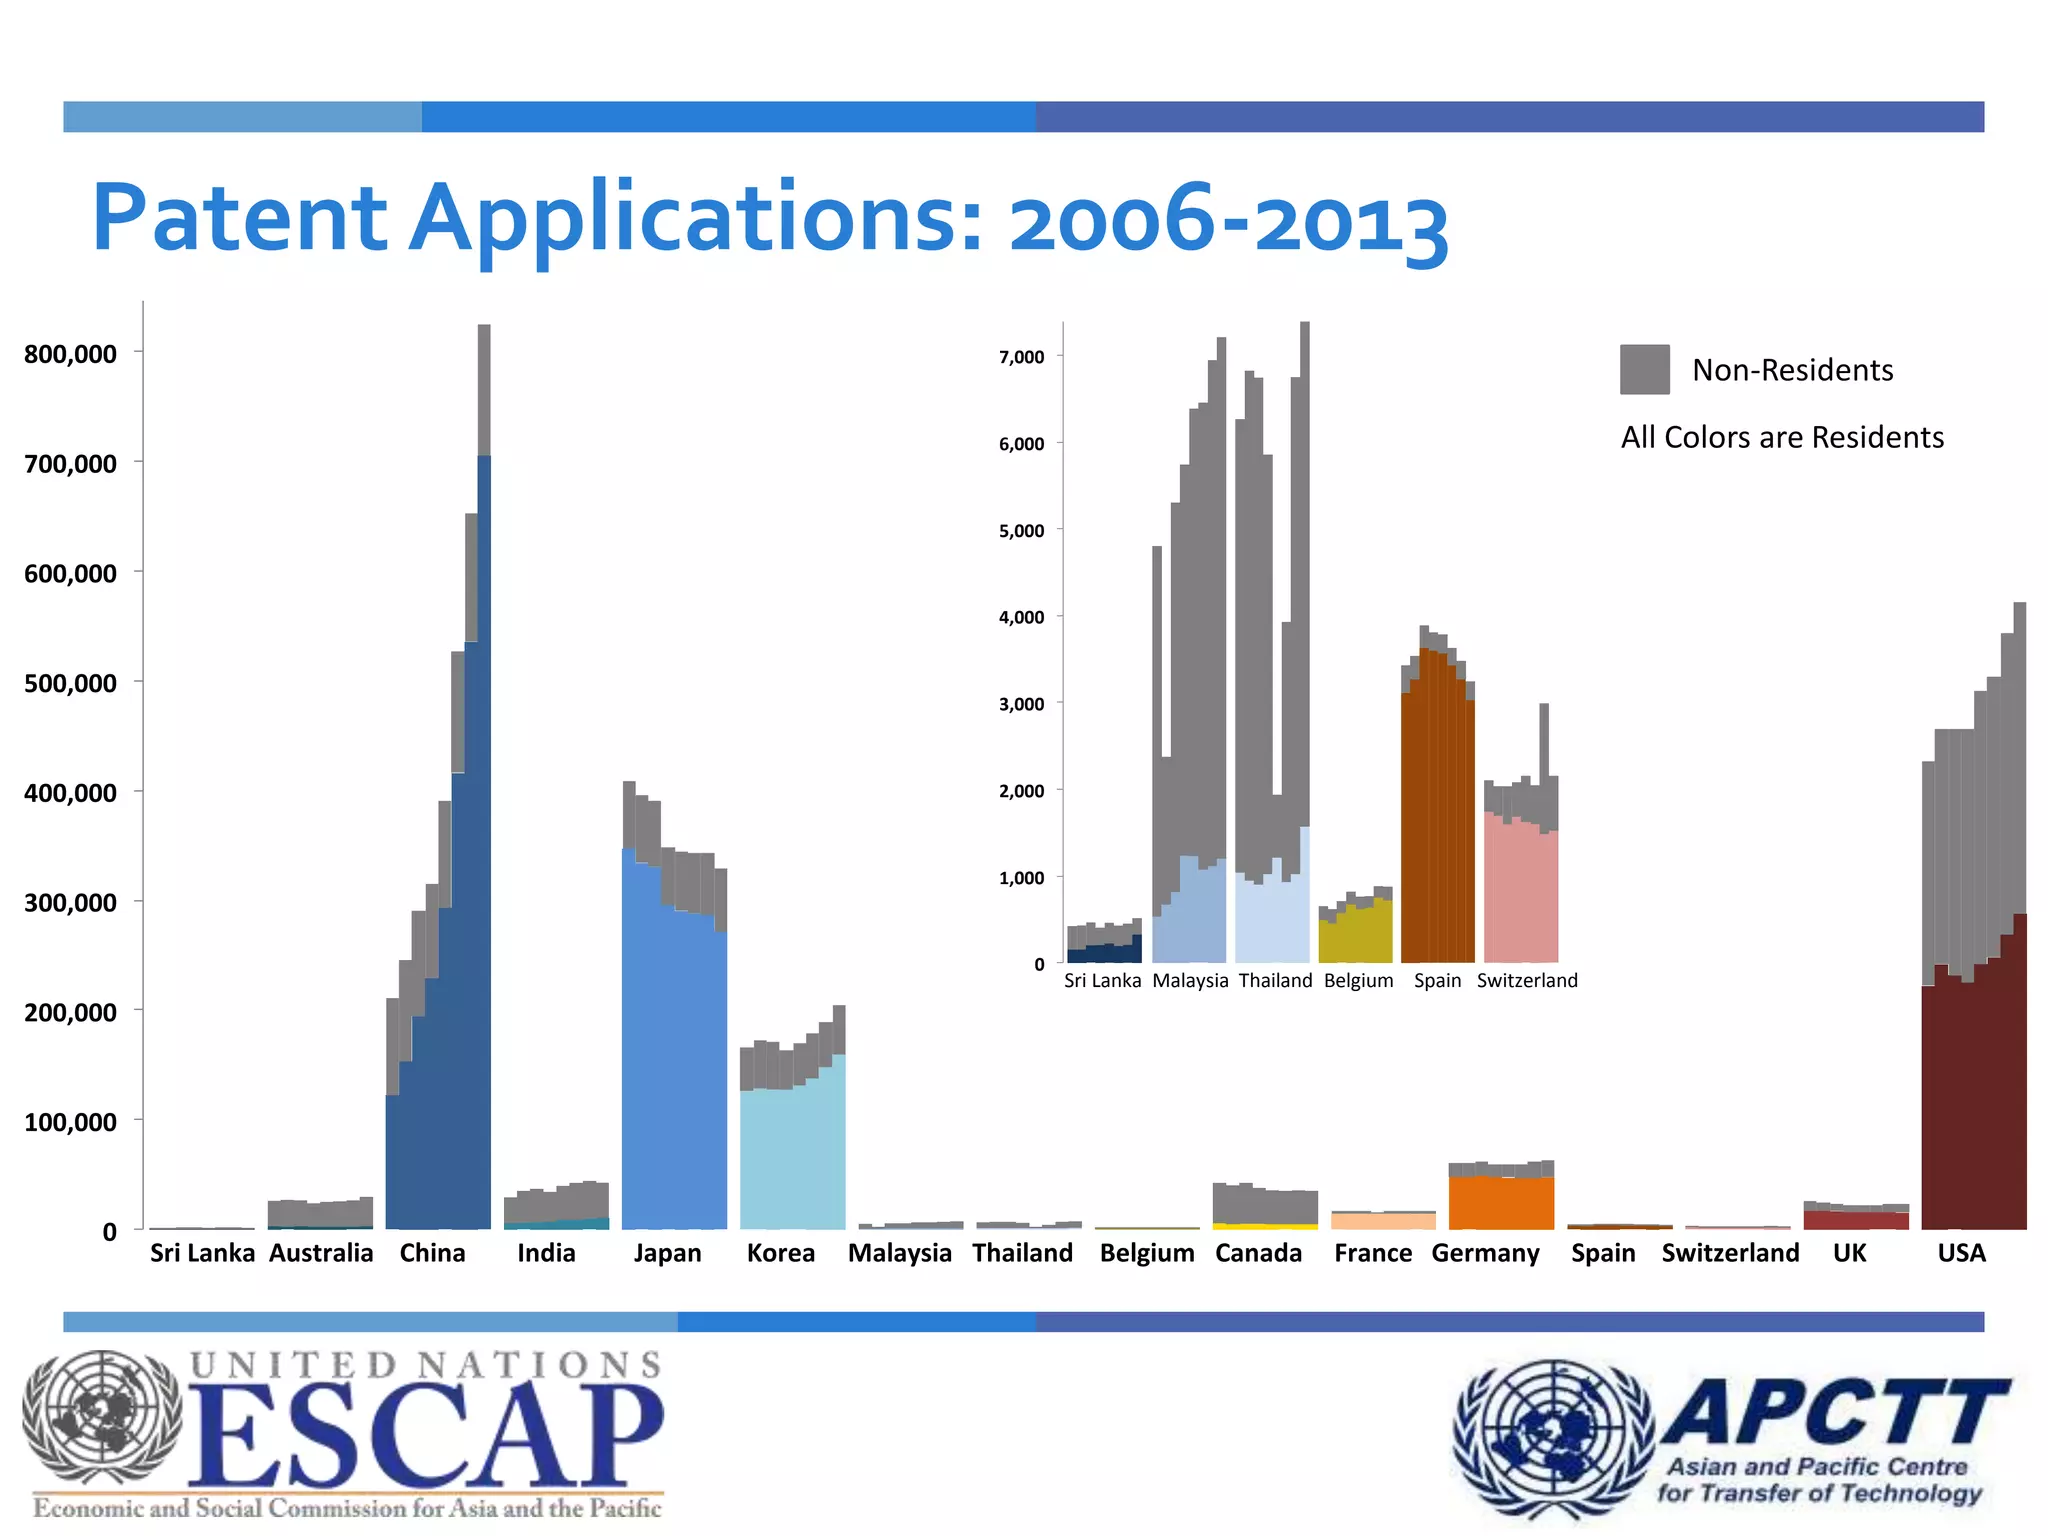
National Consultative Workshop
Strengthening and Road Mapping of Emerging Technology
Innovation Systems of Sri Lanka
17-19 November 2015  Colombo, Sri Lanka
Approaches and strategies for measuring Science,
Technology and Innovation (STI)
Mr. N. Srinivasan
Coordinator - Science, Technology, and Innovation
Asian and Pacific Centre for Transfer of Technology (APCTT) of the
United Nations Economic and Social Commission for Asia and the Pacific (UN ESCAP) in New Delhi, India
(Acknowledgement : Assistance in research and preparation of presentation by
Ms. Becky Byler, APCTT Intern, Yale School of Engineering and Applied Sciences, USA)
• Measuring STI
• Current STI indicators and databases
• Global Innovation Index (GII)
• GII of Sri Lanka, China, Republic of Korea and India
Presentation Overview
• Need for balanced, STI-based development using the three pillars of
sustainable development: economy, society, and the environment
• Adequate monitoring and evaluation are required for evidence-based
creation and governance of national STI policies
• Current S&T indicators were developed over a period of time
dominated by economics and business (e.g. GDP, FDI, GERD)
• Difficulties faced with measuring biotechnology due to lack of
standardized global methodologies (i.e. definition of “biotechnology”
and inconsistent data collection)
• As a new, convergent technology, sufficient indicators to measure
nanotechnology are both unavailable and not yet developed
Measuring STI
• Global Innovation Index
• Traditional S&T Indicators (World Bank, WIPO, UNCTAD,
UNESCO, UNESCAP Statistical Year Book)
• OECD Science Industry Scoreboard and Measurement of STI
Indicators
• Web of Science ISI Citation Index Database
• Many private companies and government agencies also
contribute to their specific country’s pooled STI database;
however, there exists the need to mainstream their
contribution to the global STI database (e.g. NSF, EY)
Current STI Indicators and Databases
Global Innovation Index (GII)
GII Indices
• Institutions
• Human Capital
and Research
• Infrastructure
• Market
Sophistication
• Business
Sophistication
• Knowledge and
Technology
Outputs
• Creative
Outputs
• Composite indicator that ranks countries
in terms of their enabling environment to
innovation and their innovation outputs
• Aims to go beyond traditional measures of
innovation (e.g. R&D expenses/patents)
• Currently analyzes 7 indices comprising of
81 qualitative and quantitative innovation
“input” and “output” indicators
• Annually surveys 143 countries
Global Innovation Index
0
10
20
30
40
50
60
70
2011 2012 2013 2014
GlobalInnovaonIndex(0-100)
Overall Na onal Innova on Capability (2011-2014)
Sri Lanka
Australia
China
India
Japan
Korea
Malaysia
Thailand
Belgium
Canada
France
Germany
Spain
Switzerland
United Kingdom
United States
2012 2013 2014
Germany
Spain
Switzerland
United Kingdom
United States
Median Score
2011 2012 2013 2014
Overall Na onal Innova on Capability (2011-2014)
Sri Lanka
Australia
China
India
Japan
Korea
Malaysia
Thailand
Belgium
Canada
France
Germany
Spain
Switzerland
United Kingdom
United States
Global Innovation Efficiency
-
0.20
0.40
0.60
0.80
1.00
1.20
2011 2012 2013 2014
InnovaonEfficiencyRaoofOutputs:Inputs(0-1)
Overall Na onal Innova on Effici ency (2011-2014)
Sri Lanka
Australia
China
India
Japan
Korea
Malaysia
Thailand
Belgium
Canada
France
Germany
Spain
Switzerland
United Kingdom
United States
2011 2012 2013 2014
Overall Na onal Innova on Capability (2011-2014)
Sri Lanka
Australia
China
India
Japan
Korea
Malaysia
Thailand
Belgium
Canada
France
Germany
Spain
Switzerland
United Kingdom
United States
2012 2013 2014
France
Germany
Spain
Switzerland
United Kingdom
United States
Median Score
GII: Sri Lanka (2011-2014)
GII Indices:
• Institutions
• Human Capital
and Research
• Infrastructure
• Market
Sophistication
• Business
Sophistication
• Knowledge and
Technology
Outputs
• Creative
Outputs
GII: China (2011-2014)
GII Indices:
• Institutions
• Human Capital
and Research
• Infrastructure
• Market
Sophistication
• Business
Sophistication
• Knowledge and
Technology
Outputs
• Creative
Outputs
GII: Korea (2011-2014)
GII Indices:
• Institutions
• Human Capital
and Research
• Infrastructure
• Market
Sophistication
• Business
Sophistication
• Knowledge and
Technology
Outputs
• Creative
Outputs
GII: India (2011-2014)
GII Indices:
• Institutions
• Human Capital
and Research
• Infrastructure
• Market
Sophistication
• Business
Sophistication
• Knowledge and
Technology
Outputs
• Creative
Outputs
Traditional S&T Indicators
• R&D Expenditure
• Researchers in R&D
• Technicians in R&D
• Patent Applications (Resident vs. Non-Resident)
• Scientific and Technical Journal Articles
• High-Technology Exports
R&D Expenditures: 2006-2012
Sri Lanka Australia China India Japan Korea Malaysia Thailand Belgium Canada France Germany Spain Switzerland UK USA
0
0.5
1
1.5
2
2.5
3
3.5
4
4.5
Sri LankaAustraliaChinaIndiaJapanKoreaMalaysiaThailandBelgiumCanadaFranceGermanySpain
Switzerlan
dUKUSA
%ofGDP
Sri Lanka Australia China India Japan Korea Malaysia Thailand Belgium Canada France Germany Spain Switzerland UK USA
Sri Lanka Malaysia Thailand Belgium Spain Switzerland
0
500
1,000
1,500
2,000
2,500
3,000
Sri LankaAustraliaChinaIndiaJapanKoreaMalaysiaThailandBelgiumCanadaFranceGermanySpain
Switzerlan
dUKUSA
Technicians in R&D: 2006-2012
#ofTechniciansperMillionPeople
High-Tech Exports: 2006-2013
Sri Lanka Australia China India Japan Korea Malaysia Thailand Belgium Canada France Germany Spain Switzerland UK USA
%ofManufacturedExports
0
10
20
30
40
50
60
Sri LankaAustraliaChinaIndiaJapanKoreaMalaysiaThailandBelgiumCanadaFranceGermanySpain
Switzerlan
dUKUSA
0
100,000
200,000
300,000
400,000
500,000
600,000
700,000
800,000
900,000
Sri LankaAustraliaChinaIndiaJapanKoreaMalaysiaThailandBelgiumCanadaFranceGermanySpain
Switzerlan
dUKUSA
Patent Applications: 2006-2013
Sri Lanka Australia China India Japan Korea Malaysia Thailand Belgium Canada France Germany Spain Switzerland UK USA
0
1,000
2,000
3,000
4,000
5,000
6,000
7,000
8,000
Sri LankaAustraliaChinaIndiaJapanKoreaMalaysiaThailandBelgiumCanadaFranceGermanySpain
Switzerlan
dUKUSA
0
1,000
2,000
3,000
4,000
5,000
6,000
7,000
8,000
Sri LankaAustraliaChinaIndiaJapanKoreaMalaysiaThailandBelgiumCanadaFranceGermanySpain
Switzerlan
dUKUSA
0
1,000
2,000
3,000
4,000
5,000
6,000
7,000
8,000
Sri LankaAustraliaChinaIndiaJapanKoreaMalaysiaThailandBelgiumCanadaFranceGermanySpain
Switzerlan
dUKUSA
Sri Lanka Malaysia Thailand Belgium Spain Switzerland
30%
70%
1
2
Non-Residents
All Colors are Residents
References
1. Global Innovation Index Reports (Accessed July 10, 2015)
http://www.globalinnovationindex.org
2. World Bank Science and Technology Indicators (Accessed July 8, 2015)
http://data.worldbank.org/indicator#topic-14
National Consultative Workshop
Strengthening and Road Mapping of EmergingTechnology
Innovation Systems of Sri Lanka
17-19 November 2015  Colombo, Sri Lanka
Thank you
Mr. N. Srinivasan
Coordinator, Science, Technology, and Innovation
Asian and Pacific Centre for Transfer of Technology (APCTT) of the
United Nations Economic and Social Commission for Asia and the Pacific (UN ESCAP) in New Delhi, India

Approaches and strategies for measuring STI Mr. Mr N Srinivasan

  • 1.
    National Consultative Workshop Strengtheningand Road Mapping of Emerging Technology Innovation Systems of Sri Lanka 17-19 November 2015  Colombo, Sri Lanka Approaches and strategies for measuring Science, Technology and Innovation (STI) Mr. N. Srinivasan Coordinator - Science, Technology, and Innovation Asian and Pacific Centre for Transfer of Technology (APCTT) of the United Nations Economic and Social Commission for Asia and the Pacific (UN ESCAP) in New Delhi, India (Acknowledgement : Assistance in research and preparation of presentation by Ms. Becky Byler, APCTT Intern, Yale School of Engineering and Applied Sciences, USA)
  • 2.
    • Measuring STI •Current STI indicators and databases • Global Innovation Index (GII) • GII of Sri Lanka, China, Republic of Korea and India Presentation Overview
  • 3.
    • Need forbalanced, STI-based development using the three pillars of sustainable development: economy, society, and the environment • Adequate monitoring and evaluation are required for evidence-based creation and governance of national STI policies • Current S&T indicators were developed over a period of time dominated by economics and business (e.g. GDP, FDI, GERD) • Difficulties faced with measuring biotechnology due to lack of standardized global methodologies (i.e. definition of “biotechnology” and inconsistent data collection) • As a new, convergent technology, sufficient indicators to measure nanotechnology are both unavailable and not yet developed Measuring STI
  • 4.
    • Global InnovationIndex • Traditional S&T Indicators (World Bank, WIPO, UNCTAD, UNESCO, UNESCAP Statistical Year Book) • OECD Science Industry Scoreboard and Measurement of STI Indicators • Web of Science ISI Citation Index Database • Many private companies and government agencies also contribute to their specific country’s pooled STI database; however, there exists the need to mainstream their contribution to the global STI database (e.g. NSF, EY) Current STI Indicators and Databases
  • 5.
    Global Innovation Index(GII) GII Indices • Institutions • Human Capital and Research • Infrastructure • Market Sophistication • Business Sophistication • Knowledge and Technology Outputs • Creative Outputs • Composite indicator that ranks countries in terms of their enabling environment to innovation and their innovation outputs • Aims to go beyond traditional measures of innovation (e.g. R&D expenses/patents) • Currently analyzes 7 indices comprising of 81 qualitative and quantitative innovation “input” and “output” indicators • Annually surveys 143 countries
  • 6.
    Global Innovation Index 0 10 20 30 40 50 60 70 20112012 2013 2014 GlobalInnovaonIndex(0-100) Overall Na onal Innova on Capability (2011-2014) Sri Lanka Australia China India Japan Korea Malaysia Thailand Belgium Canada France Germany Spain Switzerland United Kingdom United States 2012 2013 2014 Germany Spain Switzerland United Kingdom United States Median Score 2011 2012 2013 2014 Overall Na onal Innova on Capability (2011-2014) Sri Lanka Australia China India Japan Korea Malaysia Thailand Belgium Canada France Germany Spain Switzerland United Kingdom United States
  • 7.
    Global Innovation Efficiency - 0.20 0.40 0.60 0.80 1.00 1.20 20112012 2013 2014 InnovaonEfficiencyRaoofOutputs:Inputs(0-1) Overall Na onal Innova on Effici ency (2011-2014) Sri Lanka Australia China India Japan Korea Malaysia Thailand Belgium Canada France Germany Spain Switzerland United Kingdom United States 2011 2012 2013 2014 Overall Na onal Innova on Capability (2011-2014) Sri Lanka Australia China India Japan Korea Malaysia Thailand Belgium Canada France Germany Spain Switzerland United Kingdom United States 2012 2013 2014 France Germany Spain Switzerland United Kingdom United States Median Score
  • 8.
    GII: Sri Lanka(2011-2014) GII Indices: • Institutions • Human Capital and Research • Infrastructure • Market Sophistication • Business Sophistication • Knowledge and Technology Outputs • Creative Outputs
  • 9.
    GII: China (2011-2014) GIIIndices: • Institutions • Human Capital and Research • Infrastructure • Market Sophistication • Business Sophistication • Knowledge and Technology Outputs • Creative Outputs
  • 10.
    GII: Korea (2011-2014) GIIIndices: • Institutions • Human Capital and Research • Infrastructure • Market Sophistication • Business Sophistication • Knowledge and Technology Outputs • Creative Outputs
  • 11.
    GII: India (2011-2014) GIIIndices: • Institutions • Human Capital and Research • Infrastructure • Market Sophistication • Business Sophistication • Knowledge and Technology Outputs • Creative Outputs
  • 12.
    Traditional S&T Indicators •R&D Expenditure • Researchers in R&D • Technicians in R&D • Patent Applications (Resident vs. Non-Resident) • Scientific and Technical Journal Articles • High-Technology Exports
  • 13.
    R&D Expenditures: 2006-2012 SriLanka Australia China India Japan Korea Malaysia Thailand Belgium Canada France Germany Spain Switzerland UK USA 0 0.5 1 1.5 2 2.5 3 3.5 4 4.5 Sri LankaAustraliaChinaIndiaJapanKoreaMalaysiaThailandBelgiumCanadaFranceGermanySpain Switzerlan dUKUSA %ofGDP
  • 14.
    Sri Lanka AustraliaChina India Japan Korea Malaysia Thailand Belgium Canada France Germany Spain Switzerland UK USA Sri Lanka Malaysia Thailand Belgium Spain Switzerland 0 500 1,000 1,500 2,000 2,500 3,000 Sri LankaAustraliaChinaIndiaJapanKoreaMalaysiaThailandBelgiumCanadaFranceGermanySpain Switzerlan dUKUSA Technicians in R&D: 2006-2012 #ofTechniciansperMillionPeople
  • 15.
    High-Tech Exports: 2006-2013 SriLanka Australia China India Japan Korea Malaysia Thailand Belgium Canada France Germany Spain Switzerland UK USA %ofManufacturedExports 0 10 20 30 40 50 60 Sri LankaAustraliaChinaIndiaJapanKoreaMalaysiaThailandBelgiumCanadaFranceGermanySpain Switzerlan dUKUSA
  • 16.
    0 100,000 200,000 300,000 400,000 500,000 600,000 700,000 800,000 900,000 Sri LankaAustraliaChinaIndiaJapanKoreaMalaysiaThailandBelgiumCanadaFranceGermanySpain Switzerlan dUKUSA Patent Applications:2006-2013 Sri Lanka Australia China India Japan Korea Malaysia Thailand Belgium Canada France Germany Spain Switzerland UK USA 0 1,000 2,000 3,000 4,000 5,000 6,000 7,000 8,000 Sri LankaAustraliaChinaIndiaJapanKoreaMalaysiaThailandBelgiumCanadaFranceGermanySpain Switzerlan dUKUSA 0 1,000 2,000 3,000 4,000 5,000 6,000 7,000 8,000 Sri LankaAustraliaChinaIndiaJapanKoreaMalaysiaThailandBelgiumCanadaFranceGermanySpain Switzerlan dUKUSA 0 1,000 2,000 3,000 4,000 5,000 6,000 7,000 8,000 Sri LankaAustraliaChinaIndiaJapanKoreaMalaysiaThailandBelgiumCanadaFranceGermanySpain Switzerlan dUKUSA Sri Lanka Malaysia Thailand Belgium Spain Switzerland 30% 70% 1 2 Non-Residents All Colors are Residents
  • 17.
    References 1. Global InnovationIndex Reports (Accessed July 10, 2015) http://www.globalinnovationindex.org 2. World Bank Science and Technology Indicators (Accessed July 8, 2015) http://data.worldbank.org/indicator#topic-14
  • 18.
    National Consultative Workshop Strengtheningand Road Mapping of EmergingTechnology Innovation Systems of Sri Lanka 17-19 November 2015  Colombo, Sri Lanka Thank you Mr. N. Srinivasan Coordinator, Science, Technology, and Innovation Asian and Pacific Centre for Transfer of Technology (APCTT) of the United Nations Economic and Social Commission for Asia and the Pacific (UN ESCAP) in New Delhi, India