SlideShare a Scribd company logo
DEVELOPING RESEARCH AND PRACTICE
Application of statistical process control in healthcare
improvement: systematic review
Johan Thor, Jonas Lundberg, Jakob Ask, Jesper Olsson, Cheryl Carli, Karin Pukk Härenstam, Mats
Brommels
. . . . . . . . . . . . . . . . . . . . . . . . . . . . . . . . . . . . . . . . . . . . . . . . . . . . . . . . . . . . . . . . . . . . . . . . . . . . . . . . . . . . . . . . . . . . . . . . . . . . . . . . . . . . . . . . . . . . . . . . . . . . . . . . . . .
See end of article for
authors’ affiliations
. . . . . . . . . . . . . . . . . . . . . . . .
Correspondence to:
Dr Johan Thor, Medical
Management Centre,
Berzelius väg 3, 5th floor,
Karolinska Institutet, S-171
77 Stockholm, Sweden;
johan.thor@ki.se
Accepted 18 March 2007
. . . . . . . . . . . . . . . . . . . . . . . .
Qual Saf Health Care 2007;16:387–399. doi: 10.1136/qshc.2006.022194
Objective: To systematically review the literature regarding how statistical process control—with control
charts as a core tool—has been applied to healthcare quality improvement, and to examine the benefits,
limitations, barriers and facilitating factors related to such application.
Data sources: Original articles found in relevant databases, including Web of Science and Medline, covering
the period 1966 to June 2004.
Study selection: From 311 articles, 57 empirical studies, published between 1990 and 2004, met the
inclusion criteria.
Methods: A standardised data abstraction form was used for extracting data relevant to the review questions,
and the data were analysed thematically.
Results: Statistical process control was applied in a wide range of settings and specialties, at diverse levels of
organisation and directly by patients, using 97 different variables. The review revealed 12 categories of
benefits, 6 categories of limitations, 10 categories of barriers, and 23 factors that facilitate its application and
all are fully referenced in this report. Statistical process control helped different actors manage change and
improve healthcare processes. It also enabled patients with, for example asthma or diabetes mellitus, to
manage their own health, and thus has therapeutic qualities. Its power hinges on correct and smart
application, which is not necessarily a trivial task. This review catalogues 11 approaches to such smart
application, including risk adjustment and data stratification.
Conclusion: Statistical process control is a versatile tool which can help diverse stakeholders to manage
change in healthcare and improve patients’ health.
Q
uality improvement (QI) practices represent a leading
approach to the essential, and often challenging, task of
managing organisational change.1
Statistical process
control (SPC) is, in turn, a key approach to QI.2
SPC was
developed in the 1920s by the physicist Walter Shewhart to
improve industrial manufacturing. It migrated to healthcare,
first in laboratory settings (eg, Fisher and Humphries3
) and
then into direct patient care applications, along with other
approaches to QI. Before we report on our systematic review of
the literature on how SPC has been applied to QI in healthcare,
there is a need to define SPC and its role in QI.
‘‘Statistical process control (SPC) is a philosophy, a strategy,
and a set of methods for ongoing improvement of systems,
processes, and outcomes. The SPC approach is based on
learning through data and has its foundation in the theory of
variation (understanding common and special causes). The
SPC strategy incorporates the concepts of an analytic study,
process thinking, prevention, stratification, stability, cap-
ability, and prediction. SPC incorporates measurement, data
collection methods, and planned experimentation. Graphical
methods, such as Shewhart charts (more commonly called
‘control charts’), run charts, frequency plots, histograms,
Pareto analysis, scatter diagrams, and flow diagrams are the
primary tools used in SPC.’’ (Carey4
, p xviii)
The terms ‘‘statistical process control’’ and ‘‘statistical quality
control’’ are often used interchangeably,5
although sometimes
the latter is used to describe a broader organisational approach
to quality management that evolved into the concept of total
quality management.6
One of the tenets of QI is that to improve healthcare
performance we must change our way of working.7
But change
does not always mean improvement. To discriminate between
changes that yield improvement and those that do not, relevant
aspects of performance need to be measured. In addition,
measurement guides decisions about where improvement
efforts should be focused in the first place. SPC may facilitate
such decision making. Control charts, central to SPC, are used
to visualise and analyse the performance of a process—
including biological processes such as blood pressure homo-
eostasis or organisational processes such as patient care in a
hospital—over time, sometimes in real time. Statistically
derived decision rules help users to determine whether the
performance of a process is stable and predictable or whether
there is variation in the performance that makes the process
unstable and unpredictable. One source of such variation can
be a successful intervention aimed at improvement that
changes performance for the better. If the improvement is
maintained, the process will stabilise again at its new level of
performance. All of this can be easily determined by using SPC.4
Although there are theoretical propositions that SPC can
facilitate decision making and QI in healthcare (eg, Berwick,8
Benneyan et al,9
Plsek10
) it is not clear what empirical support
there is in the literature for such a position11
:
‘‘The techniques of statistical process control, which have
proved to be invaluable in other settings, appear not to have
Abbreviations: MRSA, methicillin resistant Staphylococcus aureus; PEFR,
peak expiratory flow rate; QI, quality improvement; RCT, randomised
controlled trial; SPC, statistical process control
387
www.qshc.com
realised their potential in health care. ... Is this because they
are, as yet, rarely used in this way in health care? Is it
because they are unsuccessful when used in this way and
thus not published (publication bias)? Or is it that they are
being successfully used but not by people who have the
inclination to share their experience in academic journals?’’
(p 200)
The present systematic review aimed to answer these
questions. We examined the literature for how and where
SPC has been applied in QI of clinical/patient care processes and
the benefits, limitations, barriers and facilitating factors related
to such application.
MATERIALS AND METHODS
Drawing on the principles and procedures for systematic review
of QI interventions12
we searched for articles on the application
of SPC in healthcare QI published between 1966 and June 2004
(see appendix A) in the following databases: Web of Science,
Ovid Medline(R), EMBASE, CINAHL (Cumulative Index to
Nursing and Allied Health Literature), PsycInfo, and the Centre
for Reviews and Dissemination databases. We also included
articles found by searching reference lists or from elsewhere
which we were aware of, if they met our inclusion criteria:
original empirical studies of SPC application in improvement of
clinical/patient care processes in healthcare organisations,
published in English. We excluded articles dealing with
application of SPC in laboratory or technical processes (eg,
film processing) and in surveillance/monitoring (unless they
also contained empirical data about improvement efforts), as
well as tutorials (unless they contained empirical case studies),
letters, book reviews and dissertations.
We reviewed abstracts, when available, or else other
information about the publication provided in the database
(eg, publication type such as letters, book reviews or original
articles). Articles that did not meet the inclusion criterion were
excluded. We retrieved and read the full text of the remaining
articles, again excluding the articles that did not meet the
inclusion criterion.
We developed, pilot tested and modified a data abstraction
form which we then used to consistently capture information of
relevance to our review questions on reading the full text
articles. The information recorded was: whether and how the
article met the inclusion criterion; study objective(s); study
design; whether the study empirically compared application of
SPC with any other method for process data display and
analysis; reported benefits, limitations, barriers and facilitating
factors related to SPC; organisational setting; country where
study was conducted; clinical specialty; unit of analysis;
variables for SPC analysis; and other observations. Some
questions in the form required a yes/no or brief response (eg,
country where study was conducted) and others required
answers in the form of direct quotes from the article or the a
summary of the article written by the reviewer. Each article was
read and data abstracted by one member of the review team
(the coauthors of this review). Following this, all the data
abstraction forms were reviewed by the first author, who
solicited clarification and checked for any missing or incom-
plete data to ensure consistency in reporting across all articles
reviewed. He also conducted the initial data synthesis, which
was then reviewed by the entire team.
We determined the study design for each article and whether
the investigators intended to test the utility of SPC application,
alone or in combination with other interventions. In several
articles, the study design or study objectives were not explicitly
stated. Our determination of such intention in such cases was
based on our reading of the full text papers.
Simple descriptive statistics—for example, the number of
publications per year of publication or per country—were used
to characterise the included studies. The qualitative nature of
our research questions and of the abstracted data shaped our
analysis and synthesis of findings regarding benefits, limita-
tions, SPC variables, etc.13
The abstracted data was reviewed
one question at a time and data from each article was classified
into one or more thematic categories, each with a descriptive
heading. Informed by our present understanding of QI and
healthcare, we developed these categories as we reviewed the
data, rather than using categories derived a priori from theory.
For data that did not fit into an existing category, we developed
a new one. Thus the categories emerged as we synthesised the
data. We report the categorised data in tabular form, illustrated
with examples, and give the references of all the source studies.
To strengthen our review through investigator triangula-
tion,14
we sought feedback on an earlier version of this
manuscript from two SPC experts: one was the most frequent
coauthor in the included studies and the other was an expert on
SPC application also in settings other than healthcare. Their
comments helped us refine our data synthesis and distil our
findings.
RESULTS
The database searches yielded 311 references. The initial review
(abstracts etc.) yielded 100 articles which we read in full text
form. Of these, 57 articles met the inclusion criteria and have
been included in the review.15–71
To characterise the body of
liferature, figure 1 shows the year of publication and whether
the studies were conducted in USA or elsewhere (further
specified below); table 1 gives the study designs and
objectives—whether or not to test SPC utility.
Most of the articles (45/57) concerned application of SPC in
healthcare improvement in the USA.15–35 37–40 42 43 45 47 49–56 59 60 63 67–71
While the first US-based article was published in 1990, the
non-US articles were published between 1998 and 2003: three
articles were from the UK,61 62 66
three were from
Switzerland,36 41 46
and one each were from Australia,58
Finland,65
France,57
Indonesia,44
Norway64
and Spain.48
The
intention to test the utility of SPC is exemplified by a study
aiming to reduce the rate of acquisition of methicillin-resistant
Staphylococcus aureus (MRSA) on wards and units at Glasgow
Royal Infirmary hospitals.61
Annotated control charts displaying
data on MRSA acquisition were fed back monthly to medical
staff, managers and hotel services. Sustained reductions in the
rate of acquisition from the baseline, which could not otherwise
Figure 1 The number of included articles by year of publication. (A total
of 55 articles were published in 1990–2003; the two articles from 2004
are not included in this graph since the database searches were conducted
in June 2004.) Black bars: studies conducted in the USA; grey bars: studies
conducted outside the USA.
388 Thor, Lundberg, Ask, et al
www.qshc.com
be accounted for, started 2 months later. In contrast, investi-
gators at a paediatric emergency department used SPC to
demonstrate a decline in the rate of contamination following
the introduction of a new approach to drawing blood for culture
specimens,68
but the study had no intention to test the utility of
SPC per se.
To characterise the content of the articles, we first present
how and where SPC has been applied to healthcare QI. Tables 2–
4 present the study settings (ie, hospital etc. where SPC was
applied; table 2), the field of healthcare (ie, specialties or forms
of care; table 3), and the units of analysis (table 4). Table 5
enlists the 97 distinct SPC variables that have been reported.
Tables 6–9 convey our synthesis of the reported benefits,
limitations, barriers and facilitating factors related to SPC
application. For each category, we have given explanations or
examples and references to the source articles.
DISCUSSION
SPC has been applied to healthcare improvement in a wide
range of settings and specialties, at diverse levels of organisa-
tions and directly by patients, using many types of variables
(fig 1, tables 2–5). We found reports of substantial benefits of
SPC application, as well as important limitations of, barriers to
and factors that facilitate SPC application (tables 6–9). These
findings indicate that SPC can indeed be a powerful and
versatile tool for managing changes in healthcare through QI.
Besides helping diverse stakeholders manage and improve
healthcare processes, SPC can also help clinicians and patients
understand and improve patients’ health when applied directly
to health indicators such as PEFR in asthma or blood sugar
concentrations in diabetes. In healthcare, the ‘‘study subject’’
can thus also be an active agent in the process, as when patients
apply SPC to their own health. Several studies indicated the
empowering effects this may have on patients.35 38 40 50
SPC
application thus has therapeutic potential as it can help
patients manage their own health. We agree with Alemi and
Neuhauser70
that this potential merits further investigation.
Most of the included articles concerned application of SPC in
healthcare improvement in the USA. Articles from other
countries appeared only towards the end of the study period
Table 1 Study design and objectives of the studies included in the systematic review*
Study design
Number
of articles References
Number of articles in
each study design
category intending to
test utility of SPC References
Case study 28 16, 17, 19–21, 24, 26, 29, 33, 34, 36, 39, 41,
44–49, 53, 55, 57, 58, 61, 63–65, 67
16 16, 17, 20, 24, 26, 36,
41, 44, 47, 48, 57, 61,
63–65, 67
Tutorial with illustrative case study 23 15, 18, 22, 23, 25, 27, 30, 31, 35, 37, 38, 40,
42, 50–52, 54, 59, 62, 66, 69–71
3 22, 25, 30
Observational study of change in
clinical procedure(s) using historical
controls
2 43, 68 0
Controlled before-and-after
intervention studies
2 28, 56 1 56
Patient case reports 2 32, 60 2 32, 60
*The study designs are reported in order of frequency.
Table 2 How and where SPC was applied: study settings*
Study setting
Number
of articles References
Hospital settings (total) 40
Entire hospital 14 18, 21, 24, 25, 27,
31, 33, 37, 42, 44,
54, 56, 61, 69
Hospital department 12 17, 22, 28, 30, 39,
45, 47, 53, 57, 64,
68, 71
Hospital departments in collaboration 5 36, 41, 43, 46, 48
Hospital outpatient clinic 5 29, 32, 49, 60, 67
Hospital clinical chemistry laboratory 2 19, 58
Hospital outpatient clinics in
collaboration
1 55
Hospital wards 1 65
Non-hospital outpatient settings (total) 12
Outpatient single specialty clinic 5 35, 37, 40, 50, 70
Primary care centre 4 34, 52, 62, 66
Outpatient multispecialty clinic 2 15, 59
Ambulatory nursing centre clinic 1 23
Other settings (total) 6
Healthcare system 2 26, 63
Nursing home 2 16, 51
Mental health residential facility 1 20
Not specified 1 38
*The study settings are divided in three groups, each consisting of several
different settings. One article reported data from two settings, hence a total
of 58 settings are reported.
Table 3 How and where SPC was applied: fields of
healthcare*
Field of healthcare
(specialty)
Number
of articles References
Anaesthesia—intensive care 12 22, 25, 33, 36, 39, 41–43,
46, 48, 57, 64
Family practice—primary care 7 34, 52, 55, 59, 62, 63, 66
Emergency medicine 6 19, 45, 46, 48, 53, 68
Cardiac (cardiothoracic)
surgery
5 22, 30, 42, 47, 56
Cardiology 5 22, 32, 46, 48, 56
Internal medicine 4 15, 32, 37, 50
Surgery 4 42, 43, 49, 59
Asthma–allergology 3 35, 40, 70
Nursing 3 23, 24, 65
Clinical chemistry 2 19, 58
Nursing home 2 16, 51
Urology 2 36, 41
Endocrinology 1 55
Haematology 1 67
Mental health 1 20
Orthopaedics 1 28
Oncology 1 67
Otolaryngology 1 29
Paediatrics 1 59
Radiology 1 17
Rehabilitation medicine 1 60
*The specialties or fields of healthcare (eg, nursing homes) where SPC was
applied are rank ordered according to the number of articles in which such
application was reported. Whereas 11 articles did not specify a specialty or
field of healthcare, several articles included more than one specialty.
Systematic review of SPC in healthcare QI 389
www.qshc.com
(fig 1). We have no explanation for this finding, but we
speculate that it is related to differences between US and other
healthcare systems with regard to QI awareness and imple-
mentation.73
Only 22 studies included in the review were intended to test
the utility of SPC (table 1). Of the four controlled studies, only
one included a control chart in the intervention (as a minor
component which did not fully exploit the features of SPC). In
35 articles we did not find an intention to test the utility of SPC
application. In those cases, SPC was applied for other reasons
(ie, to evaluate the impact of other interventions). Even though
many articles thus did not address the utility of SPC, all studies
offered information—to varying degrees—relevant to our
review’s question of how SPC has been applied to healthcare.
The utility of SPC is reflected in benefits reported regarding SPC
application (table 6).
SPC has been applied in over 20 specialties or fields of
healthcare, at a wide range of levels (tables 3 and 4), suggesting
that SPC has broad applicability in healthcare. The dominance
of anaesthesia and intensive care can be explained in large part
by the fact that many studies included their services in
conjunction with other specialties. This reflects the way in
which anaesthesia has a vital supporting role in many clinical
care processes. The 97 SPC variables reported (table 5)
demonstrate a diversity of situations in which SPC has been
applied, ranging from process indicators of patients’ health to
health outcomes and many aspects of healthcare processes and
organisational performance. This indicates that SPC is a
versatile QI tool.
The benefits of SPC application (table 6) mirror those given
in books and tutorials on SPC (exemplified by the quote in the
Introduction to this review). As noted in a report from a top-
ranked healthcare system which has applied SPC widely:
‘‘Among the most powerful quality management tools that
IHC [Intermountain Health Care, USA] has applied is
statistical process control, SPC. Most notable among those
tools are control charts. Under optimal conditions, these
graphical depictions of process performance allow partici-
pants to know what is happening within their processes as
‘real time’ data enable them to make appropriate decisions.
The capability of truly understanding processes and variation
in a timely manner has resulted in the most dramatic,
immediate, and ongoing improvements of any management
technique applied at IHC.’’ (Shaha,26
p 22)
The limitations of SPC application (table 7) identified by this
review are important, and yet perhaps less emphasised than the
benefits in books and tutorials on SPC. SPC cannot solve all
problems and must be applied wisely. There are many opportu-
nities to ‘‘go wrong’’, as illustrated by the case where incorrect
application was highlighted by other authors (limitation number 5
in table 7). In several cases, our own understanding of SPC
suggested that investigators had not used it correctly or fully (eg,
standard decision rules to detect special causes were not applied to
identify process changes). In the worst case scenario, incorrect
application of SPC could lead to erroneous conclusions about
process performance and waste time, effort and spirit and even
contribute to patient harm. In the more authoritative studies we
reviewed, co-investigators included experts in industrial engineer-
ing or statistics or authors who otherwise had developed
considerable expertise in SPC methodology. On the basis of these
observations, we conclude that although SPC charts may be easy to
useeven forpatients, clinicians ormanagerswithout extensive SPC
training, they may not be equally simple to construct correctly. To
apply SPC is, paradoxically, both simple and difficult at the same
time. Its power hinges on correct and smart application, which is
not necessarily a trivial task. The key, then, is to develop or recruit
the expertise necessary to use SPC correctly and fully and to make
SPC easy for non-experts to use, before using it widely.
Autocorrelation is another limitation of SPC highlighted by
this review. Our review, and published books, offer limited
advice on how to manage it:
‘‘There is no single acceptable way of dealing with
autocorrelation. Some would say simply to ignore it.
[Others] would disagree and suggest various measures to
deal with the phenomenon. One way is to avoid the
autocorrelation by sampling less frequently. ... Others argue
against plotting autocorrelated data on control charts and
recommend that the data be plotted on a line chart (without
any centerline or control limits).’’ (Carey,4
p 68)
Just over a quarter of the articles reported barriers to SPC
application (table 8). The three broad divisions of barriers—
people, data and chart construction, and IT—indicate where
extra care should be taken when introducing SPC in a
healthcare organisation. Ideas on how to manage the limita-
tions of and barriers to SPC application can be found among the
factors reported to facilitate SPC application (table 9). They deal
with, and go beyond, the areas of barriers we found. We noted
the prominence of learning and also of focusing on topics of
interest to clinicians and patients. The 11 categories under the
heading ‘‘Smart application of SPC can be helpful’’ contain
valuable approaches that can be used to improve SPC
application. Examples include risk adjustment51 52 71
and stra-
tification30 37 59
to enable correct SPC analysis of data from
heterogeneous populations of patients (or organisational
units). Basic understanding of SPC must be taught to
stakeholders and substantial skill and experience is required
to set up successful SPC application. Experts, or facilitators, in
healthcare organisations can help, as indicated in table 9, and
as we have described for other QI methods.74
Table 4 How and where SPC was applied: units of
analysis*
Unit of analysis
Number
of articles References
Single patients (including patients
using control charts themselves)
9 16, 22, 32, 35, 38, 40,
50, 60, 70
Single clinicians 4 37, 52, 62, 66
Outpatient clinic 3 29, 49, 59
An ambulatory nursing centre clinic 1 23
Primary care/family medicine centre 2 34, 63
Population(s) of patients in nursing
home(s)
2 16, 51
Staff at mental health residential
facility living areas
1 20
Hospital wards 5 26, 33, 56, 61, 65
Department process level 15 17, 19, 21, 25, 27, 30,
39, 42, 45, 53, 54, 57,
64, 68, 71
Hospital department and community-
based orthopaedic surgeons
1 28
Microsystem(s) 6 15, 37, 43, 47, 50, 67
Process that involves more than one
department
6 36, 41, 46, 48, 55, 58
Entire hospital 6 18, 21, 24, 31, 44, 69
*The units of analysis—the levels at which SPC was applied—are ordered
according to the degree of aggregation (from individual patients to entire
organisations). Some articles reported data from more than one unit of
analysis. A microsystem is defined as ‘‘a small group of people who work
together on a regular basis to provide care to discrete subpopulations of
patients’’.72
The distinction between microsystems and other categories is not
absolute but a matter of judgment.
390 Thor, Lundberg, Ask, et al
www.qshc.com
Table 5 SPC variables*
I Biomedical variables
Blood glucose and HbA1c measures
1 HbA1c level in groups of diabetic patients52
2 Blood glucose, as a daily group average, for intensive care patients on parenteral or enteral nutrition
33
3 Average blood glucose levels among intensive care unit patients on total parenteral nutrition per week25
4 Standard deviation of blood glucose levels among intensive care unit patients on total parenteral nutrition per
week
25
5 Capillary blood glucose measurements of individual patients56
6 Individual patient blood glucose measurements
38
7 Individual patient fasting blood sugar measurements37 50
8 Average of five consecutive HbA1c measurements in diabetic patients cared for by one clinician50
Peak expiratory flow rates (PEFR)
9 Daily am (ie, morning) pre-bronchodilator PEFR in asthmatic patients (litres/min)35 40
Pain
10 Daily individual patient visual analogue pain scale recordings60
Cardiovascular system measures
11 Blood pressure22 23 32
12 Heart rate
22 32
13 Central venous pressure22
Urinary output
14 Urinary output (during intensive care)22
Oxygen saturation
15 Oxygen saturation (during intensive care)22
II Biomedical measurement variable
16 Blood pressure measurement error (mm Hg)23
III Other variables related to patient health
17 Patient fall rate (number of patient falls/number of cases per month)51
18 Days in between asthma attacks
70
19 Nausea on day 3 after administration of chemotherapy, as reported by patients on a scale, displayed as the
average in each sample of four consecutive patients67
20 Incontinence volume (of fluid) for individual incontinent patients (in ‘‘a change-program’’) on scheduled
inspections16
21 Volume of irrigation fluid absorbed during endoscopic renal pelvic surgery
41
IV Clinical management variables
Time to complete (part of) a clinical process
22 Time between patient check-in and interpretation of a preoperative radiograph
17
23 Door-to-needle time: ‘‘the time span between hospital admission and the initiation of thrombolytic therapy in
patients with acute myocardial infarction’’
46 48
24 Average length of stay for inpatients with congestive heart failure54
25 Length of stay after cardiac surgery (risk adjusted and transformed)71
26 Average length of stay for total hip replacement patients
28
27 Intensive care unit admission time42
28 Average postoperative (bowel surgery) length of stay (in days) per month
42
29 Admission time (from ‘‘sign in’’ to ‘‘patient in room’’)
18 31
30 Duration of intravenous antibiotic treatment for patients with pneumonia37
31 Time to administration of antibiotic treatment for patients with pneumonia
37
32 Average length of hospital stay for inpatients with pneumonia37
33 Time to extubation after coronary artery bypass grafting (CABG) surgery (hours)47
34 Length of stay in the intensive care unit after CABG (days)
47
35 Total hospital length of stay after CABG (days)47
36 Laboratory turnaround time for blood tests
19 27
37 Average postoperative length of stay after non-emergent CABG surgery, per quarter
30
38 Time from receiving a referral to first patient contact (days)49
Time, or number of consecutive cases, between events
39 Time between deaths in chronic obstructive pulmonary disease54
40 Number of successful elective CABG surgeries between cases with mortality
42
41 Number of successful CABG surgeries between cases with complications42
42 Number of successful bowel resection operations between cases with complications42
(see also variable 18 for another example)
Rate of events in a clinical process (‘‘defect rate’’ or ‘‘success rate’’)
43 Percentage of chief complaints (of patients in an emergency department) charted in free text (as opposed to
coded) in the medical record, per day53
44 Percentage of anaesthesia sessions with at least one ‘‘significant anaesthetic event’’
57
45 Mortality in patients with congestive heart failure
54
46 Proportion of low birthweight infants54
47 Percentage of intravenous medication administration events associated with an error
24
48 Occurrence of four intraoperative adverse events, of relevance to anaesthetic quality and safety: inadequate
analgesia during brachial plexus block, emergence from general anaesthesia, intubation problems and
medication errors
64
49 Proportion of patients with excessive absorption of irrigation fluid during transurethral resection of the
prostate36
50 Mortality after CABG
42
51 Proportion of patients on enteral, or parenteral, nutrition with blood glucose levels outside a (clinical
management) target range
33
52 Daily percentage of satisfied requests for medical records at a paediatric outpatient clinic
18
Systematic review of SPC in healthcare QI 391
www.qshc.com
53 ‘‘Guideline non-adherence rate’’; proportion of chemotherapy administrations in which guideline
recommendations to prevent nausea were not followed
67
54 Percentage of all blood cultures growing contaminants per month
68
55 Proportion of intensive care unit patients on total parenteral nutrition with blood glucose values that were
higher than the given target (.11.1 mmol/l (.200 mg/dl)) per week
25
56 Percentage of all acute bronchitis visits during which a b-agonist was prescribed, per month34
57 Percentage of all acute bronchitis visits during which an antibiotic was prescribed, per month34
58 Percentage of outpatient surgical procedures per month (of all procedures)
43
59 Proportion of cases where tests were delayed or not reported in a timely fashion15
60 Proportion of incontinent patients (in ‘‘a toileting program’’) who were wet on scheduled inspections
16
61 Monthly percentage of emergency department patients who leave without being seen
45
62 Percentage of inpatients on the ward in each of three acuity levels (low, medium and high) per day26
63 The quarterly incidence rate of eight variables among cardiac surgery patients: perioperative death,
perioperative myocardial infarction; cerebrovascular accident; re-exploration for bleeding or tamponade;
atrial fibrillation; leg wound; acute tubular necrosis; sternal infection; acute renal failure30
64 Rates of total and major complications per patient after cardiac surgery
30
65 Proportion of first case starts each day in the operating theatres that are delayed due to the department of
anaesthesia
39
66 Proportion of cases in which the turnaround time between cases exceeded the given performance standard
39
Number of defects/events or occurrences in a clinical process
67 Number of medication errors, per month
24
68 Number of out-of-hours ‘‘stat’’ (blood test analyses) requests received each week58
69 Number of MRSA cases per month
61
70 Number of diabetes patients (seen at office visits) with HbA1c measurements, per month34
71 Number of patients (seen at office visits) at a department of family medicine with a recorded diagnosis of
tobacco abuse, per month
34
72 Total number of surgical procedures per month43
73 Number of patients with diarrhoea admitted to the hospital, per week
44
74 Number of referrals per month for patients with diabetes from primary care to endocrinology
55
75 Number of new referrals per work day49
76 Net number of new patients ( = practice growth)
63
Clinical decision making
77 (Square root of) the number of cases per general practitioner (GP) diagnosed as having tonsillitis versus
number of cases diagnosed as having any throat infection62
78 (Square root of) the number of GP patients diagnosed as having tonsillitis and non-tonsillar throat infection,
who receive antibiotics
62
79 (Square root of) the number of GP cases with any throat infection diagnosis who received antibiotics62
80 (Square root of) the number of GP cases with a diagnosis of sore throat in which antibiotics were not
prescribed versus the number of cases in which antibiotics were prescribed
66
V Financial resources variables
Cost of care
81 Average cost per procedure (total hip replacement)28
82 Staffing expense per shift, depicted as variance in US$ from budget
26
83 Staffing expense per 24-h period, depicted as variance in US$ from budget26
Productivity and efficiency
84 Relative value unit (RVU) production per provider FTE (full-time equivalent) ( = provider productivity)63
85 FTE support staff per FTE provider ( = practice efficiency)63
Organisational financial performance
86 Net patient revenue per relative value unit (a primary care physician‘s practice) ( = practice profitability)63
87 Provider cost as a percent of net revenue ( = practice cost management)
63
88 Non-provider cost as a percentage of net revenue ( = practice cost management)63
VI Variables relating to the experience of healthcare
Patient satisfaction indicators
89 ‘‘Physician care scale score’’, which is the average of patient survey responses to 10 questions
59
90 Patient satisfaction with (nursing) care
65
91 Percentage of patients (who responded to a patient satisfaction survey) whose response was that the overall
visit was excellent
29
Other experience with care
92 Patient rating of assistance in solving the patient’s current health problem
65
93 Staff satisfaction with (nursing) care65
94 Staff rating of assistance in solving patients’ current health problems65
VII Variables related to clinical staff supervision
Clinical staff supervision
95 Active treatment monitoring index, based on observing staff performance in clinical encounters and assessing
nine criteria20
Completion of mandatory staff training
96 Percentage of employees who have completed mandatory safety training21
VIII Other variables
97 ‘‘A temperature signal’’ (of unspecified origin; it is probably not body temperature since it varies around 74˚F
or 23˚C). ‘‘[T]he signal could just as easily have been bed occupancy, ED wait time, expense per equivalent
discharge, or staffed care days.’’69
*The variables are divided into eight categories and then further subdivided under subheadings in a category. Several
articles reported more than one SPC variable.
Table 5 Continued
392 Thor, Lundberg, Ask, et al
www.qshc.com
We found more information on SPC benefits and facilitating
factors than on limitations and barriers, and this may represent
a form of publication bias, as indicated by the quote in the
Introduction.11
We did not find any study that reported failed
SPC application. We can speculate that there have been
situations when SPC application failed, just as there must be
many cases of successful SPC application that have not been
reported in the literature. Studies of failed SPC application
efforts, as well as studies designed to identify successful ways
to apply SPC to manage change, would help inform future SPC
Table 6 Benefits of using SPC to improve clinical processes*
Examples/explanations
SPC facilitated and documented healthcare process improvement
1 SPC application helped people
assess the impact of changes to the
process19 24 27 30 32–34 37 42 43 45 52 53 55 57 58 60 64 67 68
Many articles reported a helpful role of SPC in determining the effects of interventions made to healthcare
processes. Examples include successful effects, adverse effects or a lack of effect
2 SPC application contributed (led) to
improvement of healthcare
processes16 17 20 26 28 30 31 36 37 46 53 56 65
Several articles reported improvement of a healthcare process and attributed that improvement, more or
less explicitly, to improvement efforts in general and SPC application in particular (the foundations for such
attribution were methodologically weak—for instance, case reports without comparisons).
For example, investigators evaluating the ‘‘door-to-needle-time’’ (DTNT) for thrombolytic treatment of
patients with acute myocardial infarction (AMI) using control charts found that ‘‘in the beginning there was
considerable variability of DTNT signifying that the process of in-hospital management of patients with AMI
was out of statistical control. Shortly after the initiation of formal process analysis DTNTs were reduced
significantly and remained within a narrow range, now showing a stable and statistically controlled
pattern. Thus, process quality was significantly improved by our efforts’’ (Bonetti et al,46
p 315)
3 SPC application helped people
identify areas for
improvement21 26 40 42 47 49 58 70
Several investigators identified process performance that was not satisfactory, and hence in need of
improvement, using SPC. For instance, investigators applying SPC to the care of patients with asthma
concluded that when the care process yields a range of breathing that ‘‘is clinically problematic, the care
process should be redesigned and monitored to ensure that the problem has been corrected’’ (Boggs
et al,40
p 175)
SPC was a useful tool for healthcare management
4 SPC application helped people
distinguish special from common cause
variation15 30 35 38 39 41 42 45 49 51 54 59 64 70 71
Reflecting one of the tenets of SPC, many articles reported how SPC helped people identify common cause
and special cause variation, and understand the difference. Investigators applying SPC to surgical care, for
instance, concluded that ‘‘plotting data over time and using control chart techniques will tell us whether the
variation in a surgical process is stable and predictable or whether variation signals a significant change in
the process’’ (Levett and Carey,42
p 358)
5 SPC seen as a valuable QI tool which
was easy to use
18 19 25 29 30 38 40 42 47 48 50 56 62 69 70
Many articles report the usefulness of SPC as a tool in healthcare process management and improvement.
Investigators at a cardiac surgery department, for example, designed a system for automated data
collection and generation of control chart for critical pathway adherence, and concluded that it was ‘‘a cost
effective method for providing timely feedback. The benefits of timely feedback with the control chart
method are strongly suggested by this study’’ (Ratcliffe et al,
47
p 1821)
6 SPC enabled valuable prediction of future
process performance30 35 40
A few studies reported the value of being able to predict future performance of stable processes. A
predictable outcome was beneficial to the patient, doctor and insurer.30
In asthma care, such prediction
enabled clinicians and patients to decide whether to maintain the current care regimen or alter it to
improve future outcomes35 40
7 SPC helped describe and quantify process
variability
22 23 35
SPC allowed characterisation of process variability, including variability present in blood pressure
measurement
23
SPC helped process stakeholders
8 SPC enabled patients to be partners in
clinical management (and
research)35 38 40 50 60
SPC enabled patients with chronic conditions to better understand and manage—alone or in partnership
with clinicians—their condition, specifically, diabetes mellitus,
38 50
hypertension,
38
muscular pain
60
and
asthma.35
SPC has also been proposed as a research strategy whereby patients can be active partners in
data collection and analysis.38
In asthma care, for example, when patients control-chart their breathing function the benefits include
‘‘knowing each patient’s signals and their meaning; natural limits of the current care process; and having
the ability to anticipate this patient’s future level of function given no change in his/her care process[. This]
enhances both the patient’s and physician’s ability to meaningfully engage in the process of continuous
quality improvement of asthma. [It] elevates the level of communication and dialogue between patients and
physicians exponentially beyond that generated by traditional run chart information’’ (Boggs et al,
35
p 561)
9 SPC application improved communication
between process actors35 36 52 63 70
SPC provided a common language and facilitated communication between managers and clinicians, or
between clinicians and patients. See the example above
10 SPC application enabled (better) informed
decision making
21 26 35 44 54 61 63 66
SPC helped inform decision making in healthcare organisation governance and management
21 26 44 54 61 63
and in clinical decision making regarding—or in partnership with—patients.
35 66
Reporting on efforts at the Intermountain Health Care system to improve inpatient acuity level
assessment, Shaha concluded that ‘‘control charts have given information to delivery-level decision makers
which they have never before enjoyed. The system has helped nurse managers better understand the acuity
on their units and plan more effectively for appropriate staffing to support patient care. Improved staffing
has enhanced teamwork and the quality of work life on these units’’ (Shaha,
26
p 30)
11 SPC empowered process
stakeholders15 21 26 35 50 54 61
SPC had an empowering effect among—for example, patients,
35 50
nurse managers,
26
a medical
assistant,15
healthcare workers and managers,21 61
and board members21 54
12 SPC application helped stakeholders learn
about their processes
40 63 68
Stakeholder—or ‘‘organisational’’—learning was facilitated by SPC application and involved patients,
40
clinicians
40 63 68
and managers.
63
‘‘Both you and your patient are learners. Let the charts teach you and help you learn what is of practical
value to your patients. You will find that learning together is a strong invitation of commitment to the
[asthma care] process for both of you’’ (Boggs et al,40
p 175)
*All articles reported benefits, and many reported several. The benefits formed 12 categories which are grouped into three broad areas.
Systematic review of SPC in healthcare QI 393
www.qshc.com
application efforts. On the basis of this review, we agree with
the argument that ‘‘medical quality improvement will not reach
its full potential unless accurate and transparent reports of
improvement work are published frequently and widely (p
319),’’75
and also that the way forward is to strengthen QI
research rather than to lower the bar for publication.76
Methodological considerations regarding the included
studies
None of the studies we found was designed to evaluate the
effectiveness quantitatively—that is, the magnitude of bene-
fits—of SPC application. This would have required other study
designs such as cluster randomised trials or quasi-experimental
studies.12
Although the ‘‘methods of evaluating complex
interventions such as quality improvement interventions are
less well described [than those to evaluate less complex
interventions such as drugs]’’, Eccles et al argue that the
‘‘general principle underlying the choice of evaluative design is
... simple—those conducting such evaluations should use the
most robust design possible to minimise bias and maximise
generalisability. [The] design and conduct of quantitative
evaluative studies should build upon the findings of other
quality improvement research (p 47).’’77
This review can provide
such a foundation for future evaluative studies.
An important distinction is warranted here: we believe that
SPC rests on a solid theoretical, statistical foundation and is a
highly robust method for analysing process performance. The
designs of the studies included in this systematic review were,
however, not particularly robust with regard to evaluating the
effectiveness of SPC application, and that was not their
Table 7 Limitations of SPC application in improvement of clinical processes*
Examples/explanations
Limitations of the ability to improve clinical processes using SPC
1 Sharing performance data in control
chart format does not automatically
lead to improvement in healthcare
organisations15 67
Even if control charts can help visualise the performance of a clinical process, and signal a need for
improvement, there is no guarantee that such signals prompt improvement. For example, Mertens et al
studied the effects of a number of interventions, including control chart format feedback, on oncologist
prescribing patterns for the management of delayed chemotherapy-induced nausea and emesis. ‘‘In our
study, these [control] charts effectively measured the degree of compliance with guideline recommendations,
but they were not effective in improving physician compliance ... . These findings indicate that statistically
valid charting, although useful in measuring compliance, will not achieve improved compliance as a
physician feedback tool. However, enhanced compliance may be achieved when adverse patient outcomes
are coupled with evidence of poor compliance with evidence-based guidelines’’ (Mertens et al,67
p 1377)
2 Statistical control does not necessarily
equal clinical control nor desired
performance27 35 63 64
‘‘It is important to note that a chart can be in statistical control, and [the patient can still] be at risk for severe
asthma. So statistical control does not equate with clinical control. It simply reflects the absence of special
cause variation’’ (Boggs et al,35
p 555)
3 Cause and effect relationships are not
always obvious, even if a change is
identified with statistical confidence45 60 61
‘‘Although control charts can help detect when the [MRSA] rate has increased or decreased, they typically
will not identify the specific cause of the change. Once a change is detected, the infection control team must
use its skills to assess the situation, identify possible causes, and promote improvement in practices’’ (Curran
et al,
61
p 16)
Limitations of the applicability of SPC to clinical processes
4 Differences between patients may limit
the appropriateness of combining data
about their care onto one control
chart25 30 51 52
‘‘Unlike manufacturing, the health care industry deals with a variable input: Patients differ in their severity of
illness on admission. This variability on admission affects care outcomes.[Ref]
Therefore, it is imperative to
adjust for patients’ risk for adverse outcomes. ... Blindly applying methods of manufacturing to health care
may be misleading’’ (Alemi and Oliver,51
p 2)
5 The ability of stakeholders to apply SPC
correctly may be limited
16 35
Discussing an article which contains a methodological error—irrational subgrouping—Boggs et al
emphasise that ‘‘the mathematics which defines the upper and lower control limits and the zone lines (from
which signals are defined) is derived from the range between the values composing each subgroup. If the
daily subgroupings are irrational—i.e., the AM pre- and postbronchodilator and PM pre- and
postbronchodilator are included in the same subgrouping—the daily ranges are distorted, the mathematical
calculations are erroneous, and the control charts these calculations produce are improperly constructed. An
improperly constructed chart is by definition uninterpretable. This error of irrational subgrouping is fatal and
invalidates both their analysis and conclusions’’ (Boggs et al,35
p 560).
Another aspect of this limitation is when staff members lack sufficient knowledge of QI in general and SPC
in particular
16
6 Limitations regarding data for use in
control charts
25 26 38 44 45 54 63–65
Several articles highlight limitations related to the data needed for control charting:
l The sample size needs to be ‘‘big enough’’. A minimum amount of data are needed to produce reliable
control charts.26 54
‘‘If a control chart has too few data points, then it may appear that a special cause
exists when it really does not’’ (Caron and Neuhauser,
54
p 31)
l Common types of control charts are not well suited to analysing infrequent events. Such events require
special types of control charts64
l (Manual) data collection can be prohibitively demanding
65
l Oversampling of patients whose values are out of control pulls the statistic in the direction of
derangements25
l Choosing too long a sampling period may delay control chart signalling and delay decision making
44
l (Retrospective) control chart interpretation can be difficult if charts are not annotated with interventions or
other influences on process performance
45
l Autocorrelation may limit the ability to analyse control chart data. ‘‘Autocorrelation is a phenomenon
whereby the preceding observation predicts the next observation. ... If yesterday’s blood pressure
predicts today’s blood pressure, there is autocorrelation’’ (Solodky et al,
38
p AS14)
l System-level aggregation of SPC data may prevent local sense making (if the data cannot be
disaggregated). For example, performance measures of one primary care medical group practice ‘‘are
computed on a group practice level. This level of aggregation means that the SPC charts cannot currently
be used to evaluate the results of individual and team efforts within individual group practices’’ (Stewart
and Greisler,
63
pp 258–9)
*We found statements regarding one or more limitations of SPC application in 22 articles. The limitations formed six categories which are grouped into two broad areas.
394 Thor, Lundberg, Ask, et al
www.qshc.com
objective. This does not mean that SPC is not a useful tool for
QI in healthcare, only that the studies reviewed here were more
vulnerable to bias than more robust study designs, even if they
do indicate many clear benefits of SPC application (table 6).
Despite the studies not being designed to evaluate the
effectiveness of SPC, many used SPC to effectively show the
impact of QI or other change initiatives. In this way, SPC
analysis can be just as powerful and robust as study designs
often deemed superior, such as randomised controlled trials
(RCTs).77
The key to this power is the statistical and practical
ability to detect significant changes over time in process
performance when applying SPC.9
On the basis of a theoretical
comparison between control charts and RCTs, Solodky et al38
argue that control charts can complement RCTs, and sometimes
even be preferable to RCTs, since they are so robust and enable
replication—‘‘the gold standard’’ for research quality—at much
lower cost than do RCTs. These points have been further
elaborated in subsequent work.78 79
A curious methodological wrinkle in our review is: can you
evaluate the application of a method (eg, SPC) using that same
method for the evaluation? Several of the included studies used
SPC both as (part of) an intervention and as a method to evaluate
the impact of that intervention. For example, Curran et al used
annotated control charts to feed information on MRSA acquisition
rates back to stakeholders and used these same control charts to
show the effectiveness of the feedback programme.61
Relationship between monitoring and improvement
When SPC is applied for monitoring, rather than for managing
change, the aims are different—for example, to detect even small
but clinically important deviations in performance—as are the
methodological challenges.80 81
This review focused on the latter.
Thus although studies on SPC application for monitoring
healthcare performance were excluded from this review, we
recognise the importance of such monitoring. The demarcation
between monitoring and improvement is not absolute. Indeed,
there are important connections between measurement, mon-
itoring and improvement, even if improvement does not follow
automatically from indications of dissatisfactory performance.
‘‘To improve performance, organizations and individuals need the
Table 8 Barriers to SPC application*
Examples/explanations
People related barriers
1 Lack of knowledge on how to apply
SPC correctly
16 35 37 51
Even though control charts, constructed correctly, may be easy to use, not all healthcare professionals and
managers have sufficient SPC knowledge
2 At first, SPC may represent a new and
challenging way of thinking18 40
‘‘It is not at all surprising that many persons avoid involvement in statistical process control. The statistical
procedures developed in industry to monitor production processes are somewhat different from those
employed in biostatistics and social science applications. Many find it difficult to adjust to these procedures
and to apply statistical process control techniques to situations in health care settings’’ (McKenzie,18
p 81)
3 If SPC application is not perceived as
helpful, it may not succeed
39 65
‘‘Whereas Finison et al.[Ref]
claim that the mean and standard deviation are simple and easy for staff to
understand, the staff involved in this study found them difficult to perceive. This is partly accounted for by the
staff’s resistance, as it seemed that they did not want to understand the results of the figures. The staff expected
the investigators to tell them what to do and did not want to process the results and the issues underlying them’’
(Hyrkas and Lehti,
65
p 186)
Data collection and chart construction related barriers
4 Collection and attribution of data to
different hospital units for SPC
application can be difficult61
In the case of hospital acquired infections, investigators found that it was hard to assign new cases to the
correct ward or unit’s control chart. ‘‘The few disadvantages of this approach primarily concern
implementation. The ability to assign a new MRSA case to a specific ward rarely can be completely accurate.
We attempt to minimize this imprecision by encouraging the input of ward staff in any discussions or debates
as to where a patient acquired the MRSA’’ (Curran et al,
61
p 17)
5 Finding the right level of aggregation
of data for SPC application can
be difficult and require trade-offs
61
Continuing with the example of hospital acquired MRSA infections, finding the best level of data aggregation
was a barrier: ‘‘If the control chart includes too many wards, then staff may feel the responsibility lies
elsewhere and they may not be inclined to use the feedback to alter their practices. Further, if the chart
contains information from too many departments or units, it sometimes can mask local problems or out-of-
control data. [Furthermore, monitoring] a large number of units on individual charts also can decrease the
overall specificity and increase the false-alarm rate, especially if [2 sigma] warning limits are used as control
limits’’ (Curran et al,61
pp 16–8)
6 Data collection and analysis can be
time consuming and costly
17 19 37 39
‘‘Other real obstacles that challenge physicians are the time required for and the financial costs of data
collection and analysis. ... Certainly, measurement may consume valuable resources’’ (Nelson et al,
37
p. 465)
7 Constructing the most appropriate
control chart can be difficult
30
‘‘The most difficult task is deciding which probability distribution, and thus which control chart, is most
appropriate for the data, and then choosing homogenous and rational subgroups to analyze’’ (Shahian et
al,
30
p 1356)
8 Lack of access to reliable data in a
timely fashion can be a barrier to
real-time SPC application
47
Discussing care pathways in cardiac surgery, one group found that ‘‘accurate process data are difficult and
expensive to obtain. Data obtained from hospital and medical records data systems are often inaccurate,
temporally inefficient, and not focused on daily patient events[.] Among the difficulties with optimizing
outcome-based cardiac surgical care are the expense and problems with [multi-institutional] databases,
including lack of standardization, cost of dedicated data entry/delivery personnel, and lack of timely
feedback[. Those] systems were not designed to provide rapid feedback of process data, which is necessary if
individual practitioners are to effectively manage cardiac surgery pathways’’ (Ratcliffe et al,47
p 1820)
Information technology related barriers
9 Lack of computer power was a barrier
to real-time SPC application22
‘‘There are several reasons why control charts and other statistical process control techniques have to date not
been introduced as tools to improve real-time clinical decision making. These include lack of computer power
to perform calculations in real time, inabilities to interface medical monitors with computers and to produce
clean measurement with an acceptable signal to noise ratio, and lack of statistical process control training for
clinical decision makers’’ (Laffel et al,22
pp 76–7)
10 Software problems can hamper SPC
application26
One study reported unspecified, and subsequently resolved, software problems as the only barrier to SPC
application
*We found reports of barriers in 15 articles. They formed 10 categories which are grouped into three broad areas.
Systematic review of SPC in healthcare QI 395
www.qshc.com
Table 9 Factors or conditions facilitating application of SPC*
Examples/explanations
Information technology and other tools facilitated SPC application
1 Easy-to-use tools and resources exist to aid
with data management and control chart
construction22 30 31 35 45 47 69 70
The evolution of information technology has brought many new possibilities for SPC data
management, control chart construction and interpretation
2 Electronic clinical information systems with
SPC capability facilitated data management
and SPC application19 25 28 30 34 47 49
When designing a system which produced control charts for measures reflecting performance relative
to a critical pathway for cardiac surgery, investigators found that a facilitating factor ‘‘was the existing
electronic medical record, which requires that nurses enter a computerized progress note. ...
Integration of the data collection with the generation of a nursing progress note clearly provides the
motivation for the bedside nurse to use the system. Moreover, we were able to couple our data
collection system with the requirement for an electronic progress note efficiently, so that ... the
intranet-based system decreased by 50% the amount of time the nurses spent charting their progress
note’’ (Ratcliffe et al,
47
pp 1820–1)
Feedback, training and learning may facilitate SPC application
3 User feedback guided changes to facilitate
SPC application
40
‘‘In a focus group session with patients, we learned that many objected to plotting the exact PEFR
values over time on a chart. The fear was misplotting – thereby ruining the chart. This insight led to a
redesign of the chart in a manner that respected their concern yet did not compromise the chart’s
ability to provide the information needed’’ (Boggs et al,
40
p 174)
4 Training users in SPC application may be
helpful15 26 44 50
Reflecting on efforts to apply SPC at a provincial hospital in Indonesia, the author suggests that ‘‘(i) the
process of data management should be performed by the hospital staff under supervision and with
training they should be able to do it without supervision; (ii) a training session for staff on the creation
and interpretation of the control chart should be carried out’’ (Purba,
44
p 147)
5 Gradual introduction of SPC can allow
learning and improvement to support
subsequent application and spread
25 34 61
At a family medicine clinic, the impact of QI including SPC application ‘‘had to be demonstrated
through initial projects before there was more general support for the process by other residents and
faculty within the department’’ (Ornstein et al,
34
p 360)
6 Professionals in training led improvement
efforts using SPC as part of a clinical
scholars programme
34
‘‘Many of the ideas for patient care improvement projects [using SPC] have evolved from the work
and leadership of a group of family residents, pharmacy residents, and faculty that is involved in a
unique educational experience known as the clinical scholars program. The program was developed
... as a mechanism to provide the family medicine residents with hands-on opportunities to learn
clinical research and quality improvement methods. ... Generally, the project leaders are residents in
the clinical scholars program’’ (Ornstein et al,34
p 351)
7 SPC application to clinical topics captured
the interest of clinicians
34
‘‘Clinical topics interest clinicians, and recognition of the potential personal benefits of a project will
increase individual commitment and participation’’ (Ornstein et al,
34
p 360)
Patients can have a role in SPC application
8 The benefits of SPC application motivated
and empowered patients to record and
control chart the data
35
‘‘Adherence in our clinic population is better, both short-term and long-term, with [asthma patient
operated control charts of PEFR] than for any PEFR monitoring method we have used in the past. ... It
is our assessment that the reasons for high patient adherence with our method include (1) the PEFR
measurement per se is simple and can be performed using inexpensive equipment; (2) the charts our
patients use are easy to keep and understand; (3) the concepts of signals and not being at-risk are
easily understood and appreciated by patients; (4) the chart plays a central role in each patient’s
follow-up visit and in telephone calls between visits; (5) because of the latter, patients know we will be
monitoring their adherence; (6) patients understand that their chart provides information we need and
will use to make decisions that will impact their care; and (7) the quality of the communication with
patients is more substantive’’ (Boggs et al,
35
p 561)
9 Patients as partners may be better at
collecting data for SPC analysis than ‘‘human
subjects’’ are in traditional research
38
‘‘For the control chart analysis used in the current study, the patient has been a partner (the first author
of this article). Patients in RCTs usually are seen as ‘human subjects.’ Psychological theory suggests
that partners are better data collectors than subjects’’ (Solodky et al,
38
pp AS18–9)
Literature and experts can guide SPC application
10 There is literature to guide SPC
application
15 35
‘‘The statistical methods to be used in calculating control charts are well described in the
literature.[Ref]
’’ (Re et al,
15
p 395)
11 Local experts may provide technical
assistance for SPC application18 47
‘‘At the Indiana University Medical Center several persons from different hospital departments have
volunteered to form a cadre of internal statistical process control consultants. The group has come to
be known by some as the statistical process control ‘think tank’. No doubt a small group of individuals
who are interested in statistics, quality control, and computers can be found in most hospitals. While it
is necessary that the large majority of managers and supervisors in any health care organization are
knowledgeable about process management and control charts at the concept level of understanding,
it takes a relatively few to understand and use such control charts. As internal consultants, these few
persons can provide technical assistance when such aid is needed’’ (McKenzie,18
p 81)
12 Collaboration with SPC experts may facilitate
application
23 34
Collaboration between scholars from nursing and experts in industrial measurement error research
‘‘has facilitated the conception and completion of a study [of blood pressure measurement error in a
nursing clinic] that could not have been accomplished by either discipline alone’’ (Nelson et al,23
p 27)
396 Thor, Lundberg, Ask, et al
www.qshc.com
capability to control, improve, and design processes, and then to
monitor the effects of this improvement work on the results.
Measurement alone will not suffice (pp 1–35).’’82
Monitoring performance by way of control charts has been
suggested as a better approach to clinical governance in the
British National Health Service. Through six case studies,
Mohammed et al demonstrate how control chart monitoring of
performance can distinguish normal performance from perfor-
mance that is either substandard or better than usual care. ‘‘These
case studies illustrate an important role for Shewhart’s approach
to understanding and reducing variation. They demonstrate the
simplicity and power of control charts at guiding their users
towards appropriate action for improvement (p 466).’’83
Comments on the review methodology
No search strategy is perfect, and we may well have missed
some studies where SPC was applied to healthcare QI. There are
no SPC specific keywords (eg, Medical Subject Headings,
MeSH) so we had to rely on text words. Studies not containing
our search terms in the title or abstract could still be of
potential interest although presumably we found most of the
articles where SPC application was a central element. We
believe the risk that we systematically missed relevant studies
to be small. Therefore, our findings would probably not have
changed much due to such studies that we might have missed.
The review draws on our reading, interpretation and selection
of predominantly qualitative data—in the form of text and
figures—in the included articles to answer the questions in our
data abstraction form. The questions we addressed, the answers
we derived from the studies, and the ways we synthesised the
findings are not the only ways to approach this dataset.
Furthermore, each member of the review team brought
different knowledge and experiences of relevance to the review,
potentially challenging the reliability of our analysis. An
attempt was made to reduce that risk by having one
investigator read all data abstraction forms, and obtain
clarifications or additional data from the original articles when
needed. That investigator also conducted the initial data
synthesis, which was then reviewed by the entire team and
the two outside experts. Although other interpretations and
syntheses of these data are possible, we believe that ours are
plausible and hope they are useful.
Examples/explanations
Smart application of SPC can be helpful
13 Freezing control limits and the centre line
at pre-intervention levels helped decipher
the impact of interventions
59 70
‘‘In [a figure], note that we have separated the plot into two periods: before and after the intervention.
For calculating the [control limits], one should use only the data from before the intervention. In this
fashion, the patient and the clinicians can decipher if the postintervention data exceeds their
expectations from historical patterns’’ (Alemi and Neuhauser,70
p 99)
14 Data stratification or disaggregation helped
disentangle performance problems and
focus improvement efforts37 59
‘‘The physicians at Site A needed to develop a theory about why their care was rated lower than at
other sites. They theorized that the results might be different for the three service areas: family
practice, pediatrics, and ambulatory surgery. Therefore, they developed a control chart to
disaggregate the data by service. The results ... for each service were juxtaposed on the same control
chart using a technique called rational ordering’’ (Carey,
59
p 80)
15 Risk adjustment of SPC data revealed
process changes that previously were
hidden
51 52 71
‘‘Before risk adjustment, the process improvement was hidden by the variations in patient risk. Taking
the patient risks into account by risk adjustment revealed the significant decrease in [length of stay]
during the final 3 months of the 18-month period’’ (Hart et al,
71
p 115)
16 Annotations and feedback helped users
interpret control charts54 61
‘‘For anyone not familiar with the information presented in a control chart, annotations are essential.
Annotations will aid in explaining observed variation and explaining changes in the underlying
process’’ (Caron and Neuhauser,
54
p 30)
17 Keeping control charts up to date
increased their utility61
‘‘Because the infection control team updates the [control] charts frequently, they can respond more
immediately to an increased rate and interact with the ward in a more timely manner’’ (Curran et al,61
p 15)
18 Providing SPC information as locally as
possible increased its accuracy and utility26 61
‘‘A major reason for the system’s success is that these data charts exist on the PCs at the patient care
areas. The information is available to the caregivers and their manager. ... In the [Intermountain
Health Care] model, the information is seen first by those who should care the most about its accuracy
and reliability. They immediately seek legitimate and operational explanations for anomalies,
genuinely showing a high degree of ownership and desire for data integrity’’ (Shaha,
26
p 30)
19 Making SPC charts readily available to
stakeholders may facilitate SPC
application
34 65
‘‘Feedback to physicians and other providers is an important component of all the ongoing
improvement projects. To facilitate this communication, monthly updates to the control charts used to
monitor ongoing CQI projects are posted on a large bulletin board [and also distributed at meetings,
and sent out by e-mail]’’ (Ornstein et al,
34
p 353)
20 Knowing the clinical context helped in the
interpretation of control charts25
Discussing the issue that blood glucose tests are taken more frequently from patients whose blood
glucose level is deranged, investigators argue that they ‘‘interpret the charts in context, aware that
points are weighted toward derangements’’ (Oniki et al,
25
p 589)
21 Evidence of autocorrelation can be detected
easily38
‘‘Evidence for [autocorrelation—that the preceding observation predicts the next observation] is
detected easily by correlating the value of the variable at time t with the value of the variable at time
t + 1’’ (Solodky et al,
38
p AS14)
22 Concurrent controls can help interpret
variation detected using SPC38
‘‘Control charts focus on change over time. Adding concurrent control patients can help monitor the
effects of unknown exogenous factors that may influence outcomes’’ (Solodky et al,38
p AS17)
23 A key quality indicator helped reflect the
functioning of a complex set of processes
in a simple way46
‘‘Overall process quality cannot be measured directly; we must resort to the use of quality indicators
as easy to assess surrogate markers reflecting overall quality. DTNT [door-to-needle-time for patients
with acute myocardial infarction who receive a thrombolytic drug] in our example, is a prototype of
such an indicator, because it represents the result of a very complex set of processes but nevertheless
is simple to measure’’ (Bonetti et al,46
p 314)
*We found reports of facilitating conditions or factors in 28 articles. The factors formed 23 categories which are grouped into five broad areas.
Table 9 Continued
Systematic review of SPC in healthcare QI 397
www.qshc.com
The methods for reviewing studies based primarily on
qualitative data in healthcare are less well developed than the
more established methods for quantitative systematic reviews,
and they are in a phase of development and diversifica-
tion.13 84 85
Among the different methods for synthesising
evidence, our approach is best characterised as an interpretive
(rather than integrative) review applying thematic analysis—it
‘‘involves the identification of prominent or recurrent themes in
the literature, and summarising the findings of different
studies under thematic headings’’.86
There is no gold standard
for how to conduct reviews of primarily qualitative studies. Our
response to this uncertainty has been to use the best ideas we
could find, and to be explicit about our approach to allow
readers to assess the findings and their provenance.
The main limitation of this review is the uncertainty
regarding the methodological quality of many of the primary
studies. Assessment of quality of qualitative studies is still
under debate, and there is no consensus on whether at all, or, if
so, how to conduct such assessments.84
We reviewed all the
studies that satisfied our inclusion criteria and made no further
quality assessment. Therefore our findings should be consid-
ered as tentative indications of benefits, limitations, etc to be
corroborated, or rejected, by future research. The main strength
of this review is our systematic and explicit approach to
searching and including studies for review, and to data
abstraction using a standardised form. It has helped generate
an overview of how SPC has been applied to healthcare QI with
both breadth and depth—similar to the benefits of thematic
analysis reported by investigators reviewing young people’s
views on health and health behaviour.87
In conclusion, this review indicates how SPC has been
applied to healthcare QI with substantial benefits to diverse
stakeholders. Although there are important limitations and
barriers regarding its application, when applied correctly SPC is
a versatile tool which can enable stakeholders to manage
change in healthcare and improve patients’ health.
ACKNOWLEDGEMENTS
We thank Ms Christine Wickman, Information Specialist at the
Karolinska Institutet Library, for expert assistance in conducting the
database searches. We also acknowledge the pilot work conducted by
Ms Miia Maunuaho as a student project at Helsinki University,
supervised by Professor Brommels, which provided a starting point
for this study. We thank Professor Duncan Neuhauser, Case Western
Reserve University, Cleveland, Ohio, USA, and Professor Bo Bergman,
Chalmers University of Technology, Gothenburg, Sweden, for their
helpful comments on an earlier version of this manuscript. We thank Dr
Rebecca Popenoe for her editorial assistance.
Authors’ affiliations
. . . . . . . . . . . . . . . . . . . . . . .
Johan Thor, Jonas Lundberg, Jakob Ask, Jesper Olsson, Cheryl Carli,
Karin Pukk Härenstam, Mats Brommels, Medical Management Centre,
Karolinska Institutet, Stockholm, Sweden
Funding: No dedicated funding was received for this study. All coauthors
were supported by their respective employers in conducting this research as
part of their work.
Competing interests: None.
REFERENCES
1 Burnes B. Managing change: a strategic approach to organisational dynamics,
3rd edn. London: Financial Times/Prentice Hall, 2000.
2 Wheeler DJ, Chambers DS. Understanding statistical process control, 2nd edn.
Knoxville, TN: SPC Press, 1992.
3 Fisher LM, Humphries BL. Statistical quality control of rabbit brain thromboplastin
for clinical use in the prothrombin time determination. Am J Clin Pathol
1966;45:148–52.
4 Carey RG. Improving healthcare with control charts: basic and advanced SPC
methods and case studies. Milwaukee: ASQ Quality Press, 2003.
5 Daniels S, Johnson K, Johnson C. Quality glossary. 2006 [cited 28 June 2006],
http://www.asq.org/glossary/s.html.
6 Blumenthal D. Applying industrial quality management science to physicians’ clinical
decisions. In: Blumenthal D, Scheck A, eds. Improving clinical practice: total quality
management and the physician. San Francisco: Jossey-Bass Publishers, 1995:25–49.
7 Berwick DM. A primer on leading the improvement of systems. BMJ
1996;312:619–22.
8 Berwick DM. Controlling variation in health care: a consultation from Walter
Shewhart. Med Care 1991;29:1212–25.
9 Benneyan JC, Lloyd RC, Plsek PE. Statistical process control as a tool for research
and healthcare improvement. Qual Saf Health Care 2003;12:458–64.
10 Plsek PE. Quality improvement methods in clinical medicine. Pediatrics
1999;103(1 Suppl E):203–14.
11 Wilcock PM, Thomson RG. Modern measurement for a modern health service.
Qual Health Care 2000;9:199–200.
12 Grimshaw J, McAuley LM, Bero LA, et al. Systematic reviews of the effectiveness
of quality improvement strategies and programmes. Qual Saf Health Care
2003;12:298–303.
13 Mays N, Roberts E, Popay J. Synthesising research evidence. In: Fulop N, Allen P,
Clarke A, et al, eds. Studying the organisation and delivery of health services:
research methods. London: Routledge, 2001:188–220.
14 Fulop N, Allen P, Clarke A, et al. Issues in studying the organisation and delivery of
health services. In: Fulop N, Allen P, Clarke A, et al, eds. Studying the organisation
and delivery of health services: research methods. London: Routledge, 2001:1–23.
15 Re RN, Krousel-Wood MA. How to use continuous quality improvement theory
and statistical quality control tools in a multispecialty clinic [see comment]. Qrb
Qual Rev Bull 1990;16:391–7.
16 Schnelle JF, Newman DR, Fogarty TE, et al. Assessment and quality-control of
incontinence care in long-term nursing facilities. J Am Geriatr Soc
1991;39:165–71.
17 Bluth EI, Havrilla M, Blakeman C. Quality improvement techniques: value to
improve the timeliness of preoperative chest radiographic reports. AJR
Am J Roentgenol 1993;160:995–8.
18 McKenzie L. Process management: two control charts. Health Care Superv
1993;12:70–81.
19 Rollo JL, Fauser BA. Computers in total quality management. Statistical process
control to expedite stats. Arch Pathol Lab Med 1993;117:900–5.
20 Dey ML, Sluyter GV, Keating JE. Statistical process control and direct care staff
performance. J Ment Health Adm 1994;21:201–9.
21 Guinane CS, Sikes JI, Wilson RK. Using the PDSA cycle to standardize a quality
assurance program in a quality improvement-driven environment. Jt Comm J Qual
Improv 1994;20:696–705.
22 Laffel G, Luttman R, Zimmerman S. Using control charts to analyze serial patient-
related data. Qual Manag Health Care 1994;3:70–7.
23 Nelson FE, Hart MK, Hart RF. Application of control chart statistics to blood
pressure measurement variability in the primary care setting. J Am Acad Nurse
Pract 1994;6:17–28.
24 Carey RG, Teeters JL. CQI case-study—reducing medication errors. Jt
Comm J Qual Improv 1995;21:232–7.
25 Oniki TA, Clemmer TP, Arthur LK, et al. Using statistical quality control techniques
to monitor blood glucose levels. Proc Annu Symp Comput Appl Med Care
1995:586–90.
26 Shaha SH. Acuity systems and control charting. Qual Manag Health Care
1995;3:22–30.
27 Ziegenfuss JT Jr, McKenna CK. Ten tools of continuous quality improvement: a
review and case example of hospital discharge. Am J Med Qual
1995;10:213–20.
28 Johnson CC, Martin M. Effectiveness of a physician education program in
reducing consumption of hospital resources in elective total hip replacement.
South Med J 1996;89:282–9.
29 Piccirillo JF. The use of patient satisfaction data to assess the impact of continuous
quality improvement efforts. Arch Otolaryngol Head Neck Surg
1996;122:1045–8.
30 Shahian DM, Williamson WA, Svensson LG, et al. Applications of statistical quality
control to cardiac surgery. Ann Thorac Surg 1996;62:1351–8; discussion 8–9.
31 Tsacle EG, Aly NA. An expert system model for implementing statistical process
control in the health care industry. Computers & Industrial Engineering
1996;31:447–50.
32 Cornelissen G, Halberg F, Hawkins D, et al. Individual assessment of
antihypertensive response by self-starting cumulative sums. J Med Eng Technol
1997;21:111–20.
33 Linford LH, Clemmer TP, Oniki TA. Development of a blood glucose protocol
using statistical quality control techniques. Nutr Clin Pract 1997;12:38–41.
34 Ornstein SM, Jenkins RG, Lee FW, et al. The computer-based patient record as a
CQI tool in a family medicine center. Jt Comm J Qual Improv 1997;23:347–61.
35 Boggs PB, Wheeler D, Washburne WF, et al. Peak expiratory flow rate control
chart in asthma care: chart construction and use in asthma care. Ann Allergy
Asthma Immunol 1998;81:552–62.
36 Konrad C, Gerber HR, Schuepfer G, et al. Transurethral resection syndrome:
effect of the introduction into clinical practice of a new method for monitoring
fluid absorption. J Clin Anesth 1998;10:360–5.
37 Nelson EC, Splaine ME, Batalden PB, et al. Building measurement and data
collection into medical practice. Ann Intern Med 1998;128:460–6.
38 Solodky C, Chen HG, Jones PK, et al. Patients as partners in clinical research—a
proposal for applying quality improvement methods to patient care. Med Care
1998;36:AS13–20.
39 Vitez TS, Macario A. Setting performance standards for an anesthesia
department. J Clin Anesth 1998;10:166–75.
398 Thor, Lundberg, Ask, et al
www.qshc.com
40 Boggs PB, Hayati F, Washburne WF, et al. Using statistical process control charts
for the continual improvement of asthma care. Jt Comm J Qual Improv
1999;25:163–81.
41 Konrad C, Gerber H, Schupfer G, et al. Detection of fluid volume absorption by
end-tidal alcohol monitoring in patients undergoing endoscopic renal pelvic
surgery. J Clin Anesth 1999;11:386–90.
42 Levett JM, Carey RG. Measuring for improvement: from Toyota to thoracic
surgery. Ann Thorac Surg 1999;68:353–8.
43 Pollard JB, Garnerin P. Outpatient preoperative evaluation clinic can lead to a
rapid shift from inpatient to outpatient surgery: a retrospective review of
perioperative setting and outcome. J Clin Anesth 1999;11:39–45.
44 Purba M. Use of a control chart to monitor diarrhoea admissions: a quality
improvement exercise in West Kalimantan Provincial Hospital, Pontianak,
Indonesia. J Qual Clin Pract 1999;19:145–7.
45 Schwab RA, DelSorbo SM, Cunningham MR, et al. Using statistical process
control to demonstrate the effect of operational interventions on quality indicators
in the emergency department. J Healthc Qual 1999;21:38–41.
46 Bonetti PO, Waeckerlin A, Schuepfer G, et al. Improving time-sensitive processes
in the intensive care unit: the example of ‘‘door-to-needle time’’ in acute
myocardial infarction. Int J Qual Health Care 2000;12:311–7.
47 Ratcliffe MB, Khan JH, Magee KM, et al. Collection of process data after cardiac
surgery: Initial implementation with a Java-based intranet applet. Ann Thorac
Surg 2000;69:1817–21.
48 Saturno PJ, Felices F, Segura J, et al. Reducing time delay in the thrombolysis of
myocardial infarction: an internal quality improvement project. Am J Med Qual
2000;15:85–93.
49 Sinanan M, Wicks K, Peccoud M, et al. Formula for surgical practice
resuscitation in an academic medical center. Am J Surg 2000;179:417–21.
50 Staker LV. Changing clinical practice by improving systems: the pursuit of clinical
excellence through practice-based measurement for learning and improvement.
Qual Manag Health Care 2000;9:1–13.
51 Alemi F, Oliver DW. Tutorial on risk-adjusted P-charts. Qual Manag Health Care
2001;10:1–9.
52 Alemi F, Sullivan T. Tutorial on risk adjusted X-bar charts: applications to
measurement of diabetes control. Qual Manag Health Care 2001;9:57–65.
53 Aronsky D, Kendall D, Merkley K, et al. A comprehensive set of coded chief
complaints for the emergency department. Acad Emerg Med 2001;8:980–9.
54 Caron A, Neuhauser DV. Health care organization improvement reports using
control charts for key quality characteristics: ORYX measures as examples. Qual
Manag Health Care 2001;9:28–39.
55 Quinn DC, Graber AL, Elasy TA, et al. Overcoming turf battles: developing a
pragmatic, collaborative model to improve glycemic control in patients with
diabetes. Jt Comm J Qual Improv 2001;27:255–64.
56 Roman SH, Chassin MR. Windows of opportunity to improve diabetes care when
patients with diabetes are hospitalized for other conditions. Diabetes Care
2001;24:1371–6.
57 Boelle PY, Bonnet F, Valleron AJ. An integrated system for significant anaesthetic
events monitoring. J Am Med Inform Assoc 2002;9:S23–7.
58 Burnett L, Chesher D, Burnett JR. Optimizing the availability of ‘‘stat’’ laboratory
tests using Shewhart ‘‘C’’ control charts. Ann Clin Biochem 2002;39:140–4.
59 Carey RG. Improving patient satisfaction: a control chart case study. J Ambul
Care Manage 2002;25:78–83.
60 Chu J, Neuhauser DV, Schwartz I, et al. The efficacy of automated/electrical
twitch obtaining intramuscular stimulation (atoims/etoims) for chronic pain
control: evaluation with statistical process control methods. Electromyogr Clin
Neurophysiol 2002;42:393–401.
61 Curran ET, Benneyan JC, Hood J. Controlling methicillin-resistant Staphylococcus
aureus: A feedback approach using annotated statistical process control charts.
Infect Control Hosp Epidemiol 2002;23:13–8.
62 Marshall T, Mohammed MA, Lim HT. Understanding variation for clinical
governance: an illustration using the diagnosis and treatment of sore throat.
Br J Gen Pract 2002;52:277–83.
63 Stewart LJ, Greisler D. Measuring primary care practice performance within an
integrated delivery system: a case study. J Healthc Manag 2002;47:250–61.
64 Fasting S, Gisvold SE. Statistical process control methods allow the analysis and
improvement of anesthesia care. Can J Anaesth 2003;50:767–74.
65 Hyrkas K, Lehti K. Continuous quality improvement through team supervision
supported by continuous self-monitoring of work and systematic patient
feedback. J Nurs Manag 2003;11:177–88.
66 Marshall T, Mohammed MA. Understanding variation in quality improvement:
the treatment of sore throats in primary care. Fam Pract 2003;20:69–73.
67 Mertens WC, Higby DJ, Brown D, et al. Improving the care of patients with
regard to chemotherapy-induced nausea and emesis: the effect of feedback to
clinicians on adherence to antiemetic prescribing guidelines. J Clin Oncol
2003;21:1373–8.
68 Norberg A, Christopher NC, Ramundo ML, et al. Contamination rates of blood
cultures obtained by dedicated phlebotomy vs intravenous catheter. JAMA
2003;289:726–9.
69 Rosow E, Adam J, Coulombe K, et al. Virtual instrumentation and real-time executive
dashboards. Solutions for health care systems. Nurs Adm Q 2003;27:58–76.
70 Alemi F, Neuhauser D. Time-between control charts for monitoring asthma
attacks. Jt Comm J Qual Saf 2004;30:95–102.
71 Hart MK, Robertson JW, Hart RF, et al. Application of variables control charts to
risk-adjusted time-ordered healthcare data .[comment]. Qual Manag Health
Care 2004;13:99–119.
72 Nelson EC, Batalden PB, Huber TP, et al. Microsystems in health care: Part 1.
Learning from high-performing front-line clinical units. Jt Comm J Qual Improv
2002;28:472–93.
73 Olsson J, Elg M, Molfenter T. Reflections on transnational transferability of
improvement technologies—a comparison of factors for successful change in the
United States and northern Europe. Qual Manag Health Care 2003;12:259–69.
74 Thor J, Wittlov K, Herrlin B, et al. Learning helpers: how they facilitated
improvement and improved facilitation—lessons from a hospital-wide quality
improvement initiative. Qual Manag Health Care 2004;13:60–74.
75 Davidoff F, Batalden P. Toward stronger evidence on quality improvement. Draft
publication guidelines: the beginning of a consensus project. Qual Saf Health
Care 2005;14:319–25.
76 Pronovost P, Wachter R. Proposed standards for quality improvement research
and publication: one step forward and two steps back. Qual Saf Health Care
2006;15:152–3.
77 Eccles M, Grimshaw J, Campbell M, et al. Research designs for studies evaluating
the effectiveness of change and improvement strategies. Qual Saf Health Care
2003;12:47–52.
78 Diaz M, Neuhauser D. Pasteur and parachutes: when statistical process control is
better than a randomized controlled trial. Qual Saf Health Care 2005;14:140–3.
79 Neuhauser D, Diaz M. Quality improvement research: are randomised trials
necessary? Qual Saf Health Care 2007;16:77–80.
80 Benneyan JC, Borgman AD. Risk-adjusted sequential probability ratio tests and
longitudinal surveillance methods [see comment] [comment]. Int J Qual Health
Care 2003;15:5–6.
81 Lim TO. Statistical process control tools for monitoring clinical performance.
Int J Qual Health Care 2003;15:3–4.
82 Berwick DM, James B, Coye MJ. Connections between quality measurement and
improvement. Med Care 2003;41(1 Suppl):I30–8.
83 Mohammed MA, Cheng KK, Rouse A, et al. Bristol, Shipman, and clinical
governance: Shewhart’s forgotten lessons. Lancet 2001;357:463–7.
84 Mays N, Pope C, Popay J. Systematically reviewing qualitative and quantitative
evidence to inform management and policy-making in the health field. J Health
Serv Res Policy 2005;10(Suppl 1):6–20.
85 Pawson R, Greenhalgh T, Harvey G, et al. Realist review—a new method of
systematic review designed for complex policy interventions. J Health Serv Res
Policy 2005;10(Suppl 1):21–34.
86 Dixon-Woods M, Agarwal S, Jones D, et al. Synthesising qualitative and
quantitative evidence: a review of possible methods. J Health Serv Res Policy
2005;10:45–53.
87 Harden A, Garcia J, Oliver S, et al. Applying systematic review methods to
studies of people’s views: an example from public health research. J Epidemiol
Community Health 2004;58:794–800.
APPENDIX A
DATABASE SEARCH STRATEGY
Web of Science (1986 – 11 June 2004)
TS [topic search] = ((statistical process control or statistical
quality control or control chart* or (design of experiment and
doe)) and (medical or nurs* or patient* or clinic* or healthcare
or health care))
We limited the search to articles in English only which
reduced the number of hits from 167 to 159. We saved these
159 titles with abstracts in an EndNote library. Using a similar
strategy, we searched the following databases through Ovid:
N Ovid MEDLINE(R) (1966 to week 1, June 2004)
N EMBASE (1988 to week 24, 2004)
N CINAHL (1982 to week 1, June 2004)
N PsycINFO (1985 to week 5, May 2004)
This yielded 287 hits, including many duplicates, which we
saved in the same EndNote library as above.
Centre for Reviews and Dissemination (CRD)
We searched all CRD databases and found two articles which
we also added to our EndNote library.
Systematic review of SPC in healthcare QI 399
www.qshc.com

More Related Content

Similar to Application Of Statistical Process Control In Manufacturing Company To Understand Variability

EVIDENCE BASED NURSING PRACTICE
EVIDENCE BASED NURSING PRACTICE EVIDENCE BASED NURSING PRACTICE
EVIDENCE BASED NURSING PRACTICE
Amrita Roy (Ex Capt.) (MSN,MBA-HCS,BSN)
 
Running head PLANNING STAGE 2-(DESIGN PHASE) OF A RESEARCH PROJEC.docx
Running head PLANNING STAGE 2-(DESIGN PHASE) OF A RESEARCH PROJEC.docxRunning head PLANNING STAGE 2-(DESIGN PHASE) OF A RESEARCH PROJEC.docx
Running head PLANNING STAGE 2-(DESIGN PHASE) OF A RESEARCH PROJEC.docx
jeanettehully
 
Anatomy of a meta analysis i like
Anatomy of a meta analysis i likeAnatomy of a meta analysis i like
Anatomy of a meta analysis i like
James Coyne
 
Guide for conducting meta analysis in health research
Guide for conducting meta analysis in health researchGuide for conducting meta analysis in health research
Guide for conducting meta analysis in health research
Yogitha P
 
Effective strategies to monitor clinical risks using biostatistics - Pubrica.pdf
Effective strategies to monitor clinical risks using biostatistics - Pubrica.pdfEffective strategies to monitor clinical risks using biostatistics - Pubrica.pdf
Effective strategies to monitor clinical risks using biostatistics - Pubrica.pdf
Pubrica
 
Prevencion de ulceras por presion y protocolo de tratamiento
Prevencion de ulceras por presion y protocolo de tratamientoPrevencion de ulceras por presion y protocolo de tratamiento
Prevencion de ulceras por presion y protocolo de tratamiento
GNEAUPP.
 
Recommendations on Evidence Needed to Support Measurement Equivalence between...
Recommendations on Evidence Needed to Support Measurement Equivalence between...Recommendations on Evidence Needed to Support Measurement Equivalence between...
Recommendations on Evidence Needed to Support Measurement Equivalence between...
CRF Health
 
An emergency department quality improvement project
An emergency department quality improvement projectAn emergency department quality improvement project
An emergency department quality improvement project
yasmeenzulfiqar
 
A gentle introduction to meta-analysis
A gentle introduction to meta-analysisA gentle introduction to meta-analysis
A gentle introduction to meta-analysisAngelo Tinazzi
 
A Database is not what you think and different designs serve different purposes.
A Database is not what you think and different designs serve different purposes.A Database is not what you think and different designs serve different purposes.
A Database is not what you think and different designs serve different purposes.
Instituto de Salud Musculoesquelética (InMusc)
 
9-Meta Analysis/ Systematic Review
9-Meta Analysis/ Systematic Review9-Meta Analysis/ Systematic Review
9-Meta Analysis/ Systematic Review
ResearchGuru
 
A research study Writing a Systematic Review in Clinical Research – Pubrica
A research study Writing a Systematic Review in Clinical Research – PubricaA research study Writing a Systematic Review in Clinical Research – Pubrica
A research study Writing a Systematic Review in Clinical Research – Pubrica
Pubrica
 
A research study writing a systematic review in clinical research – pubrica
A research study writing a systematic review in clinical research – pubricaA research study writing a systematic review in clinical research – pubrica
A research study writing a systematic review in clinical research – pubrica
Pubrica
 
Effective strategies to monitor clinical risks using biostatistics - Pubrica....
Effective strategies to monitor clinical risks using biostatistics - Pubrica....Effective strategies to monitor clinical risks using biostatistics - Pubrica....
Effective strategies to monitor clinical risks using biostatistics - Pubrica....
Pubrica
 
Operational research
Operational researchOperational research
Operational research
Dr Ramniwas
 
Nursing Practice Literature Evaluation Table Article Paper.pdf
Nursing Practice Literature Evaluation Table Article Paper.pdfNursing Practice Literature Evaluation Table Article Paper.pdf
Nursing Practice Literature Evaluation Table Article Paper.pdf
bkbk37
 
1Methods and Statistical AnalysisName xxx
1Methods and Statistical AnalysisName xxx1Methods and Statistical AnalysisName xxx
1Methods and Statistical AnalysisName xxx
MerrileeDelvalle969
 
Automated Extraction Of Reported Statistical Analyses Towards A Logical Repr...
Automated Extraction Of Reported Statistical Analyses  Towards A Logical Repr...Automated Extraction Of Reported Statistical Analyses  Towards A Logical Repr...
Automated Extraction Of Reported Statistical Analyses Towards A Logical Repr...
Nat Rice
 
Systematic reviews of
Systematic reviews ofSystematic reviews of
Systematic reviews ofislam kassem
 
Living evidence 3
Living evidence 3Living evidence 3
Living evidence 3stanbridge
 

Similar to Application Of Statistical Process Control In Manufacturing Company To Understand Variability (20)

EVIDENCE BASED NURSING PRACTICE
EVIDENCE BASED NURSING PRACTICE EVIDENCE BASED NURSING PRACTICE
EVIDENCE BASED NURSING PRACTICE
 
Running head PLANNING STAGE 2-(DESIGN PHASE) OF A RESEARCH PROJEC.docx
Running head PLANNING STAGE 2-(DESIGN PHASE) OF A RESEARCH PROJEC.docxRunning head PLANNING STAGE 2-(DESIGN PHASE) OF A RESEARCH PROJEC.docx
Running head PLANNING STAGE 2-(DESIGN PHASE) OF A RESEARCH PROJEC.docx
 
Anatomy of a meta analysis i like
Anatomy of a meta analysis i likeAnatomy of a meta analysis i like
Anatomy of a meta analysis i like
 
Guide for conducting meta analysis in health research
Guide for conducting meta analysis in health researchGuide for conducting meta analysis in health research
Guide for conducting meta analysis in health research
 
Effective strategies to monitor clinical risks using biostatistics - Pubrica.pdf
Effective strategies to monitor clinical risks using biostatistics - Pubrica.pdfEffective strategies to monitor clinical risks using biostatistics - Pubrica.pdf
Effective strategies to monitor clinical risks using biostatistics - Pubrica.pdf
 
Prevencion de ulceras por presion y protocolo de tratamiento
Prevencion de ulceras por presion y protocolo de tratamientoPrevencion de ulceras por presion y protocolo de tratamiento
Prevencion de ulceras por presion y protocolo de tratamiento
 
Recommendations on Evidence Needed to Support Measurement Equivalence between...
Recommendations on Evidence Needed to Support Measurement Equivalence between...Recommendations on Evidence Needed to Support Measurement Equivalence between...
Recommendations on Evidence Needed to Support Measurement Equivalence between...
 
An emergency department quality improvement project
An emergency department quality improvement projectAn emergency department quality improvement project
An emergency department quality improvement project
 
A gentle introduction to meta-analysis
A gentle introduction to meta-analysisA gentle introduction to meta-analysis
A gentle introduction to meta-analysis
 
A Database is not what you think and different designs serve different purposes.
A Database is not what you think and different designs serve different purposes.A Database is not what you think and different designs serve different purposes.
A Database is not what you think and different designs serve different purposes.
 
9-Meta Analysis/ Systematic Review
9-Meta Analysis/ Systematic Review9-Meta Analysis/ Systematic Review
9-Meta Analysis/ Systematic Review
 
A research study Writing a Systematic Review in Clinical Research – Pubrica
A research study Writing a Systematic Review in Clinical Research – PubricaA research study Writing a Systematic Review in Clinical Research – Pubrica
A research study Writing a Systematic Review in Clinical Research – Pubrica
 
A research study writing a systematic review in clinical research – pubrica
A research study writing a systematic review in clinical research – pubricaA research study writing a systematic review in clinical research – pubrica
A research study writing a systematic review in clinical research – pubrica
 
Effective strategies to monitor clinical risks using biostatistics - Pubrica....
Effective strategies to monitor clinical risks using biostatistics - Pubrica....Effective strategies to monitor clinical risks using biostatistics - Pubrica....
Effective strategies to monitor clinical risks using biostatistics - Pubrica....
 
Operational research
Operational researchOperational research
Operational research
 
Nursing Practice Literature Evaluation Table Article Paper.pdf
Nursing Practice Literature Evaluation Table Article Paper.pdfNursing Practice Literature Evaluation Table Article Paper.pdf
Nursing Practice Literature Evaluation Table Article Paper.pdf
 
1Methods and Statistical AnalysisName xxx
1Methods and Statistical AnalysisName xxx1Methods and Statistical AnalysisName xxx
1Methods and Statistical AnalysisName xxx
 
Automated Extraction Of Reported Statistical Analyses Towards A Logical Repr...
Automated Extraction Of Reported Statistical Analyses  Towards A Logical Repr...Automated Extraction Of Reported Statistical Analyses  Towards A Logical Repr...
Automated Extraction Of Reported Statistical Analyses Towards A Logical Repr...
 
Systematic reviews of
Systematic reviews ofSystematic reviews of
Systematic reviews of
 
Living evidence 3
Living evidence 3Living evidence 3
Living evidence 3
 

More from Martha Brown

Business Proposal Letter THE RESEARCH PROPO
Business Proposal Letter THE RESEARCH PROPOBusiness Proposal Letter THE RESEARCH PROPO
Business Proposal Letter THE RESEARCH PROPO
Martha Brown
 
What Are The Best Research Methods For Writers
What Are The Best Research Methods For WritersWhat Are The Best Research Methods For Writers
What Are The Best Research Methods For Writers
Martha Brown
 
(PDF) Editorial - Writing For Publication
(PDF) Editorial - Writing For Publication(PDF) Editorial - Writing For Publication
(PDF) Editorial - Writing For Publication
Martha Brown
 
Canada Role In World Essay United Nations Internati
Canada Role In World Essay United Nations InternatiCanada Role In World Essay United Nations Internati
Canada Role In World Essay United Nations Internati
Martha Brown
 
5 Best Images Of 12-Sided Snowflake Printable Templ
5 Best Images Of 12-Sided Snowflake Printable Templ5 Best Images Of 12-Sided Snowflake Printable Templ
5 Best Images Of 12-Sided Snowflake Printable Templ
Martha Brown
 
Monster Page Borders (Teacher Made). Online assignment writing service.
Monster Page Borders (Teacher Made). Online assignment writing service.Monster Page Borders (Teacher Made). Online assignment writing service.
Monster Page Borders (Teacher Made). Online assignment writing service.
Martha Brown
 
How To Resource In An Essay Salt Lake Juvenile Defense
How To Resource In An Essay Salt Lake Juvenile DefenseHow To Resource In An Essay Salt Lake Juvenile Defense
How To Resource In An Essay Salt Lake Juvenile Defense
Martha Brown
 
How To Write A Play Script (With Pictures) - WikiHow
How To Write A Play Script (With Pictures) - WikiHowHow To Write A Play Script (With Pictures) - WikiHow
How To Write A Play Script (With Pictures) - WikiHow
Martha Brown
 
How To Write A Great Narrative Essay. How Do Y
How To Write A Great Narrative Essay. How Do YHow To Write A Great Narrative Essay. How Do Y
How To Write A Great Narrative Essay. How Do Y
Martha Brown
 
Apa Itu Template What Is Template Images
Apa Itu Template What Is Template ImagesApa Itu Template What Is Template Images
Apa Itu Template What Is Template Images
Martha Brown
 
Fake Essay Writer Tumblr - Formatessay.Web.Fc2.Com
Fake Essay Writer Tumblr - Formatessay.Web.Fc2.ComFake Essay Writer Tumblr - Formatessay.Web.Fc2.Com
Fake Essay Writer Tumblr - Formatessay.Web.Fc2.Com
Martha Brown
 
Phenomenal How To Write A Satirical Essay Thatsnotus
Phenomenal How To Write A Satirical Essay ThatsnotusPhenomenal How To Write A Satirical Essay Thatsnotus
Phenomenal How To Write A Satirical Essay Thatsnotus
Martha Brown
 
The Best Providers To Get Custom Term Paper Writing Service
The Best Providers To Get Custom Term Paper Writing ServiceThe Best Providers To Get Custom Term Paper Writing Service
The Best Providers To Get Custom Term Paper Writing Service
Martha Brown
 
How To Choose A Perfect Topic For Essay. Online assignment writing service.
How To Choose A Perfect Topic For Essay. Online assignment writing service.How To Choose A Perfect Topic For Essay. Online assignment writing service.
How To Choose A Perfect Topic For Essay. Online assignment writing service.
Martha Brown
 
Pin On Dissertation Help Online. Online assignment writing service.
Pin On Dissertation Help Online. Online assignment writing service.Pin On Dissertation Help Online. Online assignment writing service.
Pin On Dissertation Help Online. Online assignment writing service.
Martha Brown
 
Cantest Sample Essay. Online assignment writing service.
Cantest Sample Essay. Online assignment writing service.Cantest Sample Essay. Online assignment writing service.
Cantest Sample Essay. Online assignment writing service.
Martha Brown
 
Article Critique Example In His 1999 Article The - Ma
Article Critique Example In His 1999 Article The  - MaArticle Critique Example In His 1999 Article The  - Ma
Article Critique Example In His 1999 Article The - Ma
Martha Brown
 
College Essay Examples Of College Essays
College Essay Examples Of College EssaysCollege Essay Examples Of College Essays
College Essay Examples Of College Essays
Martha Brown
 
Writing A TOK Essay. Online assignment writing service.
Writing A TOK Essay. Online assignment writing service.Writing A TOK Essay. Online assignment writing service.
Writing A TOK Essay. Online assignment writing service.
Martha Brown
 
How To Write A Good Classific. Online assignment writing service.
How To Write A Good Classific. Online assignment writing service.How To Write A Good Classific. Online assignment writing service.
How To Write A Good Classific. Online assignment writing service.
Martha Brown
 

More from Martha Brown (20)

Business Proposal Letter THE RESEARCH PROPO
Business Proposal Letter THE RESEARCH PROPOBusiness Proposal Letter THE RESEARCH PROPO
Business Proposal Letter THE RESEARCH PROPO
 
What Are The Best Research Methods For Writers
What Are The Best Research Methods For WritersWhat Are The Best Research Methods For Writers
What Are The Best Research Methods For Writers
 
(PDF) Editorial - Writing For Publication
(PDF) Editorial - Writing For Publication(PDF) Editorial - Writing For Publication
(PDF) Editorial - Writing For Publication
 
Canada Role In World Essay United Nations Internati
Canada Role In World Essay United Nations InternatiCanada Role In World Essay United Nations Internati
Canada Role In World Essay United Nations Internati
 
5 Best Images Of 12-Sided Snowflake Printable Templ
5 Best Images Of 12-Sided Snowflake Printable Templ5 Best Images Of 12-Sided Snowflake Printable Templ
5 Best Images Of 12-Sided Snowflake Printable Templ
 
Monster Page Borders (Teacher Made). Online assignment writing service.
Monster Page Borders (Teacher Made). Online assignment writing service.Monster Page Borders (Teacher Made). Online assignment writing service.
Monster Page Borders (Teacher Made). Online assignment writing service.
 
How To Resource In An Essay Salt Lake Juvenile Defense
How To Resource In An Essay Salt Lake Juvenile DefenseHow To Resource In An Essay Salt Lake Juvenile Defense
How To Resource In An Essay Salt Lake Juvenile Defense
 
How To Write A Play Script (With Pictures) - WikiHow
How To Write A Play Script (With Pictures) - WikiHowHow To Write A Play Script (With Pictures) - WikiHow
How To Write A Play Script (With Pictures) - WikiHow
 
How To Write A Great Narrative Essay. How Do Y
How To Write A Great Narrative Essay. How Do YHow To Write A Great Narrative Essay. How Do Y
How To Write A Great Narrative Essay. How Do Y
 
Apa Itu Template What Is Template Images
Apa Itu Template What Is Template ImagesApa Itu Template What Is Template Images
Apa Itu Template What Is Template Images
 
Fake Essay Writer Tumblr - Formatessay.Web.Fc2.Com
Fake Essay Writer Tumblr - Formatessay.Web.Fc2.ComFake Essay Writer Tumblr - Formatessay.Web.Fc2.Com
Fake Essay Writer Tumblr - Formatessay.Web.Fc2.Com
 
Phenomenal How To Write A Satirical Essay Thatsnotus
Phenomenal How To Write A Satirical Essay ThatsnotusPhenomenal How To Write A Satirical Essay Thatsnotus
Phenomenal How To Write A Satirical Essay Thatsnotus
 
The Best Providers To Get Custom Term Paper Writing Service
The Best Providers To Get Custom Term Paper Writing ServiceThe Best Providers To Get Custom Term Paper Writing Service
The Best Providers To Get Custom Term Paper Writing Service
 
How To Choose A Perfect Topic For Essay. Online assignment writing service.
How To Choose A Perfect Topic For Essay. Online assignment writing service.How To Choose A Perfect Topic For Essay. Online assignment writing service.
How To Choose A Perfect Topic For Essay. Online assignment writing service.
 
Pin On Dissertation Help Online. Online assignment writing service.
Pin On Dissertation Help Online. Online assignment writing service.Pin On Dissertation Help Online. Online assignment writing service.
Pin On Dissertation Help Online. Online assignment writing service.
 
Cantest Sample Essay. Online assignment writing service.
Cantest Sample Essay. Online assignment writing service.Cantest Sample Essay. Online assignment writing service.
Cantest Sample Essay. Online assignment writing service.
 
Article Critique Example In His 1999 Article The - Ma
Article Critique Example In His 1999 Article The  - MaArticle Critique Example In His 1999 Article The  - Ma
Article Critique Example In His 1999 Article The - Ma
 
College Essay Examples Of College Essays
College Essay Examples Of College EssaysCollege Essay Examples Of College Essays
College Essay Examples Of College Essays
 
Writing A TOK Essay. Online assignment writing service.
Writing A TOK Essay. Online assignment writing service.Writing A TOK Essay. Online assignment writing service.
Writing A TOK Essay. Online assignment writing service.
 
How To Write A Good Classific. Online assignment writing service.
How To Write A Good Classific. Online assignment writing service.How To Write A Good Classific. Online assignment writing service.
How To Write A Good Classific. Online assignment writing service.
 

Recently uploaded

special B.ed 2nd year old paper_20240531.pdf
special B.ed 2nd year old paper_20240531.pdfspecial B.ed 2nd year old paper_20240531.pdf
special B.ed 2nd year old paper_20240531.pdf
Special education needs
 
CACJapan - GROUP Presentation 1- Wk 4.pdf
CACJapan - GROUP Presentation 1- Wk 4.pdfCACJapan - GROUP Presentation 1- Wk 4.pdf
CACJapan - GROUP Presentation 1- Wk 4.pdf
camakaiclarkmusic
 
2024.06.01 Introducing a competency framework for languag learning materials ...
2024.06.01 Introducing a competency framework for languag learning materials ...2024.06.01 Introducing a competency framework for languag learning materials ...
2024.06.01 Introducing a competency framework for languag learning materials ...
Sandy Millin
 
Francesca Gottschalk - How can education support child empowerment.pptx
Francesca Gottschalk - How can education support child empowerment.pptxFrancesca Gottschalk - How can education support child empowerment.pptx
Francesca Gottschalk - How can education support child empowerment.pptx
EduSkills OECD
 
Acetabularia Information For Class 9 .docx
Acetabularia Information For Class 9  .docxAcetabularia Information For Class 9  .docx
Acetabularia Information For Class 9 .docx
vaibhavrinwa19
 
Thesis Statement for students diagnonsed withADHD.ppt
Thesis Statement for students diagnonsed withADHD.pptThesis Statement for students diagnonsed withADHD.ppt
Thesis Statement for students diagnonsed withADHD.ppt
EverAndrsGuerraGuerr
 
Operation Blue Star - Saka Neela Tara
Operation Blue Star   -  Saka Neela TaraOperation Blue Star   -  Saka Neela Tara
Operation Blue Star - Saka Neela Tara
Balvir Singh
 
The Challenger.pdf DNHS Official Publication
The Challenger.pdf DNHS Official PublicationThe Challenger.pdf DNHS Official Publication
The Challenger.pdf DNHS Official Publication
Delapenabediema
 
The French Revolution Class 9 Study Material pdf free download
The French Revolution Class 9 Study Material pdf free downloadThe French Revolution Class 9 Study Material pdf free download
The French Revolution Class 9 Study Material pdf free download
Vivekanand Anglo Vedic Academy
 
Digital Tools and AI for Teaching Learning and Research
Digital Tools and AI for Teaching Learning and ResearchDigital Tools and AI for Teaching Learning and Research
Digital Tools and AI for Teaching Learning and Research
Vikramjit Singh
 
June 3, 2024 Anti-Semitism Letter Sent to MIT President Kornbluth and MIT Cor...
June 3, 2024 Anti-Semitism Letter Sent to MIT President Kornbluth and MIT Cor...June 3, 2024 Anti-Semitism Letter Sent to MIT President Kornbluth and MIT Cor...
June 3, 2024 Anti-Semitism Letter Sent to MIT President Kornbluth and MIT Cor...
Levi Shapiro
 
Honest Reviews of Tim Han LMA Course Program.pptx
Honest Reviews of Tim Han LMA Course Program.pptxHonest Reviews of Tim Han LMA Course Program.pptx
Honest Reviews of Tim Han LMA Course Program.pptx
timhan337
 
Language Across the Curriculm LAC B.Ed.
Language Across the  Curriculm LAC B.Ed.Language Across the  Curriculm LAC B.Ed.
Language Across the Curriculm LAC B.Ed.
Atul Kumar Singh
 
Unit 2- Research Aptitude (UGC NET Paper I).pdf
Unit 2- Research Aptitude (UGC NET Paper I).pdfUnit 2- Research Aptitude (UGC NET Paper I).pdf
Unit 2- Research Aptitude (UGC NET Paper I).pdf
Thiyagu K
 
Biological Screening of Herbal Drugs in detailed.
Biological Screening of Herbal Drugs in detailed.Biological Screening of Herbal Drugs in detailed.
Biological Screening of Herbal Drugs in detailed.
Ashokrao Mane college of Pharmacy Peth-Vadgaon
 
The geography of Taylor Swift - some ideas
The geography of Taylor Swift - some ideasThe geography of Taylor Swift - some ideas
The geography of Taylor Swift - some ideas
GeoBlogs
 
Guidance_and_Counselling.pdf B.Ed. 4th Semester
Guidance_and_Counselling.pdf B.Ed. 4th SemesterGuidance_and_Counselling.pdf B.Ed. 4th Semester
Guidance_and_Counselling.pdf B.Ed. 4th Semester
Atul Kumar Singh
 
Home assignment II on Spectroscopy 2024 Answers.pdf
Home assignment II on Spectroscopy 2024 Answers.pdfHome assignment II on Spectroscopy 2024 Answers.pdf
Home assignment II on Spectroscopy 2024 Answers.pdf
Tamralipta Mahavidyalaya
 
"Protectable subject matters, Protection in biotechnology, Protection of othe...
"Protectable subject matters, Protection in biotechnology, Protection of othe..."Protectable subject matters, Protection in biotechnology, Protection of othe...
"Protectable subject matters, Protection in biotechnology, Protection of othe...
SACHIN R KONDAGURI
 
Sha'Carri Richardson Presentation 202345
Sha'Carri Richardson Presentation 202345Sha'Carri Richardson Presentation 202345
Sha'Carri Richardson Presentation 202345
beazzy04
 

Recently uploaded (20)

special B.ed 2nd year old paper_20240531.pdf
special B.ed 2nd year old paper_20240531.pdfspecial B.ed 2nd year old paper_20240531.pdf
special B.ed 2nd year old paper_20240531.pdf
 
CACJapan - GROUP Presentation 1- Wk 4.pdf
CACJapan - GROUP Presentation 1- Wk 4.pdfCACJapan - GROUP Presentation 1- Wk 4.pdf
CACJapan - GROUP Presentation 1- Wk 4.pdf
 
2024.06.01 Introducing a competency framework for languag learning materials ...
2024.06.01 Introducing a competency framework for languag learning materials ...2024.06.01 Introducing a competency framework for languag learning materials ...
2024.06.01 Introducing a competency framework for languag learning materials ...
 
Francesca Gottschalk - How can education support child empowerment.pptx
Francesca Gottschalk - How can education support child empowerment.pptxFrancesca Gottschalk - How can education support child empowerment.pptx
Francesca Gottschalk - How can education support child empowerment.pptx
 
Acetabularia Information For Class 9 .docx
Acetabularia Information For Class 9  .docxAcetabularia Information For Class 9  .docx
Acetabularia Information For Class 9 .docx
 
Thesis Statement for students diagnonsed withADHD.ppt
Thesis Statement for students diagnonsed withADHD.pptThesis Statement for students diagnonsed withADHD.ppt
Thesis Statement for students diagnonsed withADHD.ppt
 
Operation Blue Star - Saka Neela Tara
Operation Blue Star   -  Saka Neela TaraOperation Blue Star   -  Saka Neela Tara
Operation Blue Star - Saka Neela Tara
 
The Challenger.pdf DNHS Official Publication
The Challenger.pdf DNHS Official PublicationThe Challenger.pdf DNHS Official Publication
The Challenger.pdf DNHS Official Publication
 
The French Revolution Class 9 Study Material pdf free download
The French Revolution Class 9 Study Material pdf free downloadThe French Revolution Class 9 Study Material pdf free download
The French Revolution Class 9 Study Material pdf free download
 
Digital Tools and AI for Teaching Learning and Research
Digital Tools and AI for Teaching Learning and ResearchDigital Tools and AI for Teaching Learning and Research
Digital Tools and AI for Teaching Learning and Research
 
June 3, 2024 Anti-Semitism Letter Sent to MIT President Kornbluth and MIT Cor...
June 3, 2024 Anti-Semitism Letter Sent to MIT President Kornbluth and MIT Cor...June 3, 2024 Anti-Semitism Letter Sent to MIT President Kornbluth and MIT Cor...
June 3, 2024 Anti-Semitism Letter Sent to MIT President Kornbluth and MIT Cor...
 
Honest Reviews of Tim Han LMA Course Program.pptx
Honest Reviews of Tim Han LMA Course Program.pptxHonest Reviews of Tim Han LMA Course Program.pptx
Honest Reviews of Tim Han LMA Course Program.pptx
 
Language Across the Curriculm LAC B.Ed.
Language Across the  Curriculm LAC B.Ed.Language Across the  Curriculm LAC B.Ed.
Language Across the Curriculm LAC B.Ed.
 
Unit 2- Research Aptitude (UGC NET Paper I).pdf
Unit 2- Research Aptitude (UGC NET Paper I).pdfUnit 2- Research Aptitude (UGC NET Paper I).pdf
Unit 2- Research Aptitude (UGC NET Paper I).pdf
 
Biological Screening of Herbal Drugs in detailed.
Biological Screening of Herbal Drugs in detailed.Biological Screening of Herbal Drugs in detailed.
Biological Screening of Herbal Drugs in detailed.
 
The geography of Taylor Swift - some ideas
The geography of Taylor Swift - some ideasThe geography of Taylor Swift - some ideas
The geography of Taylor Swift - some ideas
 
Guidance_and_Counselling.pdf B.Ed. 4th Semester
Guidance_and_Counselling.pdf B.Ed. 4th SemesterGuidance_and_Counselling.pdf B.Ed. 4th Semester
Guidance_and_Counselling.pdf B.Ed. 4th Semester
 
Home assignment II on Spectroscopy 2024 Answers.pdf
Home assignment II on Spectroscopy 2024 Answers.pdfHome assignment II on Spectroscopy 2024 Answers.pdf
Home assignment II on Spectroscopy 2024 Answers.pdf
 
"Protectable subject matters, Protection in biotechnology, Protection of othe...
"Protectable subject matters, Protection in biotechnology, Protection of othe..."Protectable subject matters, Protection in biotechnology, Protection of othe...
"Protectable subject matters, Protection in biotechnology, Protection of othe...
 
Sha'Carri Richardson Presentation 202345
Sha'Carri Richardson Presentation 202345Sha'Carri Richardson Presentation 202345
Sha'Carri Richardson Presentation 202345
 

Application Of Statistical Process Control In Manufacturing Company To Understand Variability

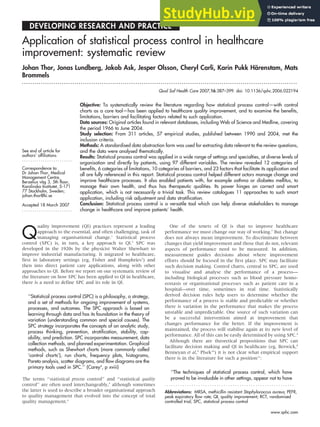
  • 1. DEVELOPING RESEARCH AND PRACTICE Application of statistical process control in healthcare improvement: systematic review Johan Thor, Jonas Lundberg, Jakob Ask, Jesper Olsson, Cheryl Carli, Karin Pukk Härenstam, Mats Brommels . . . . . . . . . . . . . . . . . . . . . . . . . . . . . . . . . . . . . . . . . . . . . . . . . . . . . . . . . . . . . . . . . . . . . . . . . . . . . . . . . . . . . . . . . . . . . . . . . . . . . . . . . . . . . . . . . . . . . . . . . . . . . . . . . . . See end of article for authors’ affiliations . . . . . . . . . . . . . . . . . . . . . . . . Correspondence to: Dr Johan Thor, Medical Management Centre, Berzelius väg 3, 5th floor, Karolinska Institutet, S-171 77 Stockholm, Sweden; johan.thor@ki.se Accepted 18 March 2007 . . . . . . . . . . . . . . . . . . . . . . . . Qual Saf Health Care 2007;16:387–399. doi: 10.1136/qshc.2006.022194 Objective: To systematically review the literature regarding how statistical process control—with control charts as a core tool—has been applied to healthcare quality improvement, and to examine the benefits, limitations, barriers and facilitating factors related to such application. Data sources: Original articles found in relevant databases, including Web of Science and Medline, covering the period 1966 to June 2004. Study selection: From 311 articles, 57 empirical studies, published between 1990 and 2004, met the inclusion criteria. Methods: A standardised data abstraction form was used for extracting data relevant to the review questions, and the data were analysed thematically. Results: Statistical process control was applied in a wide range of settings and specialties, at diverse levels of organisation and directly by patients, using 97 different variables. The review revealed 12 categories of benefits, 6 categories of limitations, 10 categories of barriers, and 23 factors that facilitate its application and all are fully referenced in this report. Statistical process control helped different actors manage change and improve healthcare processes. It also enabled patients with, for example asthma or diabetes mellitus, to manage their own health, and thus has therapeutic qualities. Its power hinges on correct and smart application, which is not necessarily a trivial task. This review catalogues 11 approaches to such smart application, including risk adjustment and data stratification. Conclusion: Statistical process control is a versatile tool which can help diverse stakeholders to manage change in healthcare and improve patients’ health. Q uality improvement (QI) practices represent a leading approach to the essential, and often challenging, task of managing organisational change.1 Statistical process control (SPC) is, in turn, a key approach to QI.2 SPC was developed in the 1920s by the physicist Walter Shewhart to improve industrial manufacturing. It migrated to healthcare, first in laboratory settings (eg, Fisher and Humphries3 ) and then into direct patient care applications, along with other approaches to QI. Before we report on our systematic review of the literature on how SPC has been applied to QI in healthcare, there is a need to define SPC and its role in QI. ‘‘Statistical process control (SPC) is a philosophy, a strategy, and a set of methods for ongoing improvement of systems, processes, and outcomes. The SPC approach is based on learning through data and has its foundation in the theory of variation (understanding common and special causes). The SPC strategy incorporates the concepts of an analytic study, process thinking, prevention, stratification, stability, cap- ability, and prediction. SPC incorporates measurement, data collection methods, and planned experimentation. Graphical methods, such as Shewhart charts (more commonly called ‘control charts’), run charts, frequency plots, histograms, Pareto analysis, scatter diagrams, and flow diagrams are the primary tools used in SPC.’’ (Carey4 , p xviii) The terms ‘‘statistical process control’’ and ‘‘statistical quality control’’ are often used interchangeably,5 although sometimes the latter is used to describe a broader organisational approach to quality management that evolved into the concept of total quality management.6 One of the tenets of QI is that to improve healthcare performance we must change our way of working.7 But change does not always mean improvement. To discriminate between changes that yield improvement and those that do not, relevant aspects of performance need to be measured. In addition, measurement guides decisions about where improvement efforts should be focused in the first place. SPC may facilitate such decision making. Control charts, central to SPC, are used to visualise and analyse the performance of a process— including biological processes such as blood pressure homo- eostasis or organisational processes such as patient care in a hospital—over time, sometimes in real time. Statistically derived decision rules help users to determine whether the performance of a process is stable and predictable or whether there is variation in the performance that makes the process unstable and unpredictable. One source of such variation can be a successful intervention aimed at improvement that changes performance for the better. If the improvement is maintained, the process will stabilise again at its new level of performance. All of this can be easily determined by using SPC.4 Although there are theoretical propositions that SPC can facilitate decision making and QI in healthcare (eg, Berwick,8 Benneyan et al,9 Plsek10 ) it is not clear what empirical support there is in the literature for such a position11 : ‘‘The techniques of statistical process control, which have proved to be invaluable in other settings, appear not to have Abbreviations: MRSA, methicillin resistant Staphylococcus aureus; PEFR, peak expiratory flow rate; QI, quality improvement; RCT, randomised controlled trial; SPC, statistical process control 387 www.qshc.com
  • 2. realised their potential in health care. ... Is this because they are, as yet, rarely used in this way in health care? Is it because they are unsuccessful when used in this way and thus not published (publication bias)? Or is it that they are being successfully used but not by people who have the inclination to share their experience in academic journals?’’ (p 200) The present systematic review aimed to answer these questions. We examined the literature for how and where SPC has been applied in QI of clinical/patient care processes and the benefits, limitations, barriers and facilitating factors related to such application. MATERIALS AND METHODS Drawing on the principles and procedures for systematic review of QI interventions12 we searched for articles on the application of SPC in healthcare QI published between 1966 and June 2004 (see appendix A) in the following databases: Web of Science, Ovid Medline(R), EMBASE, CINAHL (Cumulative Index to Nursing and Allied Health Literature), PsycInfo, and the Centre for Reviews and Dissemination databases. We also included articles found by searching reference lists or from elsewhere which we were aware of, if they met our inclusion criteria: original empirical studies of SPC application in improvement of clinical/patient care processes in healthcare organisations, published in English. We excluded articles dealing with application of SPC in laboratory or technical processes (eg, film processing) and in surveillance/monitoring (unless they also contained empirical data about improvement efforts), as well as tutorials (unless they contained empirical case studies), letters, book reviews and dissertations. We reviewed abstracts, when available, or else other information about the publication provided in the database (eg, publication type such as letters, book reviews or original articles). Articles that did not meet the inclusion criterion were excluded. We retrieved and read the full text of the remaining articles, again excluding the articles that did not meet the inclusion criterion. We developed, pilot tested and modified a data abstraction form which we then used to consistently capture information of relevance to our review questions on reading the full text articles. The information recorded was: whether and how the article met the inclusion criterion; study objective(s); study design; whether the study empirically compared application of SPC with any other method for process data display and analysis; reported benefits, limitations, barriers and facilitating factors related to SPC; organisational setting; country where study was conducted; clinical specialty; unit of analysis; variables for SPC analysis; and other observations. Some questions in the form required a yes/no or brief response (eg, country where study was conducted) and others required answers in the form of direct quotes from the article or the a summary of the article written by the reviewer. Each article was read and data abstracted by one member of the review team (the coauthors of this review). Following this, all the data abstraction forms were reviewed by the first author, who solicited clarification and checked for any missing or incom- plete data to ensure consistency in reporting across all articles reviewed. He also conducted the initial data synthesis, which was then reviewed by the entire team. We determined the study design for each article and whether the investigators intended to test the utility of SPC application, alone or in combination with other interventions. In several articles, the study design or study objectives were not explicitly stated. Our determination of such intention in such cases was based on our reading of the full text papers. Simple descriptive statistics—for example, the number of publications per year of publication or per country—were used to characterise the included studies. The qualitative nature of our research questions and of the abstracted data shaped our analysis and synthesis of findings regarding benefits, limita- tions, SPC variables, etc.13 The abstracted data was reviewed one question at a time and data from each article was classified into one or more thematic categories, each with a descriptive heading. Informed by our present understanding of QI and healthcare, we developed these categories as we reviewed the data, rather than using categories derived a priori from theory. For data that did not fit into an existing category, we developed a new one. Thus the categories emerged as we synthesised the data. We report the categorised data in tabular form, illustrated with examples, and give the references of all the source studies. To strengthen our review through investigator triangula- tion,14 we sought feedback on an earlier version of this manuscript from two SPC experts: one was the most frequent coauthor in the included studies and the other was an expert on SPC application also in settings other than healthcare. Their comments helped us refine our data synthesis and distil our findings. RESULTS The database searches yielded 311 references. The initial review (abstracts etc.) yielded 100 articles which we read in full text form. Of these, 57 articles met the inclusion criteria and have been included in the review.15–71 To characterise the body of liferature, figure 1 shows the year of publication and whether the studies were conducted in USA or elsewhere (further specified below); table 1 gives the study designs and objectives—whether or not to test SPC utility. Most of the articles (45/57) concerned application of SPC in healthcare improvement in the USA.15–35 37–40 42 43 45 47 49–56 59 60 63 67–71 While the first US-based article was published in 1990, the non-US articles were published between 1998 and 2003: three articles were from the UK,61 62 66 three were from Switzerland,36 41 46 and one each were from Australia,58 Finland,65 France,57 Indonesia,44 Norway64 and Spain.48 The intention to test the utility of SPC is exemplified by a study aiming to reduce the rate of acquisition of methicillin-resistant Staphylococcus aureus (MRSA) on wards and units at Glasgow Royal Infirmary hospitals.61 Annotated control charts displaying data on MRSA acquisition were fed back monthly to medical staff, managers and hotel services. Sustained reductions in the rate of acquisition from the baseline, which could not otherwise Figure 1 The number of included articles by year of publication. (A total of 55 articles were published in 1990–2003; the two articles from 2004 are not included in this graph since the database searches were conducted in June 2004.) Black bars: studies conducted in the USA; grey bars: studies conducted outside the USA. 388 Thor, Lundberg, Ask, et al www.qshc.com
  • 3. be accounted for, started 2 months later. In contrast, investi- gators at a paediatric emergency department used SPC to demonstrate a decline in the rate of contamination following the introduction of a new approach to drawing blood for culture specimens,68 but the study had no intention to test the utility of SPC per se. To characterise the content of the articles, we first present how and where SPC has been applied to healthcare QI. Tables 2– 4 present the study settings (ie, hospital etc. where SPC was applied; table 2), the field of healthcare (ie, specialties or forms of care; table 3), and the units of analysis (table 4). Table 5 enlists the 97 distinct SPC variables that have been reported. Tables 6–9 convey our synthesis of the reported benefits, limitations, barriers and facilitating factors related to SPC application. For each category, we have given explanations or examples and references to the source articles. DISCUSSION SPC has been applied to healthcare improvement in a wide range of settings and specialties, at diverse levels of organisa- tions and directly by patients, using many types of variables (fig 1, tables 2–5). We found reports of substantial benefits of SPC application, as well as important limitations of, barriers to and factors that facilitate SPC application (tables 6–9). These findings indicate that SPC can indeed be a powerful and versatile tool for managing changes in healthcare through QI. Besides helping diverse stakeholders manage and improve healthcare processes, SPC can also help clinicians and patients understand and improve patients’ health when applied directly to health indicators such as PEFR in asthma or blood sugar concentrations in diabetes. In healthcare, the ‘‘study subject’’ can thus also be an active agent in the process, as when patients apply SPC to their own health. Several studies indicated the empowering effects this may have on patients.35 38 40 50 SPC application thus has therapeutic potential as it can help patients manage their own health. We agree with Alemi and Neuhauser70 that this potential merits further investigation. Most of the included articles concerned application of SPC in healthcare improvement in the USA. Articles from other countries appeared only towards the end of the study period Table 1 Study design and objectives of the studies included in the systematic review* Study design Number of articles References Number of articles in each study design category intending to test utility of SPC References Case study 28 16, 17, 19–21, 24, 26, 29, 33, 34, 36, 39, 41, 44–49, 53, 55, 57, 58, 61, 63–65, 67 16 16, 17, 20, 24, 26, 36, 41, 44, 47, 48, 57, 61, 63–65, 67 Tutorial with illustrative case study 23 15, 18, 22, 23, 25, 27, 30, 31, 35, 37, 38, 40, 42, 50–52, 54, 59, 62, 66, 69–71 3 22, 25, 30 Observational study of change in clinical procedure(s) using historical controls 2 43, 68 0 Controlled before-and-after intervention studies 2 28, 56 1 56 Patient case reports 2 32, 60 2 32, 60 *The study designs are reported in order of frequency. Table 2 How and where SPC was applied: study settings* Study setting Number of articles References Hospital settings (total) 40 Entire hospital 14 18, 21, 24, 25, 27, 31, 33, 37, 42, 44, 54, 56, 61, 69 Hospital department 12 17, 22, 28, 30, 39, 45, 47, 53, 57, 64, 68, 71 Hospital departments in collaboration 5 36, 41, 43, 46, 48 Hospital outpatient clinic 5 29, 32, 49, 60, 67 Hospital clinical chemistry laboratory 2 19, 58 Hospital outpatient clinics in collaboration 1 55 Hospital wards 1 65 Non-hospital outpatient settings (total) 12 Outpatient single specialty clinic 5 35, 37, 40, 50, 70 Primary care centre 4 34, 52, 62, 66 Outpatient multispecialty clinic 2 15, 59 Ambulatory nursing centre clinic 1 23 Other settings (total) 6 Healthcare system 2 26, 63 Nursing home 2 16, 51 Mental health residential facility 1 20 Not specified 1 38 *The study settings are divided in three groups, each consisting of several different settings. One article reported data from two settings, hence a total of 58 settings are reported. Table 3 How and where SPC was applied: fields of healthcare* Field of healthcare (specialty) Number of articles References Anaesthesia—intensive care 12 22, 25, 33, 36, 39, 41–43, 46, 48, 57, 64 Family practice—primary care 7 34, 52, 55, 59, 62, 63, 66 Emergency medicine 6 19, 45, 46, 48, 53, 68 Cardiac (cardiothoracic) surgery 5 22, 30, 42, 47, 56 Cardiology 5 22, 32, 46, 48, 56 Internal medicine 4 15, 32, 37, 50 Surgery 4 42, 43, 49, 59 Asthma–allergology 3 35, 40, 70 Nursing 3 23, 24, 65 Clinical chemistry 2 19, 58 Nursing home 2 16, 51 Urology 2 36, 41 Endocrinology 1 55 Haematology 1 67 Mental health 1 20 Orthopaedics 1 28 Oncology 1 67 Otolaryngology 1 29 Paediatrics 1 59 Radiology 1 17 Rehabilitation medicine 1 60 *The specialties or fields of healthcare (eg, nursing homes) where SPC was applied are rank ordered according to the number of articles in which such application was reported. Whereas 11 articles did not specify a specialty or field of healthcare, several articles included more than one specialty. Systematic review of SPC in healthcare QI 389 www.qshc.com
  • 4. (fig 1). We have no explanation for this finding, but we speculate that it is related to differences between US and other healthcare systems with regard to QI awareness and imple- mentation.73 Only 22 studies included in the review were intended to test the utility of SPC (table 1). Of the four controlled studies, only one included a control chart in the intervention (as a minor component which did not fully exploit the features of SPC). In 35 articles we did not find an intention to test the utility of SPC application. In those cases, SPC was applied for other reasons (ie, to evaluate the impact of other interventions). Even though many articles thus did not address the utility of SPC, all studies offered information—to varying degrees—relevant to our review’s question of how SPC has been applied to healthcare. The utility of SPC is reflected in benefits reported regarding SPC application (table 6). SPC has been applied in over 20 specialties or fields of healthcare, at a wide range of levels (tables 3 and 4), suggesting that SPC has broad applicability in healthcare. The dominance of anaesthesia and intensive care can be explained in large part by the fact that many studies included their services in conjunction with other specialties. This reflects the way in which anaesthesia has a vital supporting role in many clinical care processes. The 97 SPC variables reported (table 5) demonstrate a diversity of situations in which SPC has been applied, ranging from process indicators of patients’ health to health outcomes and many aspects of healthcare processes and organisational performance. This indicates that SPC is a versatile QI tool. The benefits of SPC application (table 6) mirror those given in books and tutorials on SPC (exemplified by the quote in the Introduction to this review). As noted in a report from a top- ranked healthcare system which has applied SPC widely: ‘‘Among the most powerful quality management tools that IHC [Intermountain Health Care, USA] has applied is statistical process control, SPC. Most notable among those tools are control charts. Under optimal conditions, these graphical depictions of process performance allow partici- pants to know what is happening within their processes as ‘real time’ data enable them to make appropriate decisions. The capability of truly understanding processes and variation in a timely manner has resulted in the most dramatic, immediate, and ongoing improvements of any management technique applied at IHC.’’ (Shaha,26 p 22) The limitations of SPC application (table 7) identified by this review are important, and yet perhaps less emphasised than the benefits in books and tutorials on SPC. SPC cannot solve all problems and must be applied wisely. There are many opportu- nities to ‘‘go wrong’’, as illustrated by the case where incorrect application was highlighted by other authors (limitation number 5 in table 7). In several cases, our own understanding of SPC suggested that investigators had not used it correctly or fully (eg, standard decision rules to detect special causes were not applied to identify process changes). In the worst case scenario, incorrect application of SPC could lead to erroneous conclusions about process performance and waste time, effort and spirit and even contribute to patient harm. In the more authoritative studies we reviewed, co-investigators included experts in industrial engineer- ing or statistics or authors who otherwise had developed considerable expertise in SPC methodology. On the basis of these observations, we conclude that although SPC charts may be easy to useeven forpatients, clinicians ormanagerswithout extensive SPC training, they may not be equally simple to construct correctly. To apply SPC is, paradoxically, both simple and difficult at the same time. Its power hinges on correct and smart application, which is not necessarily a trivial task. The key, then, is to develop or recruit the expertise necessary to use SPC correctly and fully and to make SPC easy for non-experts to use, before using it widely. Autocorrelation is another limitation of SPC highlighted by this review. Our review, and published books, offer limited advice on how to manage it: ‘‘There is no single acceptable way of dealing with autocorrelation. Some would say simply to ignore it. [Others] would disagree and suggest various measures to deal with the phenomenon. One way is to avoid the autocorrelation by sampling less frequently. ... Others argue against plotting autocorrelated data on control charts and recommend that the data be plotted on a line chart (without any centerline or control limits).’’ (Carey,4 p 68) Just over a quarter of the articles reported barriers to SPC application (table 8). The three broad divisions of barriers— people, data and chart construction, and IT—indicate where extra care should be taken when introducing SPC in a healthcare organisation. Ideas on how to manage the limita- tions of and barriers to SPC application can be found among the factors reported to facilitate SPC application (table 9). They deal with, and go beyond, the areas of barriers we found. We noted the prominence of learning and also of focusing on topics of interest to clinicians and patients. The 11 categories under the heading ‘‘Smart application of SPC can be helpful’’ contain valuable approaches that can be used to improve SPC application. Examples include risk adjustment51 52 71 and stra- tification30 37 59 to enable correct SPC analysis of data from heterogeneous populations of patients (or organisational units). Basic understanding of SPC must be taught to stakeholders and substantial skill and experience is required to set up successful SPC application. Experts, or facilitators, in healthcare organisations can help, as indicated in table 9, and as we have described for other QI methods.74 Table 4 How and where SPC was applied: units of analysis* Unit of analysis Number of articles References Single patients (including patients using control charts themselves) 9 16, 22, 32, 35, 38, 40, 50, 60, 70 Single clinicians 4 37, 52, 62, 66 Outpatient clinic 3 29, 49, 59 An ambulatory nursing centre clinic 1 23 Primary care/family medicine centre 2 34, 63 Population(s) of patients in nursing home(s) 2 16, 51 Staff at mental health residential facility living areas 1 20 Hospital wards 5 26, 33, 56, 61, 65 Department process level 15 17, 19, 21, 25, 27, 30, 39, 42, 45, 53, 54, 57, 64, 68, 71 Hospital department and community- based orthopaedic surgeons 1 28 Microsystem(s) 6 15, 37, 43, 47, 50, 67 Process that involves more than one department 6 36, 41, 46, 48, 55, 58 Entire hospital 6 18, 21, 24, 31, 44, 69 *The units of analysis—the levels at which SPC was applied—are ordered according to the degree of aggregation (from individual patients to entire organisations). Some articles reported data from more than one unit of analysis. A microsystem is defined as ‘‘a small group of people who work together on a regular basis to provide care to discrete subpopulations of patients’’.72 The distinction between microsystems and other categories is not absolute but a matter of judgment. 390 Thor, Lundberg, Ask, et al www.qshc.com
  • 5. Table 5 SPC variables* I Biomedical variables Blood glucose and HbA1c measures 1 HbA1c level in groups of diabetic patients52 2 Blood glucose, as a daily group average, for intensive care patients on parenteral or enteral nutrition 33 3 Average blood glucose levels among intensive care unit patients on total parenteral nutrition per week25 4 Standard deviation of blood glucose levels among intensive care unit patients on total parenteral nutrition per week 25 5 Capillary blood glucose measurements of individual patients56 6 Individual patient blood glucose measurements 38 7 Individual patient fasting blood sugar measurements37 50 8 Average of five consecutive HbA1c measurements in diabetic patients cared for by one clinician50 Peak expiratory flow rates (PEFR) 9 Daily am (ie, morning) pre-bronchodilator PEFR in asthmatic patients (litres/min)35 40 Pain 10 Daily individual patient visual analogue pain scale recordings60 Cardiovascular system measures 11 Blood pressure22 23 32 12 Heart rate 22 32 13 Central venous pressure22 Urinary output 14 Urinary output (during intensive care)22 Oxygen saturation 15 Oxygen saturation (during intensive care)22 II Biomedical measurement variable 16 Blood pressure measurement error (mm Hg)23 III Other variables related to patient health 17 Patient fall rate (number of patient falls/number of cases per month)51 18 Days in between asthma attacks 70 19 Nausea on day 3 after administration of chemotherapy, as reported by patients on a scale, displayed as the average in each sample of four consecutive patients67 20 Incontinence volume (of fluid) for individual incontinent patients (in ‘‘a change-program’’) on scheduled inspections16 21 Volume of irrigation fluid absorbed during endoscopic renal pelvic surgery 41 IV Clinical management variables Time to complete (part of) a clinical process 22 Time between patient check-in and interpretation of a preoperative radiograph 17 23 Door-to-needle time: ‘‘the time span between hospital admission and the initiation of thrombolytic therapy in patients with acute myocardial infarction’’ 46 48 24 Average length of stay for inpatients with congestive heart failure54 25 Length of stay after cardiac surgery (risk adjusted and transformed)71 26 Average length of stay for total hip replacement patients 28 27 Intensive care unit admission time42 28 Average postoperative (bowel surgery) length of stay (in days) per month 42 29 Admission time (from ‘‘sign in’’ to ‘‘patient in room’’) 18 31 30 Duration of intravenous antibiotic treatment for patients with pneumonia37 31 Time to administration of antibiotic treatment for patients with pneumonia 37 32 Average length of hospital stay for inpatients with pneumonia37 33 Time to extubation after coronary artery bypass grafting (CABG) surgery (hours)47 34 Length of stay in the intensive care unit after CABG (days) 47 35 Total hospital length of stay after CABG (days)47 36 Laboratory turnaround time for blood tests 19 27 37 Average postoperative length of stay after non-emergent CABG surgery, per quarter 30 38 Time from receiving a referral to first patient contact (days)49 Time, or number of consecutive cases, between events 39 Time between deaths in chronic obstructive pulmonary disease54 40 Number of successful elective CABG surgeries between cases with mortality 42 41 Number of successful CABG surgeries between cases with complications42 42 Number of successful bowel resection operations between cases with complications42 (see also variable 18 for another example) Rate of events in a clinical process (‘‘defect rate’’ or ‘‘success rate’’) 43 Percentage of chief complaints (of patients in an emergency department) charted in free text (as opposed to coded) in the medical record, per day53 44 Percentage of anaesthesia sessions with at least one ‘‘significant anaesthetic event’’ 57 45 Mortality in patients with congestive heart failure 54 46 Proportion of low birthweight infants54 47 Percentage of intravenous medication administration events associated with an error 24 48 Occurrence of four intraoperative adverse events, of relevance to anaesthetic quality and safety: inadequate analgesia during brachial plexus block, emergence from general anaesthesia, intubation problems and medication errors 64 49 Proportion of patients with excessive absorption of irrigation fluid during transurethral resection of the prostate36 50 Mortality after CABG 42 51 Proportion of patients on enteral, or parenteral, nutrition with blood glucose levels outside a (clinical management) target range 33 52 Daily percentage of satisfied requests for medical records at a paediatric outpatient clinic 18 Systematic review of SPC in healthcare QI 391 www.qshc.com
  • 6. 53 ‘‘Guideline non-adherence rate’’; proportion of chemotherapy administrations in which guideline recommendations to prevent nausea were not followed 67 54 Percentage of all blood cultures growing contaminants per month 68 55 Proportion of intensive care unit patients on total parenteral nutrition with blood glucose values that were higher than the given target (.11.1 mmol/l (.200 mg/dl)) per week 25 56 Percentage of all acute bronchitis visits during which a b-agonist was prescribed, per month34 57 Percentage of all acute bronchitis visits during which an antibiotic was prescribed, per month34 58 Percentage of outpatient surgical procedures per month (of all procedures) 43 59 Proportion of cases where tests were delayed or not reported in a timely fashion15 60 Proportion of incontinent patients (in ‘‘a toileting program’’) who were wet on scheduled inspections 16 61 Monthly percentage of emergency department patients who leave without being seen 45 62 Percentage of inpatients on the ward in each of three acuity levels (low, medium and high) per day26 63 The quarterly incidence rate of eight variables among cardiac surgery patients: perioperative death, perioperative myocardial infarction; cerebrovascular accident; re-exploration for bleeding or tamponade; atrial fibrillation; leg wound; acute tubular necrosis; sternal infection; acute renal failure30 64 Rates of total and major complications per patient after cardiac surgery 30 65 Proportion of first case starts each day in the operating theatres that are delayed due to the department of anaesthesia 39 66 Proportion of cases in which the turnaround time between cases exceeded the given performance standard 39 Number of defects/events or occurrences in a clinical process 67 Number of medication errors, per month 24 68 Number of out-of-hours ‘‘stat’’ (blood test analyses) requests received each week58 69 Number of MRSA cases per month 61 70 Number of diabetes patients (seen at office visits) with HbA1c measurements, per month34 71 Number of patients (seen at office visits) at a department of family medicine with a recorded diagnosis of tobacco abuse, per month 34 72 Total number of surgical procedures per month43 73 Number of patients with diarrhoea admitted to the hospital, per week 44 74 Number of referrals per month for patients with diabetes from primary care to endocrinology 55 75 Number of new referrals per work day49 76 Net number of new patients ( = practice growth) 63 Clinical decision making 77 (Square root of) the number of cases per general practitioner (GP) diagnosed as having tonsillitis versus number of cases diagnosed as having any throat infection62 78 (Square root of) the number of GP patients diagnosed as having tonsillitis and non-tonsillar throat infection, who receive antibiotics 62 79 (Square root of) the number of GP cases with any throat infection diagnosis who received antibiotics62 80 (Square root of) the number of GP cases with a diagnosis of sore throat in which antibiotics were not prescribed versus the number of cases in which antibiotics were prescribed 66 V Financial resources variables Cost of care 81 Average cost per procedure (total hip replacement)28 82 Staffing expense per shift, depicted as variance in US$ from budget 26 83 Staffing expense per 24-h period, depicted as variance in US$ from budget26 Productivity and efficiency 84 Relative value unit (RVU) production per provider FTE (full-time equivalent) ( = provider productivity)63 85 FTE support staff per FTE provider ( = practice efficiency)63 Organisational financial performance 86 Net patient revenue per relative value unit (a primary care physician‘s practice) ( = practice profitability)63 87 Provider cost as a percent of net revenue ( = practice cost management) 63 88 Non-provider cost as a percentage of net revenue ( = practice cost management)63 VI Variables relating to the experience of healthcare Patient satisfaction indicators 89 ‘‘Physician care scale score’’, which is the average of patient survey responses to 10 questions 59 90 Patient satisfaction with (nursing) care 65 91 Percentage of patients (who responded to a patient satisfaction survey) whose response was that the overall visit was excellent 29 Other experience with care 92 Patient rating of assistance in solving the patient’s current health problem 65 93 Staff satisfaction with (nursing) care65 94 Staff rating of assistance in solving patients’ current health problems65 VII Variables related to clinical staff supervision Clinical staff supervision 95 Active treatment monitoring index, based on observing staff performance in clinical encounters and assessing nine criteria20 Completion of mandatory staff training 96 Percentage of employees who have completed mandatory safety training21 VIII Other variables 97 ‘‘A temperature signal’’ (of unspecified origin; it is probably not body temperature since it varies around 74˚F or 23˚C). ‘‘[T]he signal could just as easily have been bed occupancy, ED wait time, expense per equivalent discharge, or staffed care days.’’69 *The variables are divided into eight categories and then further subdivided under subheadings in a category. Several articles reported more than one SPC variable. Table 5 Continued 392 Thor, Lundberg, Ask, et al www.qshc.com
  • 7. We found more information on SPC benefits and facilitating factors than on limitations and barriers, and this may represent a form of publication bias, as indicated by the quote in the Introduction.11 We did not find any study that reported failed SPC application. We can speculate that there have been situations when SPC application failed, just as there must be many cases of successful SPC application that have not been reported in the literature. Studies of failed SPC application efforts, as well as studies designed to identify successful ways to apply SPC to manage change, would help inform future SPC Table 6 Benefits of using SPC to improve clinical processes* Examples/explanations SPC facilitated and documented healthcare process improvement 1 SPC application helped people assess the impact of changes to the process19 24 27 30 32–34 37 42 43 45 52 53 55 57 58 60 64 67 68 Many articles reported a helpful role of SPC in determining the effects of interventions made to healthcare processes. Examples include successful effects, adverse effects or a lack of effect 2 SPC application contributed (led) to improvement of healthcare processes16 17 20 26 28 30 31 36 37 46 53 56 65 Several articles reported improvement of a healthcare process and attributed that improvement, more or less explicitly, to improvement efforts in general and SPC application in particular (the foundations for such attribution were methodologically weak—for instance, case reports without comparisons). For example, investigators evaluating the ‘‘door-to-needle-time’’ (DTNT) for thrombolytic treatment of patients with acute myocardial infarction (AMI) using control charts found that ‘‘in the beginning there was considerable variability of DTNT signifying that the process of in-hospital management of patients with AMI was out of statistical control. Shortly after the initiation of formal process analysis DTNTs were reduced significantly and remained within a narrow range, now showing a stable and statistically controlled pattern. Thus, process quality was significantly improved by our efforts’’ (Bonetti et al,46 p 315) 3 SPC application helped people identify areas for improvement21 26 40 42 47 49 58 70 Several investigators identified process performance that was not satisfactory, and hence in need of improvement, using SPC. For instance, investigators applying SPC to the care of patients with asthma concluded that when the care process yields a range of breathing that ‘‘is clinically problematic, the care process should be redesigned and monitored to ensure that the problem has been corrected’’ (Boggs et al,40 p 175) SPC was a useful tool for healthcare management 4 SPC application helped people distinguish special from common cause variation15 30 35 38 39 41 42 45 49 51 54 59 64 70 71 Reflecting one of the tenets of SPC, many articles reported how SPC helped people identify common cause and special cause variation, and understand the difference. Investigators applying SPC to surgical care, for instance, concluded that ‘‘plotting data over time and using control chart techniques will tell us whether the variation in a surgical process is stable and predictable or whether variation signals a significant change in the process’’ (Levett and Carey,42 p 358) 5 SPC seen as a valuable QI tool which was easy to use 18 19 25 29 30 38 40 42 47 48 50 56 62 69 70 Many articles report the usefulness of SPC as a tool in healthcare process management and improvement. Investigators at a cardiac surgery department, for example, designed a system for automated data collection and generation of control chart for critical pathway adherence, and concluded that it was ‘‘a cost effective method for providing timely feedback. The benefits of timely feedback with the control chart method are strongly suggested by this study’’ (Ratcliffe et al, 47 p 1821) 6 SPC enabled valuable prediction of future process performance30 35 40 A few studies reported the value of being able to predict future performance of stable processes. A predictable outcome was beneficial to the patient, doctor and insurer.30 In asthma care, such prediction enabled clinicians and patients to decide whether to maintain the current care regimen or alter it to improve future outcomes35 40 7 SPC helped describe and quantify process variability 22 23 35 SPC allowed characterisation of process variability, including variability present in blood pressure measurement 23 SPC helped process stakeholders 8 SPC enabled patients to be partners in clinical management (and research)35 38 40 50 60 SPC enabled patients with chronic conditions to better understand and manage—alone or in partnership with clinicians—their condition, specifically, diabetes mellitus, 38 50 hypertension, 38 muscular pain 60 and asthma.35 SPC has also been proposed as a research strategy whereby patients can be active partners in data collection and analysis.38 In asthma care, for example, when patients control-chart their breathing function the benefits include ‘‘knowing each patient’s signals and their meaning; natural limits of the current care process; and having the ability to anticipate this patient’s future level of function given no change in his/her care process[. This] enhances both the patient’s and physician’s ability to meaningfully engage in the process of continuous quality improvement of asthma. [It] elevates the level of communication and dialogue between patients and physicians exponentially beyond that generated by traditional run chart information’’ (Boggs et al, 35 p 561) 9 SPC application improved communication between process actors35 36 52 63 70 SPC provided a common language and facilitated communication between managers and clinicians, or between clinicians and patients. See the example above 10 SPC application enabled (better) informed decision making 21 26 35 44 54 61 63 66 SPC helped inform decision making in healthcare organisation governance and management 21 26 44 54 61 63 and in clinical decision making regarding—or in partnership with—patients. 35 66 Reporting on efforts at the Intermountain Health Care system to improve inpatient acuity level assessment, Shaha concluded that ‘‘control charts have given information to delivery-level decision makers which they have never before enjoyed. The system has helped nurse managers better understand the acuity on their units and plan more effectively for appropriate staffing to support patient care. Improved staffing has enhanced teamwork and the quality of work life on these units’’ (Shaha, 26 p 30) 11 SPC empowered process stakeholders15 21 26 35 50 54 61 SPC had an empowering effect among—for example, patients, 35 50 nurse managers, 26 a medical assistant,15 healthcare workers and managers,21 61 and board members21 54 12 SPC application helped stakeholders learn about their processes 40 63 68 Stakeholder—or ‘‘organisational’’—learning was facilitated by SPC application and involved patients, 40 clinicians 40 63 68 and managers. 63 ‘‘Both you and your patient are learners. Let the charts teach you and help you learn what is of practical value to your patients. You will find that learning together is a strong invitation of commitment to the [asthma care] process for both of you’’ (Boggs et al,40 p 175) *All articles reported benefits, and many reported several. The benefits formed 12 categories which are grouped into three broad areas. Systematic review of SPC in healthcare QI 393 www.qshc.com
  • 8. application efforts. On the basis of this review, we agree with the argument that ‘‘medical quality improvement will not reach its full potential unless accurate and transparent reports of improvement work are published frequently and widely (p 319),’’75 and also that the way forward is to strengthen QI research rather than to lower the bar for publication.76 Methodological considerations regarding the included studies None of the studies we found was designed to evaluate the effectiveness quantitatively—that is, the magnitude of bene- fits—of SPC application. This would have required other study designs such as cluster randomised trials or quasi-experimental studies.12 Although the ‘‘methods of evaluating complex interventions such as quality improvement interventions are less well described [than those to evaluate less complex interventions such as drugs]’’, Eccles et al argue that the ‘‘general principle underlying the choice of evaluative design is ... simple—those conducting such evaluations should use the most robust design possible to minimise bias and maximise generalisability. [The] design and conduct of quantitative evaluative studies should build upon the findings of other quality improvement research (p 47).’’77 This review can provide such a foundation for future evaluative studies. An important distinction is warranted here: we believe that SPC rests on a solid theoretical, statistical foundation and is a highly robust method for analysing process performance. The designs of the studies included in this systematic review were, however, not particularly robust with regard to evaluating the effectiveness of SPC application, and that was not their Table 7 Limitations of SPC application in improvement of clinical processes* Examples/explanations Limitations of the ability to improve clinical processes using SPC 1 Sharing performance data in control chart format does not automatically lead to improvement in healthcare organisations15 67 Even if control charts can help visualise the performance of a clinical process, and signal a need for improvement, there is no guarantee that such signals prompt improvement. For example, Mertens et al studied the effects of a number of interventions, including control chart format feedback, on oncologist prescribing patterns for the management of delayed chemotherapy-induced nausea and emesis. ‘‘In our study, these [control] charts effectively measured the degree of compliance with guideline recommendations, but they were not effective in improving physician compliance ... . These findings indicate that statistically valid charting, although useful in measuring compliance, will not achieve improved compliance as a physician feedback tool. However, enhanced compliance may be achieved when adverse patient outcomes are coupled with evidence of poor compliance with evidence-based guidelines’’ (Mertens et al,67 p 1377) 2 Statistical control does not necessarily equal clinical control nor desired performance27 35 63 64 ‘‘It is important to note that a chart can be in statistical control, and [the patient can still] be at risk for severe asthma. So statistical control does not equate with clinical control. It simply reflects the absence of special cause variation’’ (Boggs et al,35 p 555) 3 Cause and effect relationships are not always obvious, even if a change is identified with statistical confidence45 60 61 ‘‘Although control charts can help detect when the [MRSA] rate has increased or decreased, they typically will not identify the specific cause of the change. Once a change is detected, the infection control team must use its skills to assess the situation, identify possible causes, and promote improvement in practices’’ (Curran et al, 61 p 16) Limitations of the applicability of SPC to clinical processes 4 Differences between patients may limit the appropriateness of combining data about their care onto one control chart25 30 51 52 ‘‘Unlike manufacturing, the health care industry deals with a variable input: Patients differ in their severity of illness on admission. This variability on admission affects care outcomes.[Ref] Therefore, it is imperative to adjust for patients’ risk for adverse outcomes. ... Blindly applying methods of manufacturing to health care may be misleading’’ (Alemi and Oliver,51 p 2) 5 The ability of stakeholders to apply SPC correctly may be limited 16 35 Discussing an article which contains a methodological error—irrational subgrouping—Boggs et al emphasise that ‘‘the mathematics which defines the upper and lower control limits and the zone lines (from which signals are defined) is derived from the range between the values composing each subgroup. If the daily subgroupings are irrational—i.e., the AM pre- and postbronchodilator and PM pre- and postbronchodilator are included in the same subgrouping—the daily ranges are distorted, the mathematical calculations are erroneous, and the control charts these calculations produce are improperly constructed. An improperly constructed chart is by definition uninterpretable. This error of irrational subgrouping is fatal and invalidates both their analysis and conclusions’’ (Boggs et al,35 p 560). Another aspect of this limitation is when staff members lack sufficient knowledge of QI in general and SPC in particular 16 6 Limitations regarding data for use in control charts 25 26 38 44 45 54 63–65 Several articles highlight limitations related to the data needed for control charting: l The sample size needs to be ‘‘big enough’’. A minimum amount of data are needed to produce reliable control charts.26 54 ‘‘If a control chart has too few data points, then it may appear that a special cause exists when it really does not’’ (Caron and Neuhauser, 54 p 31) l Common types of control charts are not well suited to analysing infrequent events. Such events require special types of control charts64 l (Manual) data collection can be prohibitively demanding 65 l Oversampling of patients whose values are out of control pulls the statistic in the direction of derangements25 l Choosing too long a sampling period may delay control chart signalling and delay decision making 44 l (Retrospective) control chart interpretation can be difficult if charts are not annotated with interventions or other influences on process performance 45 l Autocorrelation may limit the ability to analyse control chart data. ‘‘Autocorrelation is a phenomenon whereby the preceding observation predicts the next observation. ... If yesterday’s blood pressure predicts today’s blood pressure, there is autocorrelation’’ (Solodky et al, 38 p AS14) l System-level aggregation of SPC data may prevent local sense making (if the data cannot be disaggregated). For example, performance measures of one primary care medical group practice ‘‘are computed on a group practice level. This level of aggregation means that the SPC charts cannot currently be used to evaluate the results of individual and team efforts within individual group practices’’ (Stewart and Greisler, 63 pp 258–9) *We found statements regarding one or more limitations of SPC application in 22 articles. The limitations formed six categories which are grouped into two broad areas. 394 Thor, Lundberg, Ask, et al www.qshc.com
  • 9. objective. This does not mean that SPC is not a useful tool for QI in healthcare, only that the studies reviewed here were more vulnerable to bias than more robust study designs, even if they do indicate many clear benefits of SPC application (table 6). Despite the studies not being designed to evaluate the effectiveness of SPC, many used SPC to effectively show the impact of QI or other change initiatives. In this way, SPC analysis can be just as powerful and robust as study designs often deemed superior, such as randomised controlled trials (RCTs).77 The key to this power is the statistical and practical ability to detect significant changes over time in process performance when applying SPC.9 On the basis of a theoretical comparison between control charts and RCTs, Solodky et al38 argue that control charts can complement RCTs, and sometimes even be preferable to RCTs, since they are so robust and enable replication—‘‘the gold standard’’ for research quality—at much lower cost than do RCTs. These points have been further elaborated in subsequent work.78 79 A curious methodological wrinkle in our review is: can you evaluate the application of a method (eg, SPC) using that same method for the evaluation? Several of the included studies used SPC both as (part of) an intervention and as a method to evaluate the impact of that intervention. For example, Curran et al used annotated control charts to feed information on MRSA acquisition rates back to stakeholders and used these same control charts to show the effectiveness of the feedback programme.61 Relationship between monitoring and improvement When SPC is applied for monitoring, rather than for managing change, the aims are different—for example, to detect even small but clinically important deviations in performance—as are the methodological challenges.80 81 This review focused on the latter. Thus although studies on SPC application for monitoring healthcare performance were excluded from this review, we recognise the importance of such monitoring. The demarcation between monitoring and improvement is not absolute. Indeed, there are important connections between measurement, mon- itoring and improvement, even if improvement does not follow automatically from indications of dissatisfactory performance. ‘‘To improve performance, organizations and individuals need the Table 8 Barriers to SPC application* Examples/explanations People related barriers 1 Lack of knowledge on how to apply SPC correctly 16 35 37 51 Even though control charts, constructed correctly, may be easy to use, not all healthcare professionals and managers have sufficient SPC knowledge 2 At first, SPC may represent a new and challenging way of thinking18 40 ‘‘It is not at all surprising that many persons avoid involvement in statistical process control. The statistical procedures developed in industry to monitor production processes are somewhat different from those employed in biostatistics and social science applications. Many find it difficult to adjust to these procedures and to apply statistical process control techniques to situations in health care settings’’ (McKenzie,18 p 81) 3 If SPC application is not perceived as helpful, it may not succeed 39 65 ‘‘Whereas Finison et al.[Ref] claim that the mean and standard deviation are simple and easy for staff to understand, the staff involved in this study found them difficult to perceive. This is partly accounted for by the staff’s resistance, as it seemed that they did not want to understand the results of the figures. The staff expected the investigators to tell them what to do and did not want to process the results and the issues underlying them’’ (Hyrkas and Lehti, 65 p 186) Data collection and chart construction related barriers 4 Collection and attribution of data to different hospital units for SPC application can be difficult61 In the case of hospital acquired infections, investigators found that it was hard to assign new cases to the correct ward or unit’s control chart. ‘‘The few disadvantages of this approach primarily concern implementation. The ability to assign a new MRSA case to a specific ward rarely can be completely accurate. We attempt to minimize this imprecision by encouraging the input of ward staff in any discussions or debates as to where a patient acquired the MRSA’’ (Curran et al, 61 p 17) 5 Finding the right level of aggregation of data for SPC application can be difficult and require trade-offs 61 Continuing with the example of hospital acquired MRSA infections, finding the best level of data aggregation was a barrier: ‘‘If the control chart includes too many wards, then staff may feel the responsibility lies elsewhere and they may not be inclined to use the feedback to alter their practices. Further, if the chart contains information from too many departments or units, it sometimes can mask local problems or out-of- control data. [Furthermore, monitoring] a large number of units on individual charts also can decrease the overall specificity and increase the false-alarm rate, especially if [2 sigma] warning limits are used as control limits’’ (Curran et al,61 pp 16–8) 6 Data collection and analysis can be time consuming and costly 17 19 37 39 ‘‘Other real obstacles that challenge physicians are the time required for and the financial costs of data collection and analysis. ... Certainly, measurement may consume valuable resources’’ (Nelson et al, 37 p. 465) 7 Constructing the most appropriate control chart can be difficult 30 ‘‘The most difficult task is deciding which probability distribution, and thus which control chart, is most appropriate for the data, and then choosing homogenous and rational subgroups to analyze’’ (Shahian et al, 30 p 1356) 8 Lack of access to reliable data in a timely fashion can be a barrier to real-time SPC application 47 Discussing care pathways in cardiac surgery, one group found that ‘‘accurate process data are difficult and expensive to obtain. Data obtained from hospital and medical records data systems are often inaccurate, temporally inefficient, and not focused on daily patient events[.] Among the difficulties with optimizing outcome-based cardiac surgical care are the expense and problems with [multi-institutional] databases, including lack of standardization, cost of dedicated data entry/delivery personnel, and lack of timely feedback[. Those] systems were not designed to provide rapid feedback of process data, which is necessary if individual practitioners are to effectively manage cardiac surgery pathways’’ (Ratcliffe et al,47 p 1820) Information technology related barriers 9 Lack of computer power was a barrier to real-time SPC application22 ‘‘There are several reasons why control charts and other statistical process control techniques have to date not been introduced as tools to improve real-time clinical decision making. These include lack of computer power to perform calculations in real time, inabilities to interface medical monitors with computers and to produce clean measurement with an acceptable signal to noise ratio, and lack of statistical process control training for clinical decision makers’’ (Laffel et al,22 pp 76–7) 10 Software problems can hamper SPC application26 One study reported unspecified, and subsequently resolved, software problems as the only barrier to SPC application *We found reports of barriers in 15 articles. They formed 10 categories which are grouped into three broad areas. Systematic review of SPC in healthcare QI 395 www.qshc.com
  • 10. Table 9 Factors or conditions facilitating application of SPC* Examples/explanations Information technology and other tools facilitated SPC application 1 Easy-to-use tools and resources exist to aid with data management and control chart construction22 30 31 35 45 47 69 70 The evolution of information technology has brought many new possibilities for SPC data management, control chart construction and interpretation 2 Electronic clinical information systems with SPC capability facilitated data management and SPC application19 25 28 30 34 47 49 When designing a system which produced control charts for measures reflecting performance relative to a critical pathway for cardiac surgery, investigators found that a facilitating factor ‘‘was the existing electronic medical record, which requires that nurses enter a computerized progress note. ... Integration of the data collection with the generation of a nursing progress note clearly provides the motivation for the bedside nurse to use the system. Moreover, we were able to couple our data collection system with the requirement for an electronic progress note efficiently, so that ... the intranet-based system decreased by 50% the amount of time the nurses spent charting their progress note’’ (Ratcliffe et al, 47 pp 1820–1) Feedback, training and learning may facilitate SPC application 3 User feedback guided changes to facilitate SPC application 40 ‘‘In a focus group session with patients, we learned that many objected to plotting the exact PEFR values over time on a chart. The fear was misplotting – thereby ruining the chart. This insight led to a redesign of the chart in a manner that respected their concern yet did not compromise the chart’s ability to provide the information needed’’ (Boggs et al, 40 p 174) 4 Training users in SPC application may be helpful15 26 44 50 Reflecting on efforts to apply SPC at a provincial hospital in Indonesia, the author suggests that ‘‘(i) the process of data management should be performed by the hospital staff under supervision and with training they should be able to do it without supervision; (ii) a training session for staff on the creation and interpretation of the control chart should be carried out’’ (Purba, 44 p 147) 5 Gradual introduction of SPC can allow learning and improvement to support subsequent application and spread 25 34 61 At a family medicine clinic, the impact of QI including SPC application ‘‘had to be demonstrated through initial projects before there was more general support for the process by other residents and faculty within the department’’ (Ornstein et al, 34 p 360) 6 Professionals in training led improvement efforts using SPC as part of a clinical scholars programme 34 ‘‘Many of the ideas for patient care improvement projects [using SPC] have evolved from the work and leadership of a group of family residents, pharmacy residents, and faculty that is involved in a unique educational experience known as the clinical scholars program. The program was developed ... as a mechanism to provide the family medicine residents with hands-on opportunities to learn clinical research and quality improvement methods. ... Generally, the project leaders are residents in the clinical scholars program’’ (Ornstein et al,34 p 351) 7 SPC application to clinical topics captured the interest of clinicians 34 ‘‘Clinical topics interest clinicians, and recognition of the potential personal benefits of a project will increase individual commitment and participation’’ (Ornstein et al, 34 p 360) Patients can have a role in SPC application 8 The benefits of SPC application motivated and empowered patients to record and control chart the data 35 ‘‘Adherence in our clinic population is better, both short-term and long-term, with [asthma patient operated control charts of PEFR] than for any PEFR monitoring method we have used in the past. ... It is our assessment that the reasons for high patient adherence with our method include (1) the PEFR measurement per se is simple and can be performed using inexpensive equipment; (2) the charts our patients use are easy to keep and understand; (3) the concepts of signals and not being at-risk are easily understood and appreciated by patients; (4) the chart plays a central role in each patient’s follow-up visit and in telephone calls between visits; (5) because of the latter, patients know we will be monitoring their adherence; (6) patients understand that their chart provides information we need and will use to make decisions that will impact their care; and (7) the quality of the communication with patients is more substantive’’ (Boggs et al, 35 p 561) 9 Patients as partners may be better at collecting data for SPC analysis than ‘‘human subjects’’ are in traditional research 38 ‘‘For the control chart analysis used in the current study, the patient has been a partner (the first author of this article). Patients in RCTs usually are seen as ‘human subjects.’ Psychological theory suggests that partners are better data collectors than subjects’’ (Solodky et al, 38 pp AS18–9) Literature and experts can guide SPC application 10 There is literature to guide SPC application 15 35 ‘‘The statistical methods to be used in calculating control charts are well described in the literature.[Ref] ’’ (Re et al, 15 p 395) 11 Local experts may provide technical assistance for SPC application18 47 ‘‘At the Indiana University Medical Center several persons from different hospital departments have volunteered to form a cadre of internal statistical process control consultants. The group has come to be known by some as the statistical process control ‘think tank’. No doubt a small group of individuals who are interested in statistics, quality control, and computers can be found in most hospitals. While it is necessary that the large majority of managers and supervisors in any health care organization are knowledgeable about process management and control charts at the concept level of understanding, it takes a relatively few to understand and use such control charts. As internal consultants, these few persons can provide technical assistance when such aid is needed’’ (McKenzie,18 p 81) 12 Collaboration with SPC experts may facilitate application 23 34 Collaboration between scholars from nursing and experts in industrial measurement error research ‘‘has facilitated the conception and completion of a study [of blood pressure measurement error in a nursing clinic] that could not have been accomplished by either discipline alone’’ (Nelson et al,23 p 27) 396 Thor, Lundberg, Ask, et al www.qshc.com
  • 11. capability to control, improve, and design processes, and then to monitor the effects of this improvement work on the results. Measurement alone will not suffice (pp 1–35).’’82 Monitoring performance by way of control charts has been suggested as a better approach to clinical governance in the British National Health Service. Through six case studies, Mohammed et al demonstrate how control chart monitoring of performance can distinguish normal performance from perfor- mance that is either substandard or better than usual care. ‘‘These case studies illustrate an important role for Shewhart’s approach to understanding and reducing variation. They demonstrate the simplicity and power of control charts at guiding their users towards appropriate action for improvement (p 466).’’83 Comments on the review methodology No search strategy is perfect, and we may well have missed some studies where SPC was applied to healthcare QI. There are no SPC specific keywords (eg, Medical Subject Headings, MeSH) so we had to rely on text words. Studies not containing our search terms in the title or abstract could still be of potential interest although presumably we found most of the articles where SPC application was a central element. We believe the risk that we systematically missed relevant studies to be small. Therefore, our findings would probably not have changed much due to such studies that we might have missed. The review draws on our reading, interpretation and selection of predominantly qualitative data—in the form of text and figures—in the included articles to answer the questions in our data abstraction form. The questions we addressed, the answers we derived from the studies, and the ways we synthesised the findings are not the only ways to approach this dataset. Furthermore, each member of the review team brought different knowledge and experiences of relevance to the review, potentially challenging the reliability of our analysis. An attempt was made to reduce that risk by having one investigator read all data abstraction forms, and obtain clarifications or additional data from the original articles when needed. That investigator also conducted the initial data synthesis, which was then reviewed by the entire team and the two outside experts. Although other interpretations and syntheses of these data are possible, we believe that ours are plausible and hope they are useful. Examples/explanations Smart application of SPC can be helpful 13 Freezing control limits and the centre line at pre-intervention levels helped decipher the impact of interventions 59 70 ‘‘In [a figure], note that we have separated the plot into two periods: before and after the intervention. For calculating the [control limits], one should use only the data from before the intervention. In this fashion, the patient and the clinicians can decipher if the postintervention data exceeds their expectations from historical patterns’’ (Alemi and Neuhauser,70 p 99) 14 Data stratification or disaggregation helped disentangle performance problems and focus improvement efforts37 59 ‘‘The physicians at Site A needed to develop a theory about why their care was rated lower than at other sites. They theorized that the results might be different for the three service areas: family practice, pediatrics, and ambulatory surgery. Therefore, they developed a control chart to disaggregate the data by service. The results ... for each service were juxtaposed on the same control chart using a technique called rational ordering’’ (Carey, 59 p 80) 15 Risk adjustment of SPC data revealed process changes that previously were hidden 51 52 71 ‘‘Before risk adjustment, the process improvement was hidden by the variations in patient risk. Taking the patient risks into account by risk adjustment revealed the significant decrease in [length of stay] during the final 3 months of the 18-month period’’ (Hart et al, 71 p 115) 16 Annotations and feedback helped users interpret control charts54 61 ‘‘For anyone not familiar with the information presented in a control chart, annotations are essential. Annotations will aid in explaining observed variation and explaining changes in the underlying process’’ (Caron and Neuhauser, 54 p 30) 17 Keeping control charts up to date increased their utility61 ‘‘Because the infection control team updates the [control] charts frequently, they can respond more immediately to an increased rate and interact with the ward in a more timely manner’’ (Curran et al,61 p 15) 18 Providing SPC information as locally as possible increased its accuracy and utility26 61 ‘‘A major reason for the system’s success is that these data charts exist on the PCs at the patient care areas. The information is available to the caregivers and their manager. ... In the [Intermountain Health Care] model, the information is seen first by those who should care the most about its accuracy and reliability. They immediately seek legitimate and operational explanations for anomalies, genuinely showing a high degree of ownership and desire for data integrity’’ (Shaha, 26 p 30) 19 Making SPC charts readily available to stakeholders may facilitate SPC application 34 65 ‘‘Feedback to physicians and other providers is an important component of all the ongoing improvement projects. To facilitate this communication, monthly updates to the control charts used to monitor ongoing CQI projects are posted on a large bulletin board [and also distributed at meetings, and sent out by e-mail]’’ (Ornstein et al, 34 p 353) 20 Knowing the clinical context helped in the interpretation of control charts25 Discussing the issue that blood glucose tests are taken more frequently from patients whose blood glucose level is deranged, investigators argue that they ‘‘interpret the charts in context, aware that points are weighted toward derangements’’ (Oniki et al, 25 p 589) 21 Evidence of autocorrelation can be detected easily38 ‘‘Evidence for [autocorrelation—that the preceding observation predicts the next observation] is detected easily by correlating the value of the variable at time t with the value of the variable at time t + 1’’ (Solodky et al, 38 p AS14) 22 Concurrent controls can help interpret variation detected using SPC38 ‘‘Control charts focus on change over time. Adding concurrent control patients can help monitor the effects of unknown exogenous factors that may influence outcomes’’ (Solodky et al,38 p AS17) 23 A key quality indicator helped reflect the functioning of a complex set of processes in a simple way46 ‘‘Overall process quality cannot be measured directly; we must resort to the use of quality indicators as easy to assess surrogate markers reflecting overall quality. DTNT [door-to-needle-time for patients with acute myocardial infarction who receive a thrombolytic drug] in our example, is a prototype of such an indicator, because it represents the result of a very complex set of processes but nevertheless is simple to measure’’ (Bonetti et al,46 p 314) *We found reports of facilitating conditions or factors in 28 articles. The factors formed 23 categories which are grouped into five broad areas. Table 9 Continued Systematic review of SPC in healthcare QI 397 www.qshc.com
  • 12. The methods for reviewing studies based primarily on qualitative data in healthcare are less well developed than the more established methods for quantitative systematic reviews, and they are in a phase of development and diversifica- tion.13 84 85 Among the different methods for synthesising evidence, our approach is best characterised as an interpretive (rather than integrative) review applying thematic analysis—it ‘‘involves the identification of prominent or recurrent themes in the literature, and summarising the findings of different studies under thematic headings’’.86 There is no gold standard for how to conduct reviews of primarily qualitative studies. Our response to this uncertainty has been to use the best ideas we could find, and to be explicit about our approach to allow readers to assess the findings and their provenance. The main limitation of this review is the uncertainty regarding the methodological quality of many of the primary studies. Assessment of quality of qualitative studies is still under debate, and there is no consensus on whether at all, or, if so, how to conduct such assessments.84 We reviewed all the studies that satisfied our inclusion criteria and made no further quality assessment. Therefore our findings should be consid- ered as tentative indications of benefits, limitations, etc to be corroborated, or rejected, by future research. The main strength of this review is our systematic and explicit approach to searching and including studies for review, and to data abstraction using a standardised form. It has helped generate an overview of how SPC has been applied to healthcare QI with both breadth and depth—similar to the benefits of thematic analysis reported by investigators reviewing young people’s views on health and health behaviour.87 In conclusion, this review indicates how SPC has been applied to healthcare QI with substantial benefits to diverse stakeholders. Although there are important limitations and barriers regarding its application, when applied correctly SPC is a versatile tool which can enable stakeholders to manage change in healthcare and improve patients’ health. ACKNOWLEDGEMENTS We thank Ms Christine Wickman, Information Specialist at the Karolinska Institutet Library, for expert assistance in conducting the database searches. We also acknowledge the pilot work conducted by Ms Miia Maunuaho as a student project at Helsinki University, supervised by Professor Brommels, which provided a starting point for this study. We thank Professor Duncan Neuhauser, Case Western Reserve University, Cleveland, Ohio, USA, and Professor Bo Bergman, Chalmers University of Technology, Gothenburg, Sweden, for their helpful comments on an earlier version of this manuscript. We thank Dr Rebecca Popenoe for her editorial assistance. Authors’ affiliations . . . . . . . . . . . . . . . . . . . . . . . Johan Thor, Jonas Lundberg, Jakob Ask, Jesper Olsson, Cheryl Carli, Karin Pukk Härenstam, Mats Brommels, Medical Management Centre, Karolinska Institutet, Stockholm, Sweden Funding: No dedicated funding was received for this study. All coauthors were supported by their respective employers in conducting this research as part of their work. Competing interests: None. REFERENCES 1 Burnes B. Managing change: a strategic approach to organisational dynamics, 3rd edn. London: Financial Times/Prentice Hall, 2000. 2 Wheeler DJ, Chambers DS. Understanding statistical process control, 2nd edn. Knoxville, TN: SPC Press, 1992. 3 Fisher LM, Humphries BL. Statistical quality control of rabbit brain thromboplastin for clinical use in the prothrombin time determination. Am J Clin Pathol 1966;45:148–52. 4 Carey RG. Improving healthcare with control charts: basic and advanced SPC methods and case studies. Milwaukee: ASQ Quality Press, 2003. 5 Daniels S, Johnson K, Johnson C. Quality glossary. 2006 [cited 28 June 2006], http://www.asq.org/glossary/s.html. 6 Blumenthal D. Applying industrial quality management science to physicians’ clinical decisions. In: Blumenthal D, Scheck A, eds. Improving clinical practice: total quality management and the physician. San Francisco: Jossey-Bass Publishers, 1995:25–49. 7 Berwick DM. A primer on leading the improvement of systems. BMJ 1996;312:619–22. 8 Berwick DM. Controlling variation in health care: a consultation from Walter Shewhart. Med Care 1991;29:1212–25. 9 Benneyan JC, Lloyd RC, Plsek PE. Statistical process control as a tool for research and healthcare improvement. Qual Saf Health Care 2003;12:458–64. 10 Plsek PE. Quality improvement methods in clinical medicine. Pediatrics 1999;103(1 Suppl E):203–14. 11 Wilcock PM, Thomson RG. Modern measurement for a modern health service. Qual Health Care 2000;9:199–200. 12 Grimshaw J, McAuley LM, Bero LA, et al. Systematic reviews of the effectiveness of quality improvement strategies and programmes. Qual Saf Health Care 2003;12:298–303. 13 Mays N, Roberts E, Popay J. Synthesising research evidence. In: Fulop N, Allen P, Clarke A, et al, eds. Studying the organisation and delivery of health services: research methods. London: Routledge, 2001:188–220. 14 Fulop N, Allen P, Clarke A, et al. Issues in studying the organisation and delivery of health services. In: Fulop N, Allen P, Clarke A, et al, eds. Studying the organisation and delivery of health services: research methods. London: Routledge, 2001:1–23. 15 Re RN, Krousel-Wood MA. How to use continuous quality improvement theory and statistical quality control tools in a multispecialty clinic [see comment]. Qrb Qual Rev Bull 1990;16:391–7. 16 Schnelle JF, Newman DR, Fogarty TE, et al. Assessment and quality-control of incontinence care in long-term nursing facilities. J Am Geriatr Soc 1991;39:165–71. 17 Bluth EI, Havrilla M, Blakeman C. Quality improvement techniques: value to improve the timeliness of preoperative chest radiographic reports. AJR Am J Roentgenol 1993;160:995–8. 18 McKenzie L. Process management: two control charts. Health Care Superv 1993;12:70–81. 19 Rollo JL, Fauser BA. Computers in total quality management. Statistical process control to expedite stats. Arch Pathol Lab Med 1993;117:900–5. 20 Dey ML, Sluyter GV, Keating JE. Statistical process control and direct care staff performance. J Ment Health Adm 1994;21:201–9. 21 Guinane CS, Sikes JI, Wilson RK. Using the PDSA cycle to standardize a quality assurance program in a quality improvement-driven environment. Jt Comm J Qual Improv 1994;20:696–705. 22 Laffel G, Luttman R, Zimmerman S. Using control charts to analyze serial patient- related data. Qual Manag Health Care 1994;3:70–7. 23 Nelson FE, Hart MK, Hart RF. Application of control chart statistics to blood pressure measurement variability in the primary care setting. J Am Acad Nurse Pract 1994;6:17–28. 24 Carey RG, Teeters JL. CQI case-study—reducing medication errors. Jt Comm J Qual Improv 1995;21:232–7. 25 Oniki TA, Clemmer TP, Arthur LK, et al. Using statistical quality control techniques to monitor blood glucose levels. Proc Annu Symp Comput Appl Med Care 1995:586–90. 26 Shaha SH. Acuity systems and control charting. Qual Manag Health Care 1995;3:22–30. 27 Ziegenfuss JT Jr, McKenna CK. Ten tools of continuous quality improvement: a review and case example of hospital discharge. Am J Med Qual 1995;10:213–20. 28 Johnson CC, Martin M. Effectiveness of a physician education program in reducing consumption of hospital resources in elective total hip replacement. South Med J 1996;89:282–9. 29 Piccirillo JF. The use of patient satisfaction data to assess the impact of continuous quality improvement efforts. Arch Otolaryngol Head Neck Surg 1996;122:1045–8. 30 Shahian DM, Williamson WA, Svensson LG, et al. Applications of statistical quality control to cardiac surgery. Ann Thorac Surg 1996;62:1351–8; discussion 8–9. 31 Tsacle EG, Aly NA. An expert system model for implementing statistical process control in the health care industry. Computers & Industrial Engineering 1996;31:447–50. 32 Cornelissen G, Halberg F, Hawkins D, et al. Individual assessment of antihypertensive response by self-starting cumulative sums. J Med Eng Technol 1997;21:111–20. 33 Linford LH, Clemmer TP, Oniki TA. Development of a blood glucose protocol using statistical quality control techniques. Nutr Clin Pract 1997;12:38–41. 34 Ornstein SM, Jenkins RG, Lee FW, et al. The computer-based patient record as a CQI tool in a family medicine center. Jt Comm J Qual Improv 1997;23:347–61. 35 Boggs PB, Wheeler D, Washburne WF, et al. Peak expiratory flow rate control chart in asthma care: chart construction and use in asthma care. Ann Allergy Asthma Immunol 1998;81:552–62. 36 Konrad C, Gerber HR, Schuepfer G, et al. Transurethral resection syndrome: effect of the introduction into clinical practice of a new method for monitoring fluid absorption. J Clin Anesth 1998;10:360–5. 37 Nelson EC, Splaine ME, Batalden PB, et al. Building measurement and data collection into medical practice. Ann Intern Med 1998;128:460–6. 38 Solodky C, Chen HG, Jones PK, et al. Patients as partners in clinical research—a proposal for applying quality improvement methods to patient care. Med Care 1998;36:AS13–20. 39 Vitez TS, Macario A. Setting performance standards for an anesthesia department. J Clin Anesth 1998;10:166–75. 398 Thor, Lundberg, Ask, et al www.qshc.com
  • 13. 40 Boggs PB, Hayati F, Washburne WF, et al. Using statistical process control charts for the continual improvement of asthma care. Jt Comm J Qual Improv 1999;25:163–81. 41 Konrad C, Gerber H, Schupfer G, et al. Detection of fluid volume absorption by end-tidal alcohol monitoring in patients undergoing endoscopic renal pelvic surgery. J Clin Anesth 1999;11:386–90. 42 Levett JM, Carey RG. Measuring for improvement: from Toyota to thoracic surgery. Ann Thorac Surg 1999;68:353–8. 43 Pollard JB, Garnerin P. Outpatient preoperative evaluation clinic can lead to a rapid shift from inpatient to outpatient surgery: a retrospective review of perioperative setting and outcome. J Clin Anesth 1999;11:39–45. 44 Purba M. Use of a control chart to monitor diarrhoea admissions: a quality improvement exercise in West Kalimantan Provincial Hospital, Pontianak, Indonesia. J Qual Clin Pract 1999;19:145–7. 45 Schwab RA, DelSorbo SM, Cunningham MR, et al. Using statistical process control to demonstrate the effect of operational interventions on quality indicators in the emergency department. J Healthc Qual 1999;21:38–41. 46 Bonetti PO, Waeckerlin A, Schuepfer G, et al. Improving time-sensitive processes in the intensive care unit: the example of ‘‘door-to-needle time’’ in acute myocardial infarction. Int J Qual Health Care 2000;12:311–7. 47 Ratcliffe MB, Khan JH, Magee KM, et al. Collection of process data after cardiac surgery: Initial implementation with a Java-based intranet applet. Ann Thorac Surg 2000;69:1817–21. 48 Saturno PJ, Felices F, Segura J, et al. Reducing time delay in the thrombolysis of myocardial infarction: an internal quality improvement project. Am J Med Qual 2000;15:85–93. 49 Sinanan M, Wicks K, Peccoud M, et al. Formula for surgical practice resuscitation in an academic medical center. Am J Surg 2000;179:417–21. 50 Staker LV. Changing clinical practice by improving systems: the pursuit of clinical excellence through practice-based measurement for learning and improvement. Qual Manag Health Care 2000;9:1–13. 51 Alemi F, Oliver DW. Tutorial on risk-adjusted P-charts. Qual Manag Health Care 2001;10:1–9. 52 Alemi F, Sullivan T. Tutorial on risk adjusted X-bar charts: applications to measurement of diabetes control. Qual Manag Health Care 2001;9:57–65. 53 Aronsky D, Kendall D, Merkley K, et al. A comprehensive set of coded chief complaints for the emergency department. Acad Emerg Med 2001;8:980–9. 54 Caron A, Neuhauser DV. Health care organization improvement reports using control charts for key quality characteristics: ORYX measures as examples. Qual Manag Health Care 2001;9:28–39. 55 Quinn DC, Graber AL, Elasy TA, et al. Overcoming turf battles: developing a pragmatic, collaborative model to improve glycemic control in patients with diabetes. Jt Comm J Qual Improv 2001;27:255–64. 56 Roman SH, Chassin MR. Windows of opportunity to improve diabetes care when patients with diabetes are hospitalized for other conditions. Diabetes Care 2001;24:1371–6. 57 Boelle PY, Bonnet F, Valleron AJ. An integrated system for significant anaesthetic events monitoring. J Am Med Inform Assoc 2002;9:S23–7. 58 Burnett L, Chesher D, Burnett JR. Optimizing the availability of ‘‘stat’’ laboratory tests using Shewhart ‘‘C’’ control charts. Ann Clin Biochem 2002;39:140–4. 59 Carey RG. Improving patient satisfaction: a control chart case study. J Ambul Care Manage 2002;25:78–83. 60 Chu J, Neuhauser DV, Schwartz I, et al. The efficacy of automated/electrical twitch obtaining intramuscular stimulation (atoims/etoims) for chronic pain control: evaluation with statistical process control methods. Electromyogr Clin Neurophysiol 2002;42:393–401. 61 Curran ET, Benneyan JC, Hood J. Controlling methicillin-resistant Staphylococcus aureus: A feedback approach using annotated statistical process control charts. Infect Control Hosp Epidemiol 2002;23:13–8. 62 Marshall T, Mohammed MA, Lim HT. Understanding variation for clinical governance: an illustration using the diagnosis and treatment of sore throat. Br J Gen Pract 2002;52:277–83. 63 Stewart LJ, Greisler D. Measuring primary care practice performance within an integrated delivery system: a case study. J Healthc Manag 2002;47:250–61. 64 Fasting S, Gisvold SE. Statistical process control methods allow the analysis and improvement of anesthesia care. Can J Anaesth 2003;50:767–74. 65 Hyrkas K, Lehti K. Continuous quality improvement through team supervision supported by continuous self-monitoring of work and systematic patient feedback. J Nurs Manag 2003;11:177–88. 66 Marshall T, Mohammed MA. Understanding variation in quality improvement: the treatment of sore throats in primary care. Fam Pract 2003;20:69–73. 67 Mertens WC, Higby DJ, Brown D, et al. Improving the care of patients with regard to chemotherapy-induced nausea and emesis: the effect of feedback to clinicians on adherence to antiemetic prescribing guidelines. J Clin Oncol 2003;21:1373–8. 68 Norberg A, Christopher NC, Ramundo ML, et al. Contamination rates of blood cultures obtained by dedicated phlebotomy vs intravenous catheter. JAMA 2003;289:726–9. 69 Rosow E, Adam J, Coulombe K, et al. Virtual instrumentation and real-time executive dashboards. Solutions for health care systems. Nurs Adm Q 2003;27:58–76. 70 Alemi F, Neuhauser D. Time-between control charts for monitoring asthma attacks. Jt Comm J Qual Saf 2004;30:95–102. 71 Hart MK, Robertson JW, Hart RF, et al. Application of variables control charts to risk-adjusted time-ordered healthcare data .[comment]. Qual Manag Health Care 2004;13:99–119. 72 Nelson EC, Batalden PB, Huber TP, et al. Microsystems in health care: Part 1. Learning from high-performing front-line clinical units. Jt Comm J Qual Improv 2002;28:472–93. 73 Olsson J, Elg M, Molfenter T. Reflections on transnational transferability of improvement technologies—a comparison of factors for successful change in the United States and northern Europe. Qual Manag Health Care 2003;12:259–69. 74 Thor J, Wittlov K, Herrlin B, et al. Learning helpers: how they facilitated improvement and improved facilitation—lessons from a hospital-wide quality improvement initiative. Qual Manag Health Care 2004;13:60–74. 75 Davidoff F, Batalden P. Toward stronger evidence on quality improvement. Draft publication guidelines: the beginning of a consensus project. Qual Saf Health Care 2005;14:319–25. 76 Pronovost P, Wachter R. Proposed standards for quality improvement research and publication: one step forward and two steps back. Qual Saf Health Care 2006;15:152–3. 77 Eccles M, Grimshaw J, Campbell M, et al. Research designs for studies evaluating the effectiveness of change and improvement strategies. Qual Saf Health Care 2003;12:47–52. 78 Diaz M, Neuhauser D. Pasteur and parachutes: when statistical process control is better than a randomized controlled trial. Qual Saf Health Care 2005;14:140–3. 79 Neuhauser D, Diaz M. Quality improvement research: are randomised trials necessary? Qual Saf Health Care 2007;16:77–80. 80 Benneyan JC, Borgman AD. Risk-adjusted sequential probability ratio tests and longitudinal surveillance methods [see comment] [comment]. Int J Qual Health Care 2003;15:5–6. 81 Lim TO. Statistical process control tools for monitoring clinical performance. Int J Qual Health Care 2003;15:3–4. 82 Berwick DM, James B, Coye MJ. Connections between quality measurement and improvement. Med Care 2003;41(1 Suppl):I30–8. 83 Mohammed MA, Cheng KK, Rouse A, et al. Bristol, Shipman, and clinical governance: Shewhart’s forgotten lessons. Lancet 2001;357:463–7. 84 Mays N, Pope C, Popay J. Systematically reviewing qualitative and quantitative evidence to inform management and policy-making in the health field. J Health Serv Res Policy 2005;10(Suppl 1):6–20. 85 Pawson R, Greenhalgh T, Harvey G, et al. Realist review—a new method of systematic review designed for complex policy interventions. J Health Serv Res Policy 2005;10(Suppl 1):21–34. 86 Dixon-Woods M, Agarwal S, Jones D, et al. Synthesising qualitative and quantitative evidence: a review of possible methods. J Health Serv Res Policy 2005;10:45–53. 87 Harden A, Garcia J, Oliver S, et al. Applying systematic review methods to studies of people’s views: an example from public health research. J Epidemiol Community Health 2004;58:794–800. APPENDIX A DATABASE SEARCH STRATEGY Web of Science (1986 – 11 June 2004) TS [topic search] = ((statistical process control or statistical quality control or control chart* or (design of experiment and doe)) and (medical or nurs* or patient* or clinic* or healthcare or health care)) We limited the search to articles in English only which reduced the number of hits from 167 to 159. We saved these 159 titles with abstracts in an EndNote library. Using a similar strategy, we searched the following databases through Ovid: N Ovid MEDLINE(R) (1966 to week 1, June 2004) N EMBASE (1988 to week 24, 2004) N CINAHL (1982 to week 1, June 2004) N PsycINFO (1985 to week 5, May 2004) This yielded 287 hits, including many duplicates, which we saved in the same EndNote library as above. Centre for Reviews and Dissemination (CRD) We searched all CRD databases and found two articles which we also added to our EndNote library. Systematic review of SPC in healthcare QI 399 www.qshc.com