The document describes the development and evaluation of the Rapid Office Strain Assessment (ROSA) checklist for assessing ergonomic risks in office workstations. ROSA was designed to quickly quantify risks associated with computer work based on established risk factors and to provide an action level based on reports of worker discomfort. It evaluates risks related to the chair, monitor, telephone, keyboard and mouse setup. ROSA scores showed a significant correlation with reported body discomfort and high reliability between observers. Mean discomfort increased with higher ROSA scores, suggesting a score of 5 could be used as an action level indicating when changes are needed. The study found ROSA to be an effective and reliable method for identifying computer use risk factors related to discomfort.
Ergonomic Evaluation of the Angle of Abduction in Laptops EnvironmentIJERA Editor
Laptops in 21st century are an integral part of every professional in vivid fields. Off late there has been
emergence of several ergonomic injuries such as repetitive strain injuries (RSIs) due to extensive usage of
laptops, which can be closely linked with applied force and postures. This study investigated the effect of
various angles of keyboard on the applied force and motor action plus response time while performing five
distinct tasks. On the basis of literature two different laptops were selected for performing different tasks. For
each case the three levels of platform angle were considered as 0°, 5°, and 10°. Male subjects were selected to
perform five distinct tasks for each platform angle for both laptops. The force applied (in milli-volts) and the
motor action plus response time (milli-seconds) were recorded using an oscilloscope. The data collected were
analyzed through ANOVA using MINITAB software. The abduction angle with the least mean response time
and applied force were considered as the best from ergonomics viewpoint. The ANOVA results showed that the
angle of abduction for both laptops (small and large) do have significant effect on applied force but not on motor
action plus response time. The analysis of results indicate that 10° angle of abduction in case of small laptops
should be applied to minimize musculoskeletal disorder and repetitive strain injuries.
Research relevance: This work suggests that those responsible for the function and operation of laptops would
have to redesign the system to reduce injuries, as far as musculoskeletal disorder, repetitive strain injuries and
other related problems are concerned. The present work can be quite useful for the system designers of
tomorrow.
A User-Centered Ergonomic Keyboard Design To Mitigate Work-Related Musculoske...CSCJournals
Work-related musculoskeletal disorders are amongst the most prevalent occupational disorders around the United States [1]. Acknowledging ergonomic variables, such as the architecture of workplace computer equipment, may well reduce the likelihood of employees forming musculoskeletal disorders [2]. This work portrays what we understand from research regarding the impact of workplace ergonomic interventions as it relates to the computer keyboard. Classic QWERTY computer keyboard designs are no longer constrained to the conventional horizontal configuration that are ordinarily packaged with individual computers. Now, there are keyboards which are partitioned into two sections, and these haves can have keys oriented at an angle, sloped down to the visual display terminal, or tilted up forming a geometric triangular shape [3]. These interventions are intended to position upper limbs in a more natural orientation resulting in pain alleviation, and a reduction in likelihood of musculoskeletal disorder development from the repetitive use of conventional computer keyboards [1]. Research efforts reviewed in this work also illustrate that experienced typists quickly adapt to alternative keyboard features, and are just as productive in terms of words per minute output. A proposed ergonomic computer keyboard design (Trinity) delivered in this paper maintains the integrity of literature by integrating insights from previous works to reduce musculoskeletal disorders while maintaining interactive user productivity.
Mitigating Ergonomic Injuries In Construction IndustryIOSR Journals
Abstract : Construction industry is one of the risky industries with high level of injuries. A musculoskeletal
disorder that is one of ergonomic injuries is the most common problem in the construction industry. This type of
injury can really affect the health of the people that are exposed to the hazards for a long period of time. The
purpose of this paper is to discuss the way to control ergonomic risk factors in construction operations and also
monitor and assess the process of program implementation to prevent or cutout ergonomic risk factors in the
construction industry. The discussion gives a basic overview of ergonomic risk factors and tries to develop
control measures for preventing accidents which are possible to happen in feature and also provides a
comprehensive monitoring to minimize and avoid such risk factors.
Keywords - Construction, Control Measures, Ergonomic risk factors, Hazard, Musculoskeletal Disorder.
Use of ergonomics risk assessment tools on construction sitevivatechijri
Construction industry is one of the 7th industry with high risk exposure. The prevalent problem with construction industry in recent years is the health of construction workers. In residential construction sites workers daily activities includes Material handling, prolonged standing, bending, etc. this leads to musculoskeletal disorders (MSD’s). Some techniques are required to identify and control WRMSDs. Ergonomics involves the interaction between human, technology and organization in the purpose of optimizing well-being, health and performance. The aim of research is performing ergonomics risk assessment based on which ergonomics risk factors in building construction site is obtained and to give an overview of ergonomic risks at workplace by some of the observational methods that can be used for assessment. Through ergonomics risk assessment tools such as checklist (questionnaire), REBA (Rapid Entire Body Assessment) and QEC (Quick Exposure Check) data is collected. Risk rank order for activities are determined by RII (Relative Importance Index). Comparison of tool QEC and REBA is done and analysis is done in SPSS. The result showed that most workers are at higher and medium risk on residential construction site. Based on the analysis and findings task need to redesigned and reassessed so that it can be safely carried out. In an appendix we have included a brief presentation of these methods together with the work sheet (if available) and the reference source of the observational method.
Seminarie Computernetwerken 2012-2013: Lecture I, 26-02-2013Vincenzo De Florio
Seminarie Computernetwerken is a course given at Universiteit Antwerpen, Belgium
A series of seminars focusing on various themes changing from year to year.
This year's themes are: resilience, behaviour, evolvability; in systems, networks, and organizations
In what follows we describe:
themes of the course
view to the seminars
rules of the game
Multi-Response Research Methodology for Ergonomic Design of Human-CNC Machine...IJERA Editor
This work is aimed at enriching a research theme, focused on exploiting the performance in a human-CNC
machine interface (HCMI) environment. A salient contribution of this research effort is focused on adopting the
concept of load cell for the system of human-performance measurement. The developed novel system is capable
of measuring cognitive and motor action responses simultaneously. The performance measurement system
designed for this work may be replicated for other fields where systems are operated through control panels and
also where responses of mentally retarded human-beings (or the human beings with the symptoms of Alzheimer
disease) are to be observed and evaluated.
Research relevance: The research methodology designed in this work can be directly applied to the practical
field to evaluate the performance in various human- panel operated system interface environments. This work
suggests that those responsible for the function and operation of CNC-machines workstations would have to
redesign the system to reduce injuries, as far as musculoskeletal and other related problems are concerned. The
present work can be quite useful for the system designers of tomorrow.
Multi-Response Ergonomic Evaluation of Higher Age Group CNC Machine OperatorsIJERA Editor
This work contributes to research on improving performance in a human-CNC machine interface (HCMI) environment. A salient contribution of this study is the use of a load cell to measure human performance. The developed novel system can measure cognitive and motor action responses simultaneously. The performance measurement system designed for this work may be used in other fields where systems are operated using control panels and for observing and evaluating the responses of mentally retarded persons (or persons with symptoms of Alzheimer‟s disease). The search time, motor action time and applied force were selected as response variables to accurately evaluate a computer numerically controlled (CNC) machine operator‟s performance. Based on a Taguchi experimental design, a full factorial design consisting of 27 (33) experiments was used to collect data on human performance. The collected data were analyzed using grey relational analysis, analysis of variance (ANOVA) and the F-test. ANOVA was performed using Design-Expert software. The designed research was shown to have a reasonable degree of validity via a confirmation test. This study represents an effective approach for the optimization of a higher age group operator-CNC machine interface environment with multi-performance characteristics based on a combination of the Taguchi method and grey relational analysis.
Ergonomic Evaluation of the Angle of Abduction in Laptops EnvironmentIJERA Editor
Laptops in 21st century are an integral part of every professional in vivid fields. Off late there has been
emergence of several ergonomic injuries such as repetitive strain injuries (RSIs) due to extensive usage of
laptops, which can be closely linked with applied force and postures. This study investigated the effect of
various angles of keyboard on the applied force and motor action plus response time while performing five
distinct tasks. On the basis of literature two different laptops were selected for performing different tasks. For
each case the three levels of platform angle were considered as 0°, 5°, and 10°. Male subjects were selected to
perform five distinct tasks for each platform angle for both laptops. The force applied (in milli-volts) and the
motor action plus response time (milli-seconds) were recorded using an oscilloscope. The data collected were
analyzed through ANOVA using MINITAB software. The abduction angle with the least mean response time
and applied force were considered as the best from ergonomics viewpoint. The ANOVA results showed that the
angle of abduction for both laptops (small and large) do have significant effect on applied force but not on motor
action plus response time. The analysis of results indicate that 10° angle of abduction in case of small laptops
should be applied to minimize musculoskeletal disorder and repetitive strain injuries.
Research relevance: This work suggests that those responsible for the function and operation of laptops would
have to redesign the system to reduce injuries, as far as musculoskeletal disorder, repetitive strain injuries and
other related problems are concerned. The present work can be quite useful for the system designers of
tomorrow.
DEVELOPMENT OF BIOMECHANIC METHODS FOR ERGONOMIC EVALUATION: COMPARISON WITH ...IAEME Publication
Various methods have been developed to evaluate workload in everyday life, and various methods of observation have been carried out. But it is still a debate until now. In this journal, the development of biomechanical methods for evaluating workloads which ergonomics will then be compared with the observation method. The observation method used is the SCANIA Ergonomics Standard (SES) and Rapid Upper Limb Assessment (RULA) methods which will be used to assess ergonomic workloads on two simulation workstations such as tightening, loosening, or increasing the number of pipes, and carrying out other actions. Sensors are also used to measure biomechanical data (Inclinometers, Accelerometers, and Goniometers). The results obtained show an assessment of the risk factors of RULA and SES according to the final results using biomechanical methods. However, there is a mismatch in the neck and wrist posture. In conclusion, the biomechanical approach is more appropriate than the observation method, but several risk factors are evaluated by unmeasured observation methods with biomechanical techniques that have been developed.
A Neural Network Based Diagnostic System for Classification of Industrial Car...CSCJournals
Even with many years of research efforts, the occupational exposure limits of different risk factors for development of Musculoskeletal disorders (MSDs) have not yet been established. One of the main problems in setting such guidelines is the limited understanding of how different risk factors of MSDs interact in causing the injury, as the nature and mechanism of these disorders are relatively unknown phenomena. The task of an industrial ergonomist is complicated because the potential risk factors that may contribute to the onset of the MSDs interact in a complex way, and require an analyst to apply elaborate data measurement and collection techniques for a realistic job analysis. This makes it difficult to discriminate well between the jobs that place workers at high or low risk of above disorders. The main objective of this study was to to develop an artificial neural network based diagnostic system which can classify industrial jobs according to the potential risk for physiological stressors due to workplace design. Such a system could be useful in hazard analysis and injury prevention due to manual handling of loads in industrial environments. The results showed that the developed diagnostic system can successfully classify jobs into low and high risk categories of above musculoskeletal disorders based on carrying task characteristics. The Neural network based system developed gave the correct classification of the analysed industrial jobs with low and high risk. So, the system can be used as an expert system which, when properly trained, will classify carrying load by male and female workers into two categories of low risk and high risk work, based on the available characteristics factors.
Work System Design Analysis and Improvement Using the Participatory Ergonomic...CSCJournals
Material handling activities in workshop units can potentially create musculoskeletal disorder complaints and injuries to workers. To reduce this potential for injury, it is necessary to analyze and improve the work system design. This study uses a participatory ergonomics approach to analyze the work system design in a workshop unit at company "X". Participatory ergonomics emphasizes the involvement of workers and ergonomics experts in discussing the improvements needed for work system design within a Focus Group Discussion. An ergonomics evaluation was carried out as a means of observation and analysis using the Nordic Musculoskeletal Questionnaire, a Quick Exposure Check, and the NIOSH Lifting Equation. Focus Group Discussions were conducted by the ergonomics team and led to the following improvements: (1) socialization of correct manual handling, (2) installation of work safety posters, (3) selection of hearing protection equipment, (4) selection of hand protection equipment, (5) stretching and reduction of workloads and repetition in material lifting, (6) changes in workplace layout, and (7) design of step ladder aids. The improvements to the work system design were evaluated by dividing workers into a control and an experimental group. Data analysis results showed a decrease in the level of musculoskeletal complaints by 55.9%, a decrease in the average index of risk exposure level by 25.2%, and no potential risk of injury to the lifting activity.
Milestone One Company Identification You have been hired as a.docxARIV4
Milestone One: Company Identification
You have been hired as a consultant at the company you have been researching (APPLE INC.). This report is an in-depth look at the strategy and corporate management based on your detailed research completed throughout the semester.
Identify the company you are researching along with answers to the Component 1 assignment questions.
Company: Apple Inc.
Strategy and the Strategic Management Process at your Chosen Company
Describe the industry you are investigating. Identify the company you are researching along with the mission, vision, values, and strategic plan. Be sure to answer the following questions:
· Describe the industry in which the company operates.
· What is the company’s stated strategy? Is it a winning strategy?
· How does the company’s mission statement compare to those of its competitors?
· How do the mission, vision, and values support strategic objectives or performance targets of your company?
· What do the mission, vision, and value statements say about the company and its leadership?
APA format, with citation within the text and reference page (academic resources at least 2).
MOS 6625, System Safety Engineering 1
Course Learning Outcomes for Unit III
Upon completion of this unit, students should be able to:
3. Evaluate new approaches to safety based on modern systems thinking and theory.
3.1 Demonstrate an understanding of the Systems-Theoretic view of causality.
3.2 Demonstrate a working knowledge of the STAMP model of accident causation.
Reading Assignment
Chapter 6: Engineering and Operating Safer Systems Using STAMP
Chapter 7: Fundamentals
Unit Lesson
In the first two units, we learned about Deming’s (1986) engineering design for continuous improvement
(Plan-Do-Check-Act or PDCA cycle), and we learned about our role as scholar-practitioners of safety
engineering being firmly rooted as decision management scientists. Further, we were introduced to Leveson’s
(2011) STAMP (Systems-Theoretic Accident Model and Process) causality model, synthesized from
traditional safety engineering models of accident causation, and reengineered to a systems perspective.
In this unit, we are revisiting the STAMP model while learning to apply and deploy the STAMP in various other
applications related to a wide cross-section of industry sectors. One critical aspect of Leveson’s (2011)
STAMP model design is the careful incorporation of three major components of a cost-effective system safety
process. These include the subsystems of management, development, and operations within the larger
system. As such, this design effectively incorporates the most powerful design features known to optimize the
decision-making process, given that the STAMP model works to align and subsequently address processes. It
can then be used to identify controls with a clear, linear perspective of systems component criteria
interrelationships (see Figure 6.1). This means that as schol ...
Similar to Aplicación ergonómica metologia rosa Sonne et al., 2011 (20)
The prostate is an exocrine gland of the male mammalian reproductive system
It is a walnut-sized gland that forms part of the male reproductive system and is located in front of the rectum and just below the urinary bladder
Function is to store and secrete a clear, slightly alkaline fluid that constitutes 10-30% of the volume of the seminal fluid that along with the spermatozoa, constitutes semen
A healthy human prostate measures (4cm-vertical, by 3cm-horizontal, 2cm ant-post ).
It surrounds the urethra just below the urinary bladder. It has anterior, median, posterior and two lateral lobes
It’s work is regulated by androgens which are responsible for male sex characteristics
Generalised disease of the prostate due to hormonal derangement which leads to non malignant enlargement of the gland (increase in the number of epithelial cells and stromal tissue)to cause compression of the urethra leading to symptoms (LUTS
micro teaching on communication m.sc nursing.pdfAnurag Sharma
Microteaching is a unique model of practice teaching. It is a viable instrument for the. desired change in the teaching behavior or the behavior potential which, in specified types of real. classroom situations, tends to facilitate the achievement of specified types of objectives.
Title: Sense of Taste
Presenter: Dr. Faiza, Assistant Professor of Physiology
Qualifications:
MBBS (Best Graduate, AIMC Lahore)
FCPS Physiology
ICMT, CHPE, DHPE (STMU)
MPH (GC University, Faisalabad)
MBA (Virtual University of Pakistan)
Learning Objectives:
Describe the structure and function of taste buds.
Describe the relationship between the taste threshold and taste index of common substances.
Explain the chemical basis and signal transduction of taste perception for each type of primary taste sensation.
Recognize different abnormalities of taste perception and their causes.
Key Topics:
Significance of Taste Sensation:
Differentiation between pleasant and harmful food
Influence on behavior
Selection of food based on metabolic needs
Receptors of Taste:
Taste buds on the tongue
Influence of sense of smell, texture of food, and pain stimulation (e.g., by pepper)
Primary and Secondary Taste Sensations:
Primary taste sensations: Sweet, Sour, Salty, Bitter, Umami
Chemical basis and signal transduction mechanisms for each taste
Taste Threshold and Index:
Taste threshold values for Sweet (sucrose), Salty (NaCl), Sour (HCl), and Bitter (Quinine)
Taste index relationship: Inversely proportional to taste threshold
Taste Blindness:
Inability to taste certain substances, particularly thiourea compounds
Example: Phenylthiocarbamide
Structure and Function of Taste Buds:
Composition: Epithelial cells, Sustentacular/Supporting cells, Taste cells, Basal cells
Features: Taste pores, Taste hairs/microvilli, and Taste nerve fibers
Location of Taste Buds:
Found in papillae of the tongue (Fungiform, Circumvallate, Foliate)
Also present on the palate, tonsillar pillars, epiglottis, and proximal esophagus
Mechanism of Taste Stimulation:
Interaction of taste substances with receptors on microvilli
Signal transduction pathways for Umami, Sweet, Bitter, Sour, and Salty tastes
Taste Sensitivity and Adaptation:
Decrease in sensitivity with age
Rapid adaptation of taste sensation
Role of Saliva in Taste:
Dissolution of tastants to reach receptors
Washing away the stimulus
Taste Preferences and Aversions:
Mechanisms behind taste preference and aversion
Influence of receptors and neural pathways
Impact of Sensory Nerve Damage:
Degeneration of taste buds if the sensory nerve fiber is cut
Abnormalities of Taste Detection:
Conditions: Ageusia, Hypogeusia, Dysgeusia (parageusia)
Causes: Nerve damage, neurological disorders, infections, poor oral hygiene, adverse drug effects, deficiencies, aging, tobacco use, altered neurotransmitter levels
Neurotransmitters and Taste Threshold:
Effects of serotonin (5-HT) and norepinephrine (NE) on taste sensitivity
Supertasters:
25% of the population with heightened sensitivity to taste, especially bitterness
Increased number of fungiform papillae
Report Back from SGO 2024: What’s the Latest in Cervical Cancer?bkling
Are you curious about what’s new in cervical cancer research or unsure what the findings mean? Join Dr. Emily Ko, a gynecologic oncologist at Penn Medicine, to learn about the latest updates from the Society of Gynecologic Oncology (SGO) 2024 Annual Meeting on Women’s Cancer. Dr. Ko will discuss what the research presented at the conference means for you and answer your questions about the new developments.
Pulmonary Thromboembolism - etilogy, types, medical- Surgical and nursing man...VarunMahajani
Disruption of blood supply to lung alveoli due to blockage of one or more pulmonary blood vessels is called as Pulmonary thromboembolism. In this presentation we will discuss its causes, types and its management in depth.
MANAGEMENT OF ATRIOVENTRICULAR CONDUCTION BLOCK.pdfJim Jacob Roy
Cardiac conduction defects can occur due to various causes.
Atrioventricular conduction blocks ( AV blocks ) are classified into 3 types.
This document describes the acute management of AV block.
ARTIFICIAL INTELLIGENCE IN HEALTHCARE.pdfAnujkumaranit
Artificial intelligence (AI) refers to the simulation of human intelligence processes by machines, especially computer systems. It encompasses tasks such as learning, reasoning, problem-solving, perception, and language understanding. AI technologies are revolutionizing various fields, from healthcare to finance, by enabling machines to perform tasks that typically require human intelligence.
Ozempic: Preoperative Management of Patients on GLP-1 Receptor Agonists Saeid Safari
Preoperative Management of Patients on GLP-1 Receptor Agonists like Ozempic and Semiglutide
ASA GUIDELINE
NYSORA Guideline
2 Case Reports of Gastric Ultrasound
Ozempic: Preoperative Management of Patients on GLP-1 Receptor Agonists
Aplicación ergonómica metologia rosa Sonne et al., 2011
1. Development and evaluation of an office ergonomic risk checklist:
ROSA e Rapid office strain assessment
Michael Sonne a,b
, Dino L. Villalta b
, David M. Andrews a,*
a
Department of Kinesiology, University of Windsor, 401 Sunset Avenue, Windsor, Ontario, Canada N9B 3P4
b
LeadErgonomics, Tecumseh, Ontario, Canada
a r t i c l e i n f o
Article history:
Received 28 May 2010
Accepted 29 March 2011
Keywords:
Office ergonomics
Checklists
Risk assessment
a b s t r a c t
The Rapid Office Strain Assessment (ROSA) was designed to quickly quantify risks associated with
computer work and to establish an action level for change based on reports of worker discomfort.
Computer use risk factors were identified in previous research and standards on office design for the
chair, monitor, telephone, keyboard and mouse. The risk factors were diagrammed and coded as
increasing scores from 1 to 3. ROSA final scores ranged in magnitude from 1 to 10, with each successive
score representing an increased presence of risk factors. Total body discomfort and ROSA final scores for
72 office workstations were significantly correlated (R ¼ 0.384). ROSA final scores exhibited high inter-
and intra-observer reliability (ICCs of 0.88 and 0.91, respectively). Mean discomfort increased with
increasing ROSA scores, with a significant difference occurring between scores of 3 and 5 (out of 10). A
ROSA final score of 5 might therefore be useful as an action level indicating when immediate change is
necessary. ROSA proved to be an effective and reliable method for identifying computer use risk factors
related to discomfort.
Ó 2011 Elsevier Ltd and The Ergonomics Society. All rights reserved.
1. Introduction
The amount of computer work has dramatically increased in the
past 20 years. In 2000, 60% of workers were required to use
a computer as part of their job duties, with 80% of those workers
reporting that they used a computer on a daily basis (Marshall,
2001; Lin and Popovic, 2003). This number is up from 50% in
1994, and 39% in 1989 (Lowe, 1997). This increasing trend in
computer usage in the workplace has not come without a cost to
the wellbeing of workers. In a review by Wahlström (2005), the
prevalence of musculoskeletal disorders was reported to be
between 10 and 62% for all computer workers. Furthermore, since
the inception of occupational computer use, there has been
a similar increase in the number of musculoskeletal disorders
reported (Bayeh and Smith, 1999; Wahlström, 2005).
Musculoskeletal disorders associated with occupational
computer use are primarily linked to the upper limbs (Gerr et al.,
2002), head and neck (Korhonen et al., 2003; Hagberg and
Wegman, 1987), and back (Jensen et al., 2002). Repetitive motion
of the fingers, hands and wrists, sustained awkward postures of the
wrist and forearm, and contact pressures in the wrist have been
proposed as possible mechanisms of injury related to the use of the
keyboard and mouse (Village et al., 2005). Elevated pressure in the
tissues surrounding nerves in the upper extremities has been
shown to increase with sustained non-neutral postures, which may
lead to further discomfort and injury (Keir et al.,1999). Mechanisms
of injury and discomfort for the back while computing include
muscle fatigue, which results from increased levels of erector spi-
nae activation when sitting as compared to standing (Callaghan and
McGill, 2001), as well as improper sitting posture contributing to
a lack of support while sitting (Keegan, 1953; Harrison et al., 1999).
Graphics-based checklists are commonly used to perform
ergonomic analyses, specifically in jobs that feature low intensity,
repetitive work, or require workers to perform awkward postures
(McAtamney and Corlett, 1993; Hignett and McAtamney, 2000;
Karhu et al., 1977). The Rapid Upper Limb Assessment (RULA) tool
has previously been used to examine worker interactions with
a computer in an office environment (McAtamney and Corlett,
1993; Lueder, 1996; Robertson et al., 2009). Hazardous postures,
such as wrist extension or radial or ulnar deviation (Serina et al.,
1999) can be directly attributable to the use of improper office
equipment and equipment setup. However, the direct influence of
office equipment (e.g. chair, telephone and monitor) on the worker
is not necessarily identified using RULA. The Office Ergonomic
Assessment tool (OEA) (Robertson et al., 2009) offers an alternative
approach for assessing the office using a checklist format. While the
* Corresponding author. Tel.: þ1 519 253 3000x2433; fax: þ1 519 973 7056.
E-mail address: dandrews@uwindsor.ca (D.M. Andrews).
Contents lists available at ScienceDirect
Applied Ergonomics
journal homepage: www.elsevier.com/locate/apergo
0003-6870/$ e see front matter Ó 2011 Elsevier Ltd and The Ergonomics Society. All rights reserved.
doi:10.1016/j.apergo.2011.03.008
Applied Ergonomics 43 (2012) 98e108
2. OEA is as an excellent method for measuring workstation adjust-
ability and worker training outcomes, it doesn’t result in outcomes
that have been directly correlated with worker discomfort, nor are
there scoring or action levels like in RULA that indicate when
further intervention is required. Other risk assessment methods
have aimed to quantify risk factors related to repetitive upper limb
tasks, including the Quick Exposure Checklist (Li and Buckle, 1999)
and the Assessment of Repetitive Tasks tool (Health and Safety
Executive, 2010). A strength of both of these tools is the estab-
lished action levels which direct the user to the urgency and extent
of the intervention required to eliminate risk factors for this task.
Although neither of these tools feature risk factors that are specific
to office work, they have shown good sensitivity and reliability
(Li and Buckle, 1999).
Traditional approaches to office ergonomic risk management,
training and assessment have come in the following forms: litera-
ture, ergonomic redesign, individual assessment and group training
(Bohr, 2002). Ideally, an ergonomic redesign of the entire work-
space is the most effective method of intervention if the goal is to
completely eliminate risk factors in the office environment instead
of just control them. However, this approach is very costly and time
intensive. With respect to cost, the next best approach is to provide
training to workers, and then allow them to actively make adjust-
ments to their workspace (Bohr, 2002). However, in certain situa-
tions, workers may not be able to make adjustments (due to
non-adjustable furniture, space constraints or a lack of equip-
ment). Consequently, ergonomic redesign or equipment purchase
may be the only option to eliminate hazards from the workstation.
Traditional ergonomic assessments may highlight risk factors, and
possible solutions, but do not provide a clear picture of how to
prioritize the risks and allow for the most effective solutions to be
purchased or implemented. This problem is amplified as the
number of employees and workstations in a given office environ-
ment that would benefit from new products increases. A combined
approach of workers receiving adjustable furniture, followed by
training to use the furniture, appears to be the most effective
method of reducing musculoskeletal disorder symptoms (Amick
et al., 2003). In order to prioritize risks in the office to identify
who should receive furniture or other equipment first, a quantifi-
able method must be used to indicate which problem areas pose
the greatest risk, and how urgently these risks need to be
addressed.
Therefore, the purpose of this study was to develop and evaluate
a new office risk assessment tool, the Rapid Office Strain Assess-
ment (ROSA), that can quickly quantify risks associated with each
component of a typical office workstation, and provide information
to the user regarding the need for change based on reports of
discomfort related to office work.
2. Methods
2.1. Tool development
The Rapid Office Strain Assessment (ROSA) was created
using postures that were described in the CSA Z412 guidelines for
office ergonomics (Canadian Standards Association (CSA), 2000)
and on the Canadian Centre for Occupational Health and Safety
website (Canadian Centre for Occupational Health and Safety
(CCOHS), 2005). The CSA standards were developed by a panel of
experts (from both the professional and academic domains) in
Canadian ergonomics. This document was thoroughly reviewed
until a consensus on proper workstation setup was reached.
CSA standard Z412 is based on ISO Standard ENISO9241: Ergonomic
requirement for office work with visual display terminals
(International Standards Association, 1997). References such as
Ergonomic Design for People at Work (Eastman Kodak Company,
1983) and Work Related MSD: A Reference Book for Prevention
(Hagberg et al., 1995) served as further guidance for the production
of these guidelines. These documents outline information on
identifying the unique characteristics of office work, achieving a fit
between furniture and the worker, and optimizing the design of
the workstations and jobs. All postures that were described as ideal
or neutral in the CSA standards were given a score of 1 and became
the minimum score for each area within the sub-sections of the tool
(see below) (Fig. 1). Deviations from the neutral postures were
scored in a linearly increasing manner from values of 1 to 3. Certain
factors that could be used concurrently with base risk factors (for
example, chair height and chair height adjustability) were given
scores of þ1. These scores can be added to the base section scores.
Risk factors were grouped into the following areas: chair, monitor,
telephone, keyboard and mouse. In each of these areas, the
maximum score that can reasonably be achieved is tallied and set
as the highest possible value on the developed scoring charts
(Fig. 1).
The scoring charts were developed by matching two office sub-
sections against each other in order to get a complete score for that
area. These sub-sections were seat pan height and seat pan depth,
backrest and arm supports, monitor and telephone, and keyboard
and mouse. The maximum scores from each of the sections were
used as the horizontal and vertical axes for the sub-section scores
(which were subsequently used to create the ROSA final score). The
scores from the monitor and telephone, and keyboard and mouse
are then compared in another chart to receive the peripheral score.
The ROSA final score is derived by comparing the peripheral chart
against the chair score (Section 2.2).
A draft of the completed ROSA tool was given to 5 expert
reviewers that worked as professional ergonomists. All of the
experts had at minimum, a master’s degree in kinesiology with
specific focus in ergonomics and biomechanics. Consequently, the
experts had specific knowledge regarding ergonomic tool use and
development and considerable background in postural assessment
and biomechanics. Additionally, all experts had extensive experi-
ence in the field of ergonomic consulting, specifically related to
office work, and were selected for participation in this study
because of their overall expertise related to office work assessment
and tool use. The experts were given a training package that out-
lined how ROSA was to be used and detailed breakdowns of each of
the scoring sections and scoring charts. The experts were told to
use the tool and provide feedback on or report any issues with the
images selected in the tool, the individual posture scores, or any of
the scores within the charts. The feedback from the individual
reviewers was then collated, and changes were made to the tool via
consensus.
2.2. Creation of scoring charts
The design of the section A, B, C, peripheral and final score charts
in ROSA (Fig. 2) is reflective of the increasing values (related to risk
level) found within the head/trunk/neck and grand score charts in
RULA (McAtamney and Corlett, 1993). The scores used to select
values along the axes in these scoring charts are achieved by
summing the values associated with the individual risk factors in
the specific sub-sections (chair components, monitor, telephone,
mouse and keyboard) (Fig.1). The maximum possible score that can
be achieved for the sub-sections is reflective of the presence of all
possible risk factors, as well as the maximum duration of use value
(Section 2.3.7 below). Within the chair scoring chart and the
peripherals scoring chart, the highest possible score that can be
achieved is a score of 10. This is also the case in the final score chart.
The value of 10 was chosen to provide users with an easy to
M. Sonne et al. / Applied Ergonomics 43 (2012) 98e108 99
3. understand 1e10 scoring system that would reflect the amount of
risk that was present in the workstation.
2.3. Individual posture and equipment scores
The scores for each risk factor were modelled after deviations
from the neutral posture, as cited by the CSA standards on office
ergonomics (CSA International, 2000). The deviations are also
supported as risk factors for the onset of musculoskeletal disorders
based on supporting literature, as well as information contained
within the CSA standards.
2.3.1. Office chair scores
As indicated in CSA standard Z412 (CSA International, 2000), the
neutral seated posture for an individual is to have the knees bent at
approximately 90 with the feet flat on the floor. Risk factors related
to the chair being too high include impinged blood vessels in the
thigh, which lead to the legs (Tichauer and Gage, 1978), and the
worker adopting a posture where they sit on the edge of the chair,
increasing lower back muscle activity (Harisinghani et al., 2004). If
the chair is too low, there may be excessive pressure under the
buttocks, as well as unnecessary spinal lean and pelvic rotation that
compromises the lumbar spine curve (Harrison et al., 1999).
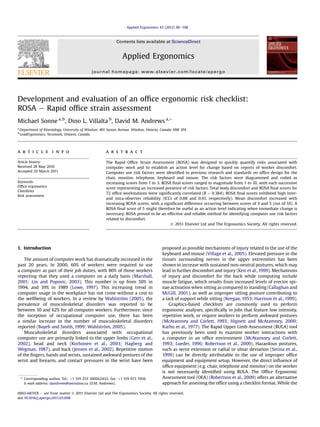
Fig. 2. Scoring charts for sub-sections (A, B and C), monitor and peripherals score, and ROSA final score, as well as a scoring example.
Fig. 1. Scores and diagrams for the risk factors associated with seat pan height (A), seat pan depth (B), armrest (C) and back support (D).
M. Sonne et al. / Applied Ergonomics 43 (2012) 98e108100
4. The seat pan should allow for approximately 5 cme7 cm of
space between the back of the knee and the edge of the chair (CSA
International, 2000). If the seat depth is too long, the backrest will
not support the lower back, and the resulting rearward curvature of
the spine may lead to discomfort (CSA International, 2000;
Harrison et al., 1999). Additionally, if the seat pan is too short,
pressure will be placed on the back of the thigh, compressing blood
vessels and nerves (Tichauer and Gage, 1978).
The armrests should be positioned so the elbows are at 90 and
the shoulders are in a relaxed position (CSA International, 2000).
The presence of armrests on a chair has also been reported to
increase comfort in users (Hasegawa and Kumashiro, 1998), and
reduce the static loading on the shoulder and arm muscles during
mousing (CSA International, 2000; Lueder and Allie, 1997). It is
important that the armrest be free of sharp or hard edges, as this
may cause pressure points leading to damage to the soft tissues in
the forearms (Szabo and Gelberman, 1987).
The lumbar support should be adjusted to fit in the small of the
back in order to maintain the natural curve of the lumbar spine
(CSA International, 2000). Without proper lumbar support, the
lumbar spine loses the natural lordotic curve, increasing the strain
on the ligaments, tendons and muscles in the back (Harrison et al.,
1999). The worker should be sitting reclined at approximately
95e110 (CSA International, 2000). The incline level of 110
provides a reasonable compromise between the decrease in lumbar
muscle activity and a reduction of reaching for office equipment
(Harrison et al., 1999).
The chair section was partitioned into 4 smaller sub-sections:
the seat pan height, the seat pan depth, the armrest position and
the back support position. The risk factors and associated scores
and diagrams for each of these sub-sections are outlined in Table 1
and Fig. 1.
2.3.2. Monitor scores
According to the CSA Standards, the monitor should be posi-
tioned between 40 cm and 75 cm from the user (CSA International,
2000). The most effective method to determine the proper viewing
distance for workers is to instruct them to position the monitor at
an arm’s length. The user should be able to view the screen while
sitting back in the chair. The height of the screen should be posi-
tioned at eye level, or just below the worker’s seated eye height.
The bottom of the screen should be at no greater than 30 below
the worker’s eye level. Monitor positions lower or higher than this
Table 1
Risk factors (including references) and scores associated with seat pan height, seat
pan depth, armrests, and back support. The risk factors and scores correspond to the
diagrams in Fig. 2.
Risk factor (reference) Score
Seat pan height
Knees bent to approximately 90
(CSA International, 2000). (1)
Seat too low e knee angle less than 90
(CSA International, 2000).
(2)
Seat too high e knee angle greater than 90
(Tichauer and Gage, 1978).
(2)
No foot contact with ground (Tichauer and Gage, 1978). (3)
Insufficient space for legs beneath the desk surface
(CSA International, 2000).
(þ1)
Seat pan height is non-adjustable (CSA International, 2000). (þ1)
Seat pan depth
Approximately 7.5 cm of space between the edge of
the chair and the back of the knee (CSA International, 2000).
(1)
Seat pan length too long (less than 7.5 cm of space between
the edge of chair and the back of the knee
(Tichauer and Gage, 1978; CSA International, 2000).
(2)
Seat pan too short (more than 7.5 cm of space between
the edge of the chair and the back of the knee
(Tichauer and Gage, 1978).
(2)
Seat pan depth is non-adjustable (CSA International, 2000). (þ1)
Armrests
Elbows are supported at 90
, shoulders are relaxed
(CSA International, 2000)
(1)
Armrests are too high (shoulders are shrugged)
(Lueder and Allie, 1997)
(2)
Armrests are too low (elbows are not supported)
(CSA International, 2000).
(2)
Armrests are too wide (elbows are not supported,
or arms are abducted while using the armrests
(Hasegawa and Kumashiro, 1998).
(þ1)
The armrests have a hard or damaged surface e creating
a pressure point on the forearm (Szabo and Gelberman, 1987).
(þ1)
Armrests or arm support is non-adjustable
(CSA International, 2000).
(þ1)
Back support
Proper back support e lumbar support and chair
is reclined between 95
and 110
(CSA International, 2000)
(1)
No lumbar support (Harrison et al., 1999). (2)
Back support is reclined too far (greater than 110
)
(Harrison et al., 1999).
(2)
No back support (i.e., stool or improper sitting posture)
(Harrison et al., 1999).
(2)
Back support is non-adjustable (CSA International, 2000). (þ1)
Table 2
Risk factors (including references) and scores associated with monitor, telephone,
mouse, and keyboard. The risk factors and scores correspond to the diagrams in
Fig. 3.
Risk factor (reference) Score
Monitor
Screen at arm’s length/screen positioned at eye level
(CSA International, 2000)
(1)
Screen too low (causing neck flexion to view screen)
(Burgess-Limerick et al., 1998).
(2)
Screen too high (causing neck extension to view screen)
(Burgess-Limerick et al., 1998).
(3)
User required to twist neck in order to view screen
(Tittiranonda et al., 1999).
(þ1)
Screen too far (outside of arm’s length (75 cm))
(CSA International, 2000)
(þ1)
Document holder not present and required
(CSA International, 2000).
(þ1)
Telephone
Headset used/one hand on telephone and neck in a
neutral posture, telephone positioned within 300 mm
(CSA International, 2000).
(1)
Telephone positioned outside of 300 mm
(Tittiranonda et al., 1999).
(2)
Neck and shoulder hold used (CSA International, 2000). (þ2)
No hands free options (CSA International, 2000). (þ1)
Mouse
Mouse in line with the shoulder (CSA International, 2000). (1)
Reach to mouse/mouse not in line with the shoulder
(Cook and Kothiyal, 1998).
(2)
Pinch grip required to use mouse/mouse too small
(CSA International, 2000).
(þ1)
Mouse/keyboard on different surfaces
(Cook and Kothiyal, 1998).
(þ2)
Hard palm rest/pressure point while mousing
(CSA International, 2000; McMillan, 1999).
(þ1)
Keyboard
Wrists are straight, shoulders are relaxed
(CSA International, 2000).
(1)
Wrists are extended beyond 15
of extension
(Fagarasanu and Kumar, 2003).
(2)
Wrists are deviated while typing
(Gerr et al., 2006; Khan et al., 2009).
(þ1)
Keyboard too high e shoulders are shrugged
(Lueder and Allie, 1997).
(þ1)
Keyboard platform is non-adjustable
(CSA International, 2000).
(þ1)
M. Sonne et al. / Applied Ergonomics 43 (2012) 98e108 101
5. are associated with increased muscle activity in the neck (Seghers
et al., 2003; Turville et al., 1998). The monitor should be posi-
tioned directly in front of the worker, as off-centre monitor posi-
tions have been show to increase the demands on the neck
(Tittiranonda et al., 1999). The risk factors and scores for the
monitor are found in Table 2, and the corresponding diagrams
associated with the monitor in the ROSA checklist are shown in
Fig. 3A.
2.3.3. Telephone scores
The risk factors and scores for the telephone and the corre-
sponding diagrams in ROSA are provided in Table 2 and Fig. 3B,
respectively. As shown, the telephone should be positioned within
300 mm of the worker in order to eliminate extensive reaching
(CSA International, 2000). Additionally, it is recommended that
using a static contraction to hold the telephone headset between
the neck and shoulder should be avoided. To accomplish this, it is
recommended that the worker use a hands free device, such as
speakerphone or a headset.
2.3.4. Mouse scores
The mouse should be positioned so it is in a direct line with the
shoulder. The mouse should be positioned on the same level as
the keyboard in order to keep the shoulder relaxed. Increasing the
amount of reach required to use the mouse is associated with
increased muscle activity (Cook and Kothiyal, 1998). It should also
not cause the worker to extend or deviate the wrist while moving
the mouse, as these wrist postures have been identified as risk
factors in other tools used to identify hazards for MSDs in the upper
extremities (McAtamney and Corlett, 1993). The mouse itself
should accommodate the size of the worker’s hand, not creating
a pinch grip or pressure points (CSA International, 2000). Mouse-
related risk factors and diagrams are shown in Table 2 and Fig. 3C.
2.3.5. Keyboard scores
The keyboard placement should allow the worker to use the
keyboard with the elbows bent at approximately 90 and
the shoulders in a relaxed position (CSA International, 2000). The
wrists should also be straight. Elevated heights of the keyboard can
cause increased upper back and shoulder muscle activity, leading to
discomfort (Korhonen et al., 2003; Marcus et al., 2002). The
majority of the risk factors associated with keyboard use are a result
of the posture of the wrist, which is similar to the wrist-related risk
factors of wrist extension (Fagarasanu and Kumar, 2003) and wrist
deviation (Serina et al., 1999) found in RULA (McAtamney and
Corlett, 1993). Additionally, there should be no hard surfaces that
can cause a pressure point on the carpal tunnel, as this may lead to
carpal tunnel syndrome (CCOHS, 2005). Table 2 and Fig. 3D depict
the risk factors and ROSA checklist diagrams for the keyboard.
2.3.6. Other workstation scores
Other risk factors that did not have their own section were
included in specific sub-sections of ROSA based on their mechanical
relationships. These were: (1) Reaching to overhead items (þ1) was
located in the keyboard section (Fig. 3), as it is predominantly an
upper limb movement (Tittiranonda et al., 1999); (2) Work surface
is too high (þ1) was located in the back support section (chair)
(Fig. 2) as a work surface that is too high would affect the shoulders
and upper back. This risk factor is similar to that of an improper
back support that causes a worker to sit forward on the chair.
A work surface that is too high may also cause the worker to sit in
the chair without back support (Lueder and Allie, 1997).
Fig. 3. Scores and diagrams for the risk factors associated with the monitor (A), telephone (B), mouse (C) and keyboard (D).
M. Sonne et al. / Applied Ergonomics 43 (2012) 98e108102
6. 2.3.7. Duration of use scores
For each section of ROSA, the area score is influenced by
a duration score. A significant increase in the prevalence of
musculoskeletal disorders in workers that use the computer for
greater than 4 h per day has been reported (Blatter and Bongers,
2002). Other studies have indicated that signs of muscle fatigue
in the upper extremities may occur within an hour as a result of
static contractions under 10% of maximum voluntary contraction
(Jorgensen et al., 1988). Office work has been shown to cause
workers to exert between 7% and 15% of their maximum voluntary
contraction (MVC) in the trapezius muscles (Hagberg and Sundelin,
1986).
After scores are calculated for the chair, monitor, telephone,
keyboard and mouse sections, they are modified by a duration
score. If a worker uses a piece of equipment for more than 1 h
continuously or 4 h per day, the duration score is assigned a value
of þ1. If the worker uses the equipment for between 30 min and 1 h
continuously or between 1 and 4 h per day, then the duration score
will be given a value of zero. For less than 30 min of continuous
work or 1 h of total work per day, the duration score is given
a value of À1.
2.4. Tool use instructions
When using the ROSA, an observer selects the appropriate
scores based on the posture of the worker as they are observed at
their computer workstation. A brief interview with the worker
should also be conducted to understand their work composition.
The scores for the seat pan height and pan depth are added
together to compose the vertical axis of the “Section A” scoring
chart, and the scores for the armrest and back support are
combined to compose the horizontal axis of “Scoring Chart A”
(Fig. 2). The score from the chair scoring chart is then modified
based on the duration score (1, 0, or À1).
The monitor score is achieved by observing the interactions of
the user with the monitor and any associated documents. This area
score is then modified based on the duration score for monitor use,
and the final score for the monitor is used to form the horizontal
axis on the “Section B” scoring chart. The telephone interaction
score is recorded and modified by the duration value to produce the
score along the vertical axis of the “Section B” scoring chart.
Mouse usage is also observed, and the corresponding score
recorded based on the user’s equipment and work techniques with
their cursor control device. The score from the mouse area is also
modified based on the duration value for mouse use, and forms the
horizontal axis for “Scoring Chart C”. Keyboard usage is similarly
observed and recorded and modified by the duration value for
keyboard use. This score forms the vertical axis for “Scoring
Chart C”.
The monitor and peripherals scoring chart is used to compare
the risk level between the chair and the user’s computer input and
office peripheral devices. To obtain the monitor and peripherals
score, the observer uses the score received in “Section B” as the
value for the horizontal axis, and the score received in “Section C”
as the value for the vertical axis. This area score is then used as the
value on the horizontal axis for the ROSA final score scoring chart
(Fig. 2).
To receive the final risk factor score for ROSA, the value from
Chart A (the chair) e is used as the vertical axis score on the final
score chart, and the value from the monitor and peripherals scoring
chart is used as the horizontal axis. This score is a reflection of the
overall risk level in the office environment, similar to the grand
score presented in RULA (McAtamney and Corlett, 1993). An
example of a ROSA assessment can be seen in Table 3, as well as in
Fig. 2.
3. Experimental design
3.1. Assessing discomfort relationships in ROSA
Seventy two office ergonomic assessments (7 males, 65 females)
were conducted to examine the relationship between the ROSA
area and final scores and the workers’ reported levels of discomfort.
Subjects were recruited from the administrative support staff at
a hospital, and fit the inclusion criterion of spending at least 50% of
their workday at the computer. Subjects were informed of the
experimental procedure (which was approved by the University of
Windsor and Hotel-Dieu Grace Hospital Research Ethics Boards),
and signed an informed consent form.
In each office assessment, subjects were first asked to complete
the Cornell University Discomfort Questionnaire (CUDQ) (Hedge
et al., 1999). The CUDQ examines the frequency and intensity of
discomfort that a worker experiences and the effects that this
discomfort has on workers’ productivity. The CUDQ is similar to the
Nordic questionnaire (Kuorinka et al., 1987) in the way that
discomfort is profiled by body part, and the individual filling out
the questionnaire is able to view a diagram of the body as a refer-
ence point for identifying their discomfort. This questionnaire has
been extensively tested and has been shown to possess high val-
idity and reliability (Erdinç et al., 2008). The frequency of discom-
fort was coded as e never (0), 1e2 times weekly (1.5), 3e4 times
Table 3
Example of how a ROSA final score is achieved by combining scores from all sub-
sections (also follow flow of scoring charts in Fig. 2).
Risk factors Score
Chair height 3
Too high (2)
Non-adjustable (þ1)
Chair depth 1
75 cm space between back of the knee
and the edge of the chair (1)
Armrests 3
Armrests too high (2)
Non-adjustable (þ1)
Back support 4
No lumbar support (2)
Work surface too high (þ1)
Non-adjustable (þ1)
Duration 1
Greater than 4 h per day (þ1)
Section A score 7
Monitor 5
Too high (3)
Documents e no holder and required (þ1)
Duration e greater than 4 h per day (þ1)
Telephone 1
Headset/neutral neck posture (1)
Duration e between 1 and 4 h per day (0)
Section B score 4
Mouse 4
Reaching to mouse (2)
Palmrest in front of mouse (þ1)
Duration e greater than 4 h per day (þ1)
Keyboard 2
Wrists straight (1)
Duration e greater than 4 h per day (þ1)
Section C score 4
Section B e monitor and telephone score 4
Section C e mouse and keyboard score 4
Monitor and peripherals score 4
Section A e chair score 7
Monitor and peripherals score 4
ROSA final score 7
M. Sonne et al. / Applied Ergonomics 43 (2012) 98e108 103
7. weekly (3.5), once every day (5) and several times daily (10). This
score was multiplied by the intensity of the discomfort, which was
coded as slightly uncomfortable (1), moderately uncomfortable (2)
and severely uncomfortable (3). Finally, the impact on productivity
was used as a final multiplier, and was coded as not at all (1),
slightly interfered (2), and substantially interfered (3). Therefore,
each body part could receive a maximum score of 90. Subjects also
reported their age (mean ¼ 45.4 years (SD ¼ 9.1 years)), gender (65
females, 7 males), height (mean ¼ 165 cm (SD ¼ 7.0 cm)), body
mass (mean ¼ 71.3 kg (SD ¼ 14.2 kg)), years of experience in their
specific job (mean ¼ 8.2 years (SD ¼ 8.3years)) and years of service
to the hospital (mean ¼ 16.6 years (SD ¼ 10.9years)).
To examine the effects of discomfort on areas that are known
to become injured during office work, such as the head and neck
(Gerr et al., 2002; Korhonen et al., 2003; Hagberg and Wegman,
1987), shoulder (Borg and Burr, 1997), hands and wrists (Jensen
et al., 2002) and lower back (Burdorf et al., 1993; Wilder and
Pope, 1996), a discomfort total was created without the leg
discomfort scores factored in.
Participants were then allowed to work at their own worksta-
tion for approximately 15 min while postures and interactions with
equipment were observed. The ROSA scores for the workstation
components were recorded on paper, and were later input into
a spreadsheet that calculated the ROSA final score. Subjects were
asked questions related to how long they would use each piece of
equipment continuously and during the entire workday. Assistance
was then given to each subject on how to better setup their
workstation.
Pearson product moment correlations were calculated to
determine the relationship between the various ROSA scores and
reported discomfort scores. The cumulative scores for the upper
back, shoulders, lower back, thigh and buttocks were correlated
independently with the ROSA chair score. The cumulative head/
neck and upper back scores were examined in relation to the ROSA
monitor and telephone scores. The combined shoulder, upper arm,
lower arm and hand/wrist discomfort scores were correlated
against the mouse and keyboard ROSA score. Finally, the ROSA final
score was correlated against total body discomfort (with and
without the leg discomfort included).
3.2. Action levels
Action levels found in the Rapid Upper Limb Assessment
(McAtamney and Corlett, 1993) classify the risk associated with
a task into one of four categories: posture is acceptable; further
investigation is needed and change may be required; investigation
and changes are required soon; and investigation and changes are
required immediately. To identify which final score values in ROSA
are associated with a need to perform immediate change, the mean
discomfort scores at each level across the range of ROSA scores
were compared using a one-way ANOVA with a Tukey’s HSD post-
hoc test. Significant increases in discomfort from one ROSA score to
another might indicate a change in risk. Such changes in risk could
be used as action levels for decision makers based on what office
configurations are acceptable and which ones require additional
assessment. A sensitivity and specificity analysis was also per-
formed (as per Chu, 1999) to examine positive and negative
predictive values with respect to mean discomfort levels at corre-
sponding ROSA final score levels.
3.3. ROSA reliability
To assess inter-observer reliability of ROSA, three trained
observers completed evaluations of 14 workstations simulta-
neously in the participating organization. The observers were all
experienced graduate students in ergonomics who had performed
office workplace assessments in the past 6 months. Each observer
was given a 30 min training presentation that outlined how ROSA
was used, and how to identify commonly occurring risk factors. To
assess intra-observer reliability, a workstation in a vacant office at
the University of Windsor was mocked-up such that each of the
three trained observers evaluated it in three different configura-
tions once per week for four weeks. The final scores and the chair,
monitor, telephone, mouse and keyboard scores from each
observer were examined using the intra-class coefficient (ICC), with
two-way random analysis for absolute agreement. Intra-observer
reliability was examined using a two-way random analysis ICC
for each observer, and average values were reported.
4. Results
4.1. ROSA scores
The mean ROSA final score for the 72 offices analyzed was 4.13
(out of 10). The mean (SD) section scores for the chair, monitor and
telephone, and mouse and keyboard were 3.08 (1.02), 2.58 (1.21),
3.65 (1.28) and 4.13 (1.14), respectively.
4.2. Relationships between discomfort and ROSA scores
The body parts reported to have the most significant levels of
discomfort were the neck and head (mean 17.7 (SD 24.7)),
lower back (mean 11.7 (SD 22.7)) and right shoulder (mean 10.7
(SD 18.8)). The areas with the lowest reported discomfort were the
left forearm (mean 1.28 (SD 3.9)), left thigh (mean 1.1 (SD 4.3)) and
left upper arm (mean 1.6 (SD 6.13)). The mean discomfort scores for
each body part can be found in Table 4.
All correlations between ROSA scores and discomfort were
significant (p 0.05), except between chair and chair discomfort,
and mouse and keyboard ROSA score and chair discomfort
(Table 5). The highest correlation was between total body
discomfort (without leg discomfort) and the monitor and phone
ROSA score (R ¼ 0.432). The total body discomfort (without leg
discomfort) and ROSA final score were moderately correlated
(R ¼ 0.384) (as per Field, 2005).
Mean reported total discomfort scores (without leg discomfort)
generally increased between ROSA final scores of 2 and 5. The mean
discomfort score at a ROSA final score 5 was significantly more than
at a ROSA final score 3, with the largest increase in mean discomfort
occurring between levels 4 and 5 of the ROSA final scores (Fig. 4A). A
similar trend was seen for the individual areas of chair (Fig. 4B),
monitor and telephone (Fig. 4C), and mouse and keyboard (Fig. 4D).
The sensitivity at a ROSA score of 5 was 76%, with specificity
measured at 68%. Positive and negative likelihood ratios were
measured to be 2.39 (CI: 1.49e3.84) and 0.34 (CI: 0.12e0.93),
respectively. The sensitivity increased to 84% at ROSA final score 4,
Table 4
Discomfort profiles for all body parts collected using the Cornell University
Discomfort Questionnaire (Hedge et al., 1999).
Mean Discomfort/90 (SD)
Neck/Head 17.72 (24.46) Right Hand/Wrist 7.85 (20.12)
Right Shoulder 10.74 (18.68) Left Hand/Wrist 4.26 (16.18)
Left Shoulder 7.52 (16.64) Hips/Buttocks 8.83 (21.06)
Upper Back 8.42 (15.62) Right Thigh 3.15 (13.22)
Right Upper Arm 3.76 (10.28) Left Thigh 1.13 (4.28)
Left Upper Arm 1.64 (6.13) Right Knee 5.08 (13.89)
Lower Back 11.70 (22.71) Left Knee 3.93 (12.99)
Right Forearm 4.09 (12.97) Right Leg 3.08 (15.53)
Left Forearm 1.28 (3.91) Left Leg 3.63 (16.47)
M. Sonne et al. / Applied Ergonomics 43 (2012) 98e108104
8. however specificity dropped to 45%, and the positive likelihood
ratio decreased to 1.56 (CI: 1.14e2.13). The negative likelihood
ratio remained was comparable between score 4 and 5 at 0.34
(CI: 0.13e0.88).
4.3. Reliability of ROSA
Inter-observer reliability was found to be strong in general, with
ICCs ranging from good (0.74) for the monitor and telephone ROSA
score, to excellent (0.83 and 0.91) for the mouse and keyboard
ROSA score and the final ROSA score, respectively (Portney and
Watkins, 2000). Moderate inter-observer reliability was seen for
the chair ROSA score, with an ICC of 0.51. Intra-observer reliability
was also found to be excellent with ICCs of 0.80 for the chair, 0.88
for the final score, 0.89 for the mouse and keyboard and 0.95 for the
monitor and telephone.
5. Discussion
The goals of developing the Rapid Office Strain Assessment tool
were to provide the health and safety professional or ergonomist
with a way of quantifying ergonomic risks in the office environ-
ment, and provide action levels based on worker discomfort that
can serve as screening points between workstations that require
further assessment and those that do not. These goals were ach-
ieved by establishing significant positive correlations between
discomfort and ROSA scores, as well as a proposed action level of 5.
5.1. Relationships between discomfort and ROSA scores
Significant positive correlations were found between the ROSA
area and total scores and total discomfort, indicating that
increasing ROSA scores are reflective of increasing musculoskeletal
discomfort. Correlations between total body pain and increasing
RULA scores were also seen in an office environment in a study
conducted by Dalkiliniç et al. (2002). Mean discomfort scores were
found to generally increase across all levels of the ROSA final score
collected, with a significant increase in discomfort scores between
level 3 and 5. In other words, a ROSA final score of 5 or greater was
found to be associated with a significant increase in worker
discomfort, and may indicate an increased potential for injury. The
value of 5 as an action level is further supported by balanced
sensitivity (77%) and specificity (68%) values when compared to
values at ROSA final scores of 4 (85% sensitivity and 46% specificity)
and 6 (100% sensitivity and 9.8% specificity). The balance between
sensitivity and specificity is important to achieve, as it indicates
that the tool will be more effective in distinguishing between false
Fig. 4. Localized mean (SE) discomfort scores vs. corresponding ROSA scores: (A) Total discomfort score (without legs) and ROSA final score; (B) Chair discomfort and ROSA score;
(C) Monitor/telephone discomfort and Monitor/telephone ROSA score; (D) Mouse/keyboard discomfort and Mouse/keyboard ROSA score.
Table 5
Correlations between total and area discomfort scores (Cornell University discom-
fort questionnaire: Hedge et al. (1999)) and ROSA final and area scores.
ROSA Score Total Discomfort Area Discomfort
With Legs Without Legs Chair Monitor and
Telephone
Mouse and
Keyboard
Final 0.363* 0.384* 0.341* 0.357* 0.394*
Chair 0.245* 0.281* 0.230 0.300* 0.248*
Monitor and
Telephone
0.408* 0.432* 0.247* 0.321* 0.417*
Mouse and
Keyboard
0.245* 0.281* 0.228 0.320* 0.366*
*Significant at p 0.05.
M. Sonne et al. / Applied Ergonomics 43 (2012) 98e108 105
9. positives and negatives (Chu, 1999). The likelihood ratio for a score
of 5 (2.4) was also higher than at scores of 4 (1.6) and 6 (1.1).
A likelihood ratio of greater than 2 has been associated with
a significant probability of musculoskeletal discomfort, whereas
a ratio of less than 2 is not associated with a significant ability to
predict discomfort or outcome (Jaeschke et al., 1994).
Having a discomfort-based action level is important, as it aids in
the decision making process for the individual interpreting the
ROSA scores. This does not mean that there is no risk associated
with scores of less than 5, but that the risk is less. However, if a large
scale office intervention is planned, it is recommended that those
offices who score 5 or higher be dealt with first. Similar to the
action levels found in RULA (McAtamney and Corlett, 1993), the
ROSA final score of 5 and greater should be used as the score that
indicates an office workstation requires further assessment, and
that changes should be considered immediately.
5.2. Reliability of ROSA
Inter-observer reliability was found to be good (ICC 0.5) for
the ROSA final and keyboard scores and excellent (0.75) (Portney
and Watkins, 2000) for the mouse and keyboard scores. Low inter-
and intra-observer reliability (ICC 0.5) was seen for the chair
scores, perhaps indicating that a redesign of the images that
identified specific postures and equipment conditions should be
further investigated. The reliability measures found in the study are
similar to those presented for other posture-based tools that have
been used to investigate office ergonomic issues (e.g. RULA grand
score ICCs between 0.65 and 0.85 (McAtamney and Corlett, 1993);
OEA ICCs of 0.91 (Robertson et al., 2009)). The relatively high reli-
ability values found in this study indicate that, with a small amount
of training, observers with ergonomic expertise can reliably iden-
tify risk factors in the office environment using the ROSA checklist.
5.3. Limitations
5.3.1. ROSA values found during assessment
A full range of ROSA final scores were not observed in this study
for several reasons. The low number of scores in the low end of the
range (scores 1 and 2) was due primarily to the lack of optimally
designed workstations in the workplace evaluated. However, most
workstations featured adjustable chairs, and surfaces that varied in
height between 66 cm and 81 cm; standard working heights as
indicated by CSA standard Z412 (CSA International, 2000). The
adjustability of the workstations prevented any ROSA final scores
from rising above a level of 7 on the 10-point scale. Although the
workstations evaluated in this study did not have enough risk
factors present to result in ROSA final scores above 6, scores greater
than this are not difficult to obtain. For example, a ROSA final score
of 8 would result if the following common conditions were present:
chair pan too high so worker could not touch their feet to the
ground; there was interference under the desk with the worker’s
legs; the chair height was non-adjustable; the seat pan length was
too long and non-adjustable and the user worked on the computer
for 1.5 h consecutively. This scenario is realistic for any worker that
is shorter than average and who sits on a non-adjustable chair.
Therefore, the limited range of ROSA final scores in this study was
directly related to the overall conditions in the particular workplace
that was evaluated, and is therefore not a critical limitation of the
tool itself.
5.3.2. Reporting of discomfort related to the workstation
Workers were asked to report the discomfort they had while at
work over the last week, regardless of what they believed the
source to be. This may have led to higher discomfort scores than
were directly associated with the workstation components alone.
Furthermore, self-reports of working posture, musculoskeletal
discomfort and office work duration have been shown to be over-
estimated by workers (Wiktorin et al., 1993; Homan and
Armstrong, 2003; Heinrich et al., 2004). While the discomfort
scores reported may have been exaggerated, the ease of collecting
discomfort data through the use of questionnaires made this
method appropriate for this study. Additionally, the practice of
using self-reported discomfort questionnaires is consistent with
other research conducted in the field of office ergonomics (Hedge
et al., 1991; Blatter and Bongers, 2002; Diepenmaat et al., 2004).
5.3.3. Improving the validity of ROSA
While a relationship appears to be evident between worker-
reported discomfort and the ROSA final and sub-section scores,
discomfort is not the only measure that can be used to establish the
validity of the tool. Extensive research has been conducted that has
linked increased muscular activity to working postures in the office
environment (e.g. Bauer and Wittig, 1998; van Dien et al., 2001;
Veiersted et al., 1990; Villaneuva et al., 1998). Future work should
include validating ROSA against muscle activation patterns
throughout the scoring ranges seen for final and sub-section scores.
RULA has been shown to be correlated with discomfort in video
display terminal work (McAtamney and Corlett, 1993). To examine
ROSA’s reliability and validity compared to other tools, future
studies could examine the relationship between ROSA scores and
RULA scores when examining workstations.
Furthermore, workstations were only assessed by experts with
extensive experience conducting office ergonomic evaluations.
While research on self-reporting of risk factors related to muscu-
loskeletal disorders has been inconsistent with respect to the
tendency of workers to either over or under report risk factors
(David, 2005; Heinrich et al., 2004; Homan and Armstrong, 2003),
a situation in which workers could self-report ROSA scores would
serve as a tremendous screening tool for an office ergonomics
program administrator. Other alternative methods of achieving
ROSA scores should be examined as well, including the use of
photographs and video (compared to observation in person). This
could establish how valid and versatile ROSA is in different envi-
ronmental contexts.
The risk factors that are evaluated using ROSA are those that can
be observed by the ergonomist. The relationship between
discomfort and ROSA final scores was expressed as a correlation
value of R ¼ 0.363, which indicates approximately 13% of discom-
fort is accounted for by increasing ROSA scores. Other research has
indicated that there are many other factors at play when examining
contributors to reported discomfort, such as job satisfaction, job
control and job identity (Kerr et al., 2001). One particular aspect
that is not considered by ROSA is the worker’s perceived comfort in
their chair and office. These factors could account for some of the
unexplained variance in the ROSA final score, but they cannot be
measured using a purely observational tool, which remains a main
goal of this approach.
Other risk factors that will emerge in the modern office envi-
ronment should be considered in future iterations of ROSA. Items
such as the use of dual monitors should be examined for their
impact on head and neck discomfort. Seat pan width may also
become an issue with the ever increasing obesity of the working
population (Hertz and McDonald, 2004), and may also be consid-
ered in future research.
6. Conclusions
The Rapid Office Strain Assessment proved to be an effective
method of assessing office workstations for risk factors related to
M. Sonne et al. / Applied Ergonomics 43 (2012) 98e108106
10. discomfort in the office environment. This initial evaluation has
shown high levels of inter- and intra-observer reliability using the
ROSA, and a moderate correlation between total body discomfort
and ROSA final scores. Further research needs to be conducted with
a wider range of ROSA final scores in order to determine if more
precise action levels can be established. Determining the relation-
ship between ROSA scores and other outcome measures such as
injury incidence may also provide new information that will help
establish additional action levels in the tool.
Acknowledgements
Thanks to CRE-MSD for funding, to Hotel-Dieu Grace for their in-
kind support and to Michael Angelidis, Timothy Burkhart, and
Alison Schinkel-Ivy for their assistance with data collection.
References
Amick III, B.C., Robertson, M.M., DeRango, K., Bazzani, L., Moore, A., Rooney, T.,
Harrist, R., 2003. Effect of office ergonomics intervention on reducing muscu-
loskeletal symptoms. Spine 28 (24), 2706e2711.
Bauer, W., Wittig, T., 1998. Influence of screen and copy holder positions on head
posture, muscle activity and user judgment. Appl. Ergon. 29 (3), 185e192.
Bayeh, A.D., Smith, M.J., 1999. Effect of physical ergonomics on VDT worker’s health:
a longitudinal field study in a service organization. Int. J. Hum.-Comput.
Interact. 11, 109e135.
Blatter, B.M., Bongers, P.M., 2002. Duration of computer use and mouse use in
relation to musculoskeletal disorders of the neck or upper limb. Int. J. Ind.
Ergon. 30, 295e306.
Bohr, P.C., 2002. Office ergonomics education: a comparison of traditional and
participatory methods. Work 19, 185e191.
Borg, R., Burr, H., 1997. Danish Employees Working Environment and Health Study
1990e1995. National Institute of Occupational Health. Report.
Burdorf, A., Naaktgeboren, B., de Groot, H.C.W.M., 1993. Occupational risk factors for
low back pain among sedentary workers. Occup. Environ. Med. 35 (12),
1213e1220.
Burgess-Limerick, R., Plooy, A., Ankrum, D.R., 1998. The effect of imposed and self-
selected computer monitor height on posture and gaze angle. Clin. Biomech. 13,
584e592.
Callaghan, J.P., McGill, S.M., 2001. Low back joint loading and kinematics during
standing and unsupported sitting. Ergonomics 44, 280e294.
Canadian Centre for Occupational Health and Safety (CCOHS), 2005. Office Ergo-
nomics. Retrieved 08.03.10 from: http://www.ccohs.ca/oshanswers/
ergonomics/office/.
Chu, K., 1999. An introduction to sensitivity, specificity, predictive values and
likelihood ratios. Emerg. Med. 11, 175e181.
Canadian Standards Association (CSA) International, 2000. CSA-Z412: Guideline on
Office Ergonomics. CSA, Toronto.
Cook, C.J., Kothiyal, K., 1998. Influence of mouse position on muscular activity in the
neck, shoulder and arm in computer users. Appl. Ergon. 29 (6), 439e443.
Dalkiliniç, M., Bumin, G., Kayihan, H., 2002. The effects of ergonomic training and
preventive physiotherapy in musculo-skeletal pain. The Pain Clinic 14 (1),
75e79.
David, G.C., 2005. Ergonomic methods for assessing exposure to risk factors for
work-related musculoskeletal disorders. Occup. Med. 55, 190e199.
Diepenmaat, A.C.M., van der Wal, M.F., de Vet, H.C.W., Hirasing, R.A., 2004. Neck/
shoulder, low back, and arm pain in relation to computer use, physical activity,
stress and depression among Dutch adolescents. Pediatrics 117 (2), 412e416.
Eastman Kodak Company, 1983. Ergonomic Design for People at Work. Van Nos-
trand Reinhold, New York.
Erdinç, O., Hot, K., Özkaya, M., 2008. Cross-cultural Adaptation, Validity and Reli-
ability of Cornell Musculoskeletal Discomfort Questionnaire (CMDQ) in Turkish
Language. Research Report. Istanbul Bagcilar Education and Research Hospital,
Turkey.
Fagarasanu, M., Kumar, S., 2003. Carpal tunnel syndrome due to keyboarding and
mouse tasks: a review. Int. J. Ind. Ergon. 31, 119e136.
Field, A., 2005. Discovering Statistics Using SPSS. Sage Publications Limited, London.
Gerr, F., Marcus, M., Ensor, C., Kleinbaum, D., Cohen, S., Edwards, A., Gentry, E.,
Ortiz, D.J., Monteilh, C., 2002. A prospective study of computer users: I. Study
design and incidence of musculoskeletal symptoms and disorders. Am. J. Ind.
Med. 41, 221e235.
Gerr, F., Monteilh, C.P., Marcus, M., 2006. Keyboard use and musculoskeletal
outcomes among computer users. J. Occup. Rehabil. 16, 256e277.
Hagberg, M., Silverstein, B., Wells, R., Smith, M., Hendrick, H., Carayon, P.,
Perusse, M., 1995. Work Related Musculoskeletal Disorders (WRMSDs):
a Reference Book for Prevention. Taylor and Francis, London.
Hagberg, M., Sundelin, G., 1986. Discomfort and load on the upper trapezius muscle
when operating a word processor. Ergonomics 29, 1637e1645.
Hagberg, M., Wegman, D.H., 1987. Prevalence rates and odds ratios of shoulder-neck
diseases in different occupational groups. Br. J. Ind. Med. 44, 602e610.
Harrison, D.D., Harrison, S.O., Croft, A.C., Harrison, D.E., Troyanovich, S.J., 1999.
Sitting biomechanics part 1: review of the literature. J. Manipulative. Physiol.
Ther. 22 (9), 594e609.
Harisinghani, M.G., Blake, M.A., Saksena, M., Hahn, P.F., Gervais, D., Zalis, M., da
Silva Dias Fernandes, L., Mueller, P.R., 2004. Importance and effects of altered
workplace ergonomics in modern radiology suites. RadioGraphics 24,
615e627.
Hasegawa, T., Kumashiro, M., 1998. Effects of armrests on workload with ten-key
operation. J. Physiol. Anthropol. 17 (4), 123e129.
Health and Safety Executive, 2010. Assessment of Repetitive Tasks of the Upper
Limbs (The ART Tool). Health and Safety Executive, England.
Hedge, A., Morimoto, S., McCrobie, D., 1999. Effects of keyboard tray geometry on
upper body posture and comfort. Ergonomics 42, 1333e1349.
Heinrich, J., Blatter, B.M., Bongers, P.M., 2004. A comparison of methods for the
assessment of postural load and duration of computer use. Occup. Environ.
Med. 61, 1027e1031.
Hertz, R.P., McDonald, M., 2004. Obesity in the United States Workforce. Pfizer Facts,
United States of America.
Hignett, S., McAtamney, L., 2000. Rapid entire body assessment (REBA). Appl. Ergon.
31, 201e205.
Homan, M.M., Armstrong, T.J., 2003. Evaluation of three methodologies for
assessing work activity during computer use. Am. Ind. Hyg. Assoc. J. 64, 48e55.
International Organization for Standardization, 1997. ISO 9241e1: Ergonomic
Requirements for Office Work with Visual Display Terminals (VDTs). ISO, Geneva.
Jaeschke, R., Guyatt, G.H., Sacket, D.L., 1994. User’s guide to the medical literature.
III. How to use an article about a diagnostic test: B. What are the results and will
they help me in caring for patients? J. Am. Med. Assoc. 271, 703e707.
Jensen, C., Finsen, L., Søgaard, K., Christensen, H., 2002. Musculoskeletal symptoms
and duration of computer and mouse use. Int. J. Ind. Ergon. 30, 265e275.
Jorgensen, K., Fallentin, N., Krogh-Lund, C., Jensen, B., 1988. Electromyography and
fatigue during prolonged, low-level static contractions. Eur. J. Appl. Physiol. 57,
316e321.
Karhu, O., Kansi, P., Kuorinka, I., 1977. Correcting working postures in industry:
a practical method for analysis. Appl. Ergon. 8, 199e201.
Keir, P.J., Bach, J.M., Rempel, D., 1999. Effects of computer mouse design and task on
carpal tunnel pressure. Ergonomics 42, 1350e1360.
Keegan, J.J., 1953. Alteration of the lumbar curve related to posture and seating.
J. Bone Joint Surg. 35, 589e603.
Kerr, M.S., Frank, J.W., Shannon, H.S., Norman, W.K., Wells, R.P., Neumann, W.P.,
Bombardier, C., Ontario Universities Back Pain Study Group, 2001. Biomechan-
ical and psychosocial risk factors for low back pain at work. Am. J. Public Health
91 (7), 1069e1075.
Khan, A.A., O’Sullivan, L., Gallwey, T.J., 2009. Effects of combined wrist deviation and
forearm rotation on discomfort score. Ergonomics 52 (3), 345e361.
Korhonen, T., Ketola, R., Toivonen, R., Luukkonen, R., Häkkänen, M., Viikari-
Juntura, E., 2003. Work related and individual predictors for incident neck pain
among office employees working with video display units. Occup. Environ.
Med. 60, 475e482.
Kuorinka, I., Jonsson, B., Kilbom, A., Vinterberg, H., Biering-Sørensen, F.,
Andersson, G., Jørgensen, K., 1987. Standardised Nordic questionnaires for the
analysis of musculoskeletal symptoms. Appl. Ergon. 18 (3), 233e237.
Lueder, R., 1996. A proposed RULA for computer users. In: Proceedings of the
Ergonomics Summer Workshop. UC Berkley Center for Occupational and
Environmental Health Continuing Education Program, San Francisco August
8e9, 1996.
Lueder, R., Allie, P., 1997. Ergonomics Review: Armrest Design and Use. An Ergo-
nomics Review of the Literature for Steelcase Furniture. Retrieved 08.09.09
from: www.humanics-es.com/armrest-ergonomics.htm.
Li, G., Buckle, P., 1999. Evaluating Change in Exposure to Risk for Musculoskeletal
Disorders e a Practical Tool. Health and Safety Executive, Safety Engineering
Laboratory, Sheffield, England.
Lin, Z., Popovic, A., 2003. Working with Computers in Canada: an Empirical Analysis
of Incidence, Frequency and Purpose. Final Report. Human Resources Devel-
opment Canada. Catalog: RH63e1/574-05-03E.
Lowe, G., 1997. Computers in the Workplace. Statistics Canada. Perspectives.
Catalog: 75-001-XPE, 29-36.
Marcus, M., Gerr, F., Monteilh, C., Ortiz, D.J., Gentry, E., Cohen, S., Edwards, A.,
Ensor, C., Kleinbaum, D., 2002. A prospective study for computer users: II.
Postural risk factors for musculoskeletal symptoms and disorders. Am. J. Ind.
Med. 41, 236e249.
Marshall, K., 2001. Working with Computers. Statistics Canada. Perspectives.
Catalog: 75-001, 9e15.
McAtamney, L., Corlett, E.N., 1993. RULA: a survey method for the investigation of
work-related upper limb disorders. Appl. Ergon. 24, 45e57.
McMillan, C.R., 1999. Carpal tunnel syndrome: The rise of an occupational illness.
CSA Discovery Guides, retrieved October, 2009 from http://www.csa.com/
discoveryguides/archives/carpal.php#editor.
Portney, L.G., Watkins, M.P., 2000. Foundation of Clinical Research Applications to
Practice. Prentice Hall, Inc, New Jersey.
Robertson, M., Amick III, B.C., DeRango, K., Rooney, T., Bazzani, L., Harrist, R.,
Moore, A., 2009. The effects of an office ergonomics training and chair inter-
vention on worker knowledge, behaviour and musculoskeletal risk. Appl. Ergon.
40, 124e135.
M. Sonne et al. / Applied Ergonomics 43 (2012) 98e108 107
11. Seghers, J., Jochem, A., Spaepen, A., 2003. Posture, muscle activity and muscle
fatigue in prolonged VDT work at different screen height settings. Ergonomics
46 (7), 714e730.
Serina, E.R., Tal, R., Rempel, D., 1999. Wrist and forearm posture and motions during
typing. Ergonomics 42 (7), 938e951.
Szabo, R.M., Gelberman, R.H., 1987. The pathology of nerve entrapment syndromes.
J. Hand Surg. Am. 12 (5), 880e884.
Tichauer, E.R., Gage, H., 1978. The Biomechanical Basis of Ergonomics. John Wiley
Sons, New York.
Tittiranonda, P., Burastero, S., Rempel, D., 1999. Risk factors for musculoskeletal
disorders among computer users. Occup. Med. (Chic. Ill.) 14, 17e38.
Turville, K.L., Psihogios, J.P., Ulmer, T.R., Mirka, G.A., 1998. The effects of video
display terminal height on the operator: a comparison of the 15 degree and 40
degree recommendations. Appl. Ergon. 29 (4), 239e246.
van Dien, J.H., De Looze, M.P., Hermans, V., 2001. Effects of dynamic office chairs on
trunk kinematics, trunk extensor EMG and spinal shrinkage. Ergonomics 44 (7),
739e750.
Veiersted, K.B., Westgaard, R.H., Andersen, P., 1990. Pattern of muscle activity
during stereotyped work and its relation to muscle pain. Int. Arch. Occup.
Environ. Health 62 (1), 31e41.
Villaneuva, M.B.G., Jonai, H., Saito, S., 1998. Ergonomic aspects of portable personal
computers with flat panel displays (PC-FPDs): evaluation of posture, muscle
activities, discomfort and performance. Ind. Health 36, 282e289.
Village, J., Rempel, D., Teschke, K., 2005. Musculoskeletal disorders of the upper
extremity associated with computer work: a systematic review. Occup. Ergon.
5, 205e218.
Wahlström, J., 2005. Ergonomics, musculoskeletal disorders and computer work.
Occup. Med. (Chic. Ill.) 55, 168e176.
Wiktorin, C., Karlqvist, L., Winkel, J., 1993. Validity of self-reported exposures to
work postures and manual materials handling. Scand. J. Work Environ. Health
19, 208e214.
Wilder, D.G., Pope, M.H., 1996. Epidemiological and aetiological aspects of low
back pain in vibration environments e an update. Clin. Biomech. 11 (2),
61e73.
M. Sonne et al. / Applied Ergonomics 43 (2012) 98e108108