Presented in this short document is a description of how to model and solve advanced parameter estimation (APE) problems in IMPL. APE is the term given to the application of estimating, fitting or calibrating parameters in models involving a network, topology, superstructure or flowsheet. When estimating parameters with multiple linear regression (MLR), ordinary least squares (OLS), ridge regression (RR), principal component regression (PCR) and partial least squares (PLS) there is no explicit model but simply an X-block and Y-block of data. Hence, these methods are referred to as “non-parametric” or “data-based” methods as opposed to the “parametric” or “model-based” method used here. To solve these types of problems we use what is commonly referred to as “error-in-variables” (EIV) regression which is conveniently implemented as nonlinear data reconciliation and regression (NDRR) using the technology found in Kelly (1998a; 1998b; 1999) and Kelly and Zyngier (2008a). The primary benefit of using EIV (NDRR) over the other regression methods is that we can easily handle the inclusion of conservation laws and constitutive relations, explicitly, a must for any industrial estimation problem (IEP).
Presented in this short document is a description of what we call "Advanced" Property Tracking or Tracing (APT). APT is the term given to the technique of predicting, simulating, calculating or estimating the properties (i.e., densities, compositions, conditions, qualities, etc.) in a network or superstructure with significant inventory using statistical data reconciliation and regression (DRR)
Advanced Production Accounting of an Olefins Plant Industrial Modeling Framew...Alkis Vazacopoulos
Presented in this short document is a description of what we call "Advanced" Production Accounting (APA) applied to a small Olefins Plant found in Sanchez and Romagnoli (1996). APA is the term given to the technique of vetting, screening or cleaning the past production data using statistical data reconciliation and regression (DRR) when continuous-processes are assumed to be at steady-state (Kelly and Hedengren, 2013) i.e., there is no significant material accumulation. For this case, the model and data define a simultaneous mass or volume linear DRR problem. Figure 1a shows the Olefins Plant using simple number indices for both the nodes and streams where Figure 1b depicts the same problem configured in our unit-operation-port-state superstructure (UOPSS) (Kelly, 2004, 2005; Zyngier and Kelly, 2012).
Presented in this short document is a description of what is called Advanced Process Monitoring (APM) as described by Hedengren (2013). APM is the term given to the technique of estimating unmeasured but observable variables or "states" using statistical data reconciliation and regression (DRR) in an off-line or real-time environment and is also referred to as Moving Horizon Estimation (MHE) (Robertson et. al., 1996). Essentially, the model and data define a simultaneous nonlinear and dynamic DRR problem where the model is either engineering-based (first-principles, fundamental, mechanistic, causal, rigorous) or empirical-based (correlation, statistical data-based, observational, regressed) or some combination of both (hybrid).
Presented in this short document is a description of what is called the (classic) “Pooling Optimization Problem” and was first described in Haverly (1978) where he modeled a small distillate blending problem with three component materials (A, B, C), one pool for mixing or blending of only two components, two products (P1, P2) and one property (sulfur, S) as well as only one time-period. The GAMS file of this exact same problem is found in Appendix A which describes all of the sets, lists, parameters, variables and constraints required to represent this problem. Related types of NLP sub-models can also be found in Kelly and Zyngier (2015) where they formulate other sub-types of continuous-processes such as blenders, splitters, separators, reactors, fractionators and black-boxes for adhoc or custom sub-models.
Time Series Estimation of Gas Furnace Data in IMPL and CPLEX Industrial Model...Alkis Vazacopoulos
Presented in this short document is a description of how to estimate a deterministic and stochastic time-series transfer function models in IMPL using IBM’s CPLEX applied to industrial gas furnace data. The methodology of time-series analysis involves essentially three (3) stages (Box and Jenkins, 1976): (1) model structure identification, (2) model parameter estimation and (3) model checking and diagnostics. We do not address (1) which requires stationarity and seasonality assessment, auto-, cross- and partial-correlation, etc. to establish the transfer function polynomial degrees. Instead we focus only on the parameter estimation and diagnostics. These types of parameter estimation problems involve dynamic and nonlinear relationships shown below and we solve these using IMPL’s nonlinear programming algorithm SLPQPE which uses CPLEX 12.6 as the QP sub-solver.
Presented in this short document is a description of what we call "Phasing" and "Planuling". Phasing is a variation of the sequence-dependent changeover problem (Kelly and Zyngier, 2007, Balas et. al., 2008) except that the sequencing, cycling or phasing is fixed as opposed to being variable or free. Planuling is a portmanteau of planning and scheduling where we "schedule" slow processes and we "plan" fast processes together inside the same time-horizon and can also be considered as "hybrid" planning and scheduling.
The IML file is our user readable import or input file to the IMPL modeling and solving platform. IMPL is an acronym for Industrial Modeling and Programming Language provided by Industrial Algorithms LLC. The IML file allows the user to configure the necessary data to model and solve large-scale and complex industrial optimization problems (IOP's) such as planning, scheduling, control and data reconciliation and regression in either off or on-line environments.
The data configurable in the IML file are broken-down into several categories or classes where these data categories are used as further sections in this basic reference manual. This reference manual is specific only to the quantity dimension of what we refer to as the Quantity-Logic-Quality Phenomena (QLQP). The QLQP provides a useful phenomenological break-down of the problem complexity where the quantity dimension details quantities such as flows, rates, holdups and yields where the quantities can be related to any stock or signal including time. The other two dimensions are not the focus of this documentation but for completeness of the description, logic data have setups, startups, switchovers-to-itself, shutdowns and switchover-to-others (sequence-dependent transitions) and quality data have densities, components, properties and conditions. In addition to the QLQP , we also have what we call the Unit-Operation-Port-State Superstructure (UOPSS). This provides the flowsheet or topology of the IOP in terms of the various shapes, constructs or objects necessary to configure it. The UOPSS is more than a single network given that it is comprised of two networks we call the "physical" network and the "procedural" network. The physical network involves the units and ports (equipment, structural) and the procedural network involves the operations and states (activities, functional). The combination or cross-product of the two derives the "projectional" superstructure and it is these superstructure constructs or UOPSS keys that we apply, attach or associate specific QLQP attributes where projections are also known as hypothetical, logical or virtual constructs. Ultimately, when we augment the superstructure with the time or temporal dimension as well as including multiple sites or echelons i.e., sub-superstructures, we essentially are configuring what is known as a "hyperstructure".
This paper explores the effectiveness of the recently devel- oped surrogate modeling method, the Adaptive Hybrid Functions (AHF), through its application to complex engineered systems design. The AHF is a hybrid surrogate modeling method that seeks to exploit the advantages of each component surrogate. In this paper, the AHF integrates three component surrogate mod- els: (i) the Radial Basis Functions (RBF), (ii) the Extended Ra- dial Basis Functions (E-RBF), and (iii) the Kriging model, by characterizing and evaluating the local measure of accuracy of each model. The AHF is applied to model complex engineer- ing systems and an economic system, namely: (i) wind farm de- sign; (ii) product family design (for universal electric motors); (iii) three-pane window design; and (iv) onshore wind farm cost estimation. We use three differing sampling techniques to inves- tigate their influence on the quality of the resulting surrogates. These sampling techniques are (i) Latin Hypercube Sampling
∗Doctoral Student, Multidisciplinary Design and Optimization Laboratory, Department of Mechanical, Aerospace and Nuclear Engineering, ASME student member.
†Distinguished Professor and Department Chair. Department of Mechanical and Aerospace Engineering, ASME Lifetime Fellow. Corresponding author.
‡Associate Professor, Department of Mechanical Aerospace and Nuclear En- gineering, ASME member (LHS), (ii) Sobol’s quasirandom sequence, and (iii) Hammers- ley Sequence Sampling (HSS). Cross-validation is used to evalu- ate the accuracy of the resulting surrogate models. As expected, the accuracy of the surrogate model was found to improve with increase in the sample size. We also observed that, the Sobol’s and the LHS sampling techniques performed better in the case of high-dimensional problems, whereas the HSS sampling tech- nique performed better in the case of low-dimensional problems. Overall, the AHF method was observed to provide acceptable- to-high accuracy in representing complex design systems.
Quick Development and Deployment of Industrial Applications using Excel/VBA, ...Alkis Vazacopoulos
Presented in this document is a description of how to develop and deploy industrial applications in a timely fashion using Excel/VBA as the user-interface (UI) and systems-integration (SI) system, IMPL as the industrial modeller and CPLEX as the commercial solver. A small jobshop scheduling example is overviewed to help describe to some extent, the details of this advanced decision-making application where this type of problem can be found in both the manufacturing and process industries.
The purpose of developing and deploying quickly is to acquire feedback from the end-users, to assess the difficulty and tractability of the problem, to ascertain the expected costs and benefits of the application and to address any other issues and requirements regarding the project as a whole as soon as possible. For some projects, proof-of-concepts, prototypes and/or pilots are also useful and these should also be performed ASAP as well using the same approach highlighted here. Ultimately, once a business problem solution has been achieved and full or partial benefits have been captured, then a more robust and sophisticated end-user experience and system architecture can be implemented in the operating system and computer programming environment of choice which will hopefully enhance and maintain the solution over its expected life-cycle.
This slide contains the detailed information of bhageerath H tool for homology modelling (for tertiary structure prediction) designed by SCFBio, IIT Delhi.
Distillation Blending and Cutpoint Temperature Optimization in Scheduling Ope...Brenno Menezes
In oil refinery manufacturing, final products such as fuels, lubricants and petrochemicals are produced from crude-oil in process units considering their operations in coordination with tanks, pipelines, blenders, etc. In this process, the full range of hydrocarbon components (crude-oil) is transformed (separated, reacted, blended) into smaller boiling-point temperature ranges resulting in intermediate and final products, in which planning, scheduling and real-time optimization using distillation curves of the streams can be used to effectively model the unit-operations and predict yields and properties of their outlet streams.1 The hydrocarbon streams’ characterization or assays of both the crude-oil and its derivatives are decomposed, partitioned or characterized into several temperature cuts based on what are known as True Boiling Point (TBP) temperature distribution or distillation curves.2,3 These are one-dimensional representations of how quantity (yields) and quality (properties) data of hydrocarbon streams are distributed or profiled over its TBP temperatures where each cut is also referred to as a component, pseudocomponent or hypothetical in process simulation and optimization technology.4
To improve efficiency, effectiveness and economy of mixing/blending, reacting/converting and separating/fractionating inside the oil-refinery, we proposed a new technique to optimize the blending of several streams’ distillation curves with also shifting or adjusting cutpoint temperatures of distilled streams, i.e, their initial boiling point (IBP) and final boiling point (FBP), in order to manipulate their TBP curves in either off-line or on-line environment. By shifting or adjusting the front-end and back-end of the TBP curve for one or more distillate blending streams, it allows for improved control and optimization of the final product demand quantity and quality, affording better maneuvering closer and around downstream bottlenecks such as tight property specifications and volatile demand flow and timing constrictions. This shifting or adjusting of the TBP curve’s IBP and FBP (front- and back-end respectively) ultimately requires that the unit-operation has sufficient handles or controls to allow this type of cutpoint variation where the solution from this higher-level optimization would provide set points or targets to a lower-level advanced process control systems, which are now commonplace in oil refineries.
By optimizing both the recipes of the blended material and its blending component distillation curves, very significant benefits can be achieved especially given the global push towards ultralow sulfur fuels (ULSF) due to the increase in natural gas plays reducing the demand for other oil distillates. One example is provided to highlight and demonstrate the technique.
Changing consumer choice to ethanol can
1. Reduce dependency on foreign oil
2. Reduce pollution and clean the atmosphere
3. Slow climate change
4. Provide a more renewable fuel source
The use of ethanol blends in conventional gasoline vehicles is restricted to low mixtures up to E10, as ethanol is corrosive and can degrade some of the materials in the engine and fuel system. Also, the engine has to be adjusted for a higher compression ratio as compared to a pure gasoline engine to take advantage of ethanol's higher oxygen content
Blending of ethanol in gasoline for petrol enginesRjRam
This ppt about the blended fuel vehicles. We are going to blend one of the biofuel ethanol which renewable energy source with petrol for using on petrol engine.
Generalized Capital Investment Planning w/ Sequence-Dependent Setups Industri...Alkis Vazacopoulos
Presented in this short document is a description of what we call the “Generalized” Capital Investment Planning (GCIP) problem where conventional capital investment planning (CIP), and specifically for the “retrofit” problem, is discussed in Sahinidis and Grossmann (1989) and Liu and Sahinidis (1996). CIP is the optimization problem where it is desired to expand the capacity and/or extend the capability (conversion) of either the “expansion” of an existing unit or the “installation” of a new unit (Jackson and Grossmann, 2002).
Figure 1 shows the three types of CIP problems as defined in Vazacopoulos et. al. (2014) and Menezes (2014) with its capital cost and time scales.
Phenomenological Decomposition Heuristics for Process Design Synthesis of Oil...Alkis Vazacopoulos
The processing of a raw material is a phenomenon that varies its quantity and quality along a specific network and logics and logistics to transform it into final products. To capture the production framework in a mathematical programming model, a full space formulation integrating discrete design variables and quantity-quality relations gives rise to large scale non-convex mixed-integer nonlinear models, which are often difficult to solve. In order to overcome this problem, we propose a phenomenological decomposition heuristic to solve separately in a first stage the quantity and logic variables in a mixed-integer linear model, and in a second stage the quantity and quality variables in a nonlinear programming formulation. By considering different fuel demand scenarios, the problem becomes a two-stage stochastic programming model, where nonlinear models for each demand scenario are iteratively restricted by the process design results. Two examples demonstrate the tailor-made decomposition scheme to construct the complex oil-refinery process design in a quantitative manner.
Presented in this short document is a description of modeling and solving partial differential equations (PDE’s) in both the temporal and spatial dimensions using IMPL. The sample PDE problem is taken from Cutlip and Shacham (1999 and 2014) and models the process of unsteady-state heat transfer or conduction in a one dimensional (1D) slab with one face insulated and constant thermal conductivity as discussed by Geankoplis (1993).
Finite Impulse Response Estimation of Gas Furnace Data in IMPL Industrial Mod...Alkis Vazacopoulos
Presented in this short document is a description of how to estimate deterministic and stochastic non-parametric finite impulse response (FIR) models in IMPL applied to industrial gas furnace data identical to that found in TSE-GFD-IMF using parametric transfer-functions. The methodology of time-series analysis or system identification involves essentially three (3) stages (Box and Jenkins, 1976): (1) model structure identification, (2) model parameter estimation and (3) model checking and diagnostics. We do not address (1) which requires stationarity and seasonality assessment/adjustment, auto-, cross- and partial-correlation, etc. to establish the parametric transfer function polynomial degrees especially when we are using non-parametric FIR estimation. Instead we focus only on the parameter estimation and diagnostics. These types of parameter estimation problems involve dynamic and nonlinear relationships shown below and we solve these using IMPL’s Sequential Equality-Constrained QP Engine (SECQPE) and Supplemental Observability, Redundancy and Variability Estimator (SORVE). Other types of non-parametric identification known as Subspace Identification (Qin, 2006) and can used to estimate state-space models.
Presented in this short document is a description of what is well-known as Advanced Process Control (APC) applied to a small linear three (3) manipulated variable (MV) by two (2) controlled variable (CV) problem. These problems are also known as Model Predictive Control (MPC) (Grimm et. al., 1989) and Moving Horizon Control (MHC). Figure 1 shows the 3 x 2 APC problem configured in our unit-operation-port-state superstructure (UOPSS) (Kelly, 2004, 2005; Zyngier and Kelly, 2012) as an Advanced Planning and Scheduling (APS) problem as opposed to a traditional APC problem.
Although there is a tremendous amount of stability, performance and robustness theory associated with APC which can be directly assumed to APS problems (Mastragostino et. al., 2014), our approach is to show that APC can equally be set into an APS framework except that APS has far less sensitivity technology due to its inherent discrete and nonlinear modeling complexities i.e., especially non-convexities. In order to eliminate the steady-state offset between the actual value and its target, it is well-known to apply bias-updating though other forms of “parameter-feedback” is possible. Typically, APS applications only employ “variable-feedback” i.e., opening or initial inventories, properties, etc. but this alone will not alleviate the steady-state offset as demonstrated by Kelly and Zyngier (2008).
Server-Solvers-Interacter-Interfacer-Modeler-Presolver Libraries and Executab...Alkis Vazacopoulos
The term SSIIMPLE is used to describe IMPL’s system architecture which stands for Server-Solvers-Interacter-Interfacer-Modeler-Presolver Libraries and Executable. IMPL is an acronym for Industrial Modeling and Programming Language provided by Industrial Algorithms LLC. SSIIMPLE is designed to be portable to both Windows and Linux operating systems on 32 and 64-bit platforms and to have the smallest footprint as possible in order to allow what we call “poor man’s parallelism” (PMP). This essentially means running as many IMPL problem instances as there are CPU’s or threads where each IMPL problem instance would essentially use the same model data but with different solver settings, solvers, initial-values, column orderings, etc. However, it is also possible to modify either or both of static and dynamic model data as well as the solver settings within a given problem instance thread.
Presented in this short document is a description of what is called a “Pipeline Scheduling Optimization Problem” and was first described in Rejowski and Pinto (2003) where they modeled the first-in-first-out (FIFO) and multi-product nature of the segregated pipeline using both discretized space (multi-batches, packs or pipes) and time (multi-intervals, slots or periods). The same MILP model can also be found in Zyngier and Kelly (2009) along with other related production/process objects.
Advanced Process Monitoring for Startups, Shutdowns & Switchovers Industrial ...Alkis Vazacopoulos
Presented in this short document is a description of what is called “Advanced” Process Monitoring as described by Hedengren (2013) but related to Startups, Shutdowns and Switchovers-to-Others (APM-SUSDSO). APM is the term given to the technique of estimating or fitting unmeasured but observable variables or "states" using statistical data reconciliation and regression (DRR) in an off-line or real-time environment. It is also referred to as Moving Horizon Estimation (MHE) (Robertson et. al., 1996) in Advanced Process Control (APC) which goes beyond simply updating a bias to implement some form of measurement or parameter feedback (Kelly and Zyngier, 2008b). Essentially, the model and data define a simultaneous nonlinear and dynamic DRR problem where the model is either engineering-based (first-principles, fundamental, mechanistic, causal, rigorous) or empirical-based (correlation, statistical data-based, observational, regressed) or some combination of both (hybrid) (Pantelides and Renfro, 2012).
Our Industrial Modeling Service (IMS) involves several important (but rarely implemented) methods to significantly improve and advance your existing models and data. Since it is well-known that good decision-making requires good models and data, IMS is ideally suited to support this continuous-improvement endeavour. IMS is specifically designed to either co-exist with your existing design, planning, scheduling, etc. applications or these same models and data can be used seamlessly into our Industrial Modeling and Programming Language (IMPL) to create new value-added applications. The following techniques form the basis of our IMS offering.
Presented in this short document is a description of what we call "Partitioning" and "Positioning". Partitioning is the notion of decomposing the problem into smaller sub-problems along its “hierarchical” (Kelly and Zyngier, 2008), “structural” (Kelly and Mann, 2004), “operational” (Kelly, 2006), “temporal” (Kelly, 2002) and now “phenomenological” (Kelly, 2003, Kelly and Mann, 2003, Kelly and Zyngier, 2014 and Menezes, 2014) dimensions. Positioning is the ability to configure the lower and upper hard bounds and target soft bounds for any time-period over the future time-horizon within the problem or sub-problem and is especially useful to fix variables (i.e., its lower and upper bounds are set equal) which will ultimately remove or exclude these variables from the solver’s model or matrix.
Presented in this short document is a description of our three separate techniques to analyze the data by checking, clustering and componentizing it before it is used by other IMPL’s routines especially in on-line/real-time decision-making applications. We also have other data consistency or analysis techniques which have been described in other IMPL documents and these relate to the application of data reconciliation and regression with diagnostics but require an explicit model (model-based) whereas the techniques below do not i.e., they are data-based techniques.
Presented in this document is a short discussion on using IMPL’s SLPQPE algorithm to solve process optimization problems in either off- or on-line environments also known as real-time optimization (RTO). Process optimization is somewhat different than production optimization in the sense that there are more “constitutive relations” involving only intensive variables. Both types of optimizations involve “conservation laws” and “correlative equations” which usually involve a mix of extensive and intensive variables (Kelly, 2004). Whereas production optimization deals more with material, meta-material (nonlinear), logic and logistics (discrete) balances (Zyngier and Kelly, 2009 and Kelly and Zyngier, 2015), process optimization is inherently more detailed and includes energy, exergy, momentum, hydraulics, equilibrium, diffusion, kinetics and other types of transport phenomena which involve nonlinear and perhaps discontinuous functions (Pantelides and Renfro, 2012).
The IMPL console executable (IMPL.exe) can be called from any DOS command prompt window where its Intel Fortran source code can be found in Appendix A. The IMPL console is useful given that it allows you to model and solve problems configured in an IML (Industrial Modeling Language) file. Problems coded using IPL (Industrial Programming Language) in many computer programming languages can use the IMPL console source code as a prototype.
The IMPL console reads several input files and writes several output files which are described in this document. There are several console flags that can be specified as command line arguments and are described below.
Similar to Advanced Parameter Estimation (APE) for Motor Gasoline Blending (MGB) Industrial Modeling Framework (APE-IMF-MGB) (20)
We tested ODH|CPLEX 4.24 on Miplib Open-v7 Models, a public collection of 286 models to which and optimal solution has not been proven. 257 of these are known to have a feasible solution.
ODH|CPLEX proved optimality on 6 models and found better solutions in 2 hours, to 40% of the models with 12 threads and 35% with 8 threads. ODH|CPLEX matched on 21% of the models.
EX Optimization Studio* solves large-scale optimization problems and enables better business decisions and resulting financial benefits in areas such as supply chain management, operations, healthcare, retail, transportation, logistics and asset management. It has been applied in sectors as diverse as manufacturing, processing, distribution, retailing, transport, finance and investment. CPLEX Optimization Studio is an analytical decision support toolkit for rapid development and deployment of optimization models using mathematical and constraint programming. It combines an integrated development environment (IDE) with the powerful Optimization Programming Language (OPL) and high-performance ILOG CPLEX optimizer solvers. CPLEX Optimization Studio enables clients to: Optimize business decisions with high-performance optimization engines. Develop and deploy optimization models quickly by using flexible interfaces and prebuilt deployment scenarios. Create real-world applications that can significantly improve business outcomes. Optimization Direct has partnered with and entered into a technology licensing and distribution agreement with IBM. By combining the founders' industry and software experience and IBM’s CPLEX Optimization Studio product with the arsenal of Optimization modeling and solving tools from IBM provides customers the most powerful capabilities in the industry.
Missing-Value Handling in Dynamic Model Estimation using IMPL Alkis Vazacopoulos
Presented in this short document is a description of how IMPL handles missing-values or missing-data when estimating dynamic models which inherently involve time-lagged or time-shifted input and output variables. Missing-values in a data set imply that for some reason the data is not available most likely due to a mal-functioning instrument or even lack of proper accounting. Missing-data handling is relatively well-studied especially for time-series or dynamic data given that it is not as easy as removing, ignoring or deleting bad sections of data when static or steady-state models are calibrated (Honaker and King, 2010; Smits and Baggelaar, 2010; Fisher and Waclawski, 2015). Unfortunately, all of their methods involve what is known as “imputation” i.e., replacing or substituting missing-data with some reasonably assumed value which is at the very least is a biased estimate. When regression techniques such as PLS and PCR are used (Nelson et. al., 2006) then missing-data can be handled without imputation by computing the input-output covariance matrices excluding the contribution from the missing-values given the temporal and structural redundancy in the system. However, it is shown in Dayal (1996) that using PLS and other types of regression techniques such as Canonical Correlation Regression (CCR) and Reduced Rank Regression (RRR) to fit non-parsimonious and non-parametric finite impulse/step response models (FIR/FSR), that this is not as reliable as fitting lower-ordered transfer functions especially considering the robust stability of the resulting model predictive controller if that is its intended use.
This short note describes a relatively simple methodology, procedure or approach to increase the performance of already installed industrial models used for optimization, control, simulation and/or monitoring purposes. The method is called Excess or X-Model Regression (XMR) where the concept of “excess modeling” or an X-model is taken from the field of thermodynamics to describe the departure or residual behaviour of real (non-ideal) gases and liquids from their ideal state (Kyle, 1999; Poling et. al., 2001; Smith et. al., 2001). It has also been applied to model the non-ideal or nonlinear behaviour of blending motor gasoline octanes with its synergistic and antagonistic interactional effects (Muller, 1992).
The fundamental idea of XMR is to calibrate, train, fit or estimate, using actual data and multiple linear regression (MLR) or ordinary least squares (OLS), the deviations of the measured responses from the existing model responses. The existing model may be a glass, grey or black-box model (known or unknown, linear or nonlinear, implicit/open or explicit/closed) depending on the use of the model. That is, for optimization and control the model structure and parameters are available given that derivative information is required although for simulation and monitoring, the model may only be observed through the dependent output variables given the necessary independent input variables.
Presented in this short document is a description of how to model and solve multi-utility scheduling optimization (MUSO) problems in IMPL. Multi-utility systems (co/tri-generation) are typically found in petroleum refineries and petrochemical plants (multi-commodity systems) especially when fuel-gas (i.e., off-gases of methane and ethane) is a co- or by-product of the production from which multi-pressure heating-, motive- and process-steam are generated on-site. Other utilities include hydrogen, electricity, water, cooling media, air, nitrogen, chemicals, etc. where a multi-utility system is shown in Figure 1 with an intermediate or integrated utility (both produced and consumed) such as fuel-gas, steam or electricity. Itemized benefit areas just for better management of an integrated steam network can be found in Pelham (2013) where his sample multi-pressure steam utility flowsheet is found in Figure 2.
Sparse Observability using LP Presolve and LTDL Factorization in IMPL (IMPL-S...Alkis Vazacopoulos
Presented in this short document is a description of our technology we call “Sparse Observability”. Observability is the estimatability metric (Bagajewicz, 2010) to structurally determine that an unmeasured variable or regressed parameter is either uniquely solvable (observable) or otherwise unsolvable (unobservable) in data reconciliation and regression (DRR) applications. Ultimately, our purpose to use efficient sparse matrix techniques is to solve large industrial DRR flowsheets quickly and accurately.
Most other implementations of observability calculation use dense linear algebra such as reduced row echelon form (RREF), Gauss-Jordan decomposition (Crowe et. al. 1983; Madron 1992), QR factorization which can now be considered as semi-sparse (Swartz, 1989; Sanchez and Romagnoli, 1996), Schur complements, Cholesky factorization (Kelly, 1998a) and singular value decomposition (SVD) (Kelly, 1999). A sparse LU decomposition with complete-pivoting from Albuquerque and Biegler (1996) for dynamic data reconciliation observability computation was used but it is uncertain if complete-pivoting causes extreme “fill-ins” of the lower and upper triangular matrices essentially making them near-dense. There is another sparse observability method using an LP sub-solver found in Kelly and Zyngier (2008) but this requires solving as many LP sub-problems as there are unmeasured variables which can be considered as somewhat inefficient.
IMPL’s sparse observability technique uses the variable classification and nomenclature found in Kelly (1998b) given that if we partition or separate the unmeasured variables into independent (B12) and dependent (B34) sub-matrices then all dependent unmeasured variables by definition are unobservable. If any independent unmeasured variable is a (linear) function of any dependent variable then this independent variable is of course also unobservable because it is dependent on another non-observable variable.
Generalized capital investment planning of oil-refineries using CPLEX-MILP an...Alkis Vazacopoulos
Performing capital investment planning (CIP) is traditionally done using linear (LP) or nonlinear (NLP) models whereby a gamut of scenarios are generated and manually searched to make expand and/or install decisions. Though mixed-integer nonlinear (MINLP) solvers have made significant advancements, they are often slow for industrial expenditure optimizations. We propose a more tractable approach using mixed-integer linear (MILP) model and input-output (Leontief) models whereby the nonlinearities are approximated to linearized operations, activities, or modes in large-scaled flowsheet problems. To model the different types of CIP's known as revamping, retrofitting, and repairing, we unify the modeling by combining planning balances with the scheduling concepts of sequence-dependent changeovers to represent the construction, commission, and correction stages explicitly. Similar applications can be applied to process design synthesis, asset allocation and utilization, and turnaround and inspection scheduling. Two motivating examples illustrate the modeling, and a retrofit example and an oil-refinery investment planning are highlighted.
Techniques to optimize the pagerank algorithm usually fall in two categories. One is to try reducing the work per iteration, and the other is to try reducing the number of iterations. These goals are often at odds with one another. Skipping computation on vertices which have already converged has the potential to save iteration time. Skipping in-identical vertices, with the same in-links, helps reduce duplicate computations and thus could help reduce iteration time. Road networks often have chains which can be short-circuited before pagerank computation to improve performance. Final ranks of chain nodes can be easily calculated. This could reduce both the iteration time, and the number of iterations. If a graph has no dangling nodes, pagerank of each strongly connected component can be computed in topological order. This could help reduce the iteration time, no. of iterations, and also enable multi-iteration concurrency in pagerank computation. The combination of all of the above methods is the STICD algorithm. [sticd] For dynamic graphs, unchanged components whose ranks are unaffected can be skipped altogether.
Data Centers - Striving Within A Narrow Range - Research Report - MCG - May 2...pchutichetpong
M Capital Group (“MCG”) expects to see demand and the changing evolution of supply, facilitated through institutional investment rotation out of offices and into work from home (“WFH”), while the ever-expanding need for data storage as global internet usage expands, with experts predicting 5.3 billion users by 2023. These market factors will be underpinned by technological changes, such as progressing cloud services and edge sites, allowing the industry to see strong expected annual growth of 13% over the next 4 years.
Whilst competitive headwinds remain, represented through the recent second bankruptcy filing of Sungard, which blames “COVID-19 and other macroeconomic trends including delayed customer spending decisions, insourcing and reductions in IT spending, energy inflation and reduction in demand for certain services”, the industry has seen key adjustments, where MCG believes that engineering cost management and technological innovation will be paramount to success.
MCG reports that the more favorable market conditions expected over the next few years, helped by the winding down of pandemic restrictions and a hybrid working environment will be driving market momentum forward. The continuous injection of capital by alternative investment firms, as well as the growing infrastructural investment from cloud service providers and social media companies, whose revenues are expected to grow over 3.6x larger by value in 2026, will likely help propel center provision and innovation. These factors paint a promising picture for the industry players that offset rising input costs and adapt to new technologies.
According to M Capital Group: “Specifically, the long-term cost-saving opportunities available from the rise of remote managing will likely aid value growth for the industry. Through margin optimization and further availability of capital for reinvestment, strong players will maintain their competitive foothold, while weaker players exit the market to balance supply and demand.”
Advanced Parameter Estimation (APE) for Motor Gasoline Blending (MGB) Industrial Modeling Framework (APE-IMF-MGB)
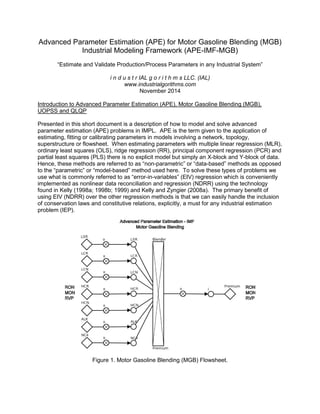
1. Advanced Parameter Estimation (APE) for Motor Gasoline Blending (MGB)
Industrial Modeling Framework (APE-IMF-MGB)
“Estimate and Validate Production/Process Parameters in any Industrial System”
i n d u s t r IAL g o r i t h m s LLC. (IAL)
www.industrialgorithms.com
November 2014
Introduction to Advanced Parameter Estimation (APE), Motor Gasoline Blending (MGB),
UOPSS and QLQP
Presented in this short document is a description of how to model and solve advanced
parameter estimation (APE) problems in IMPL. APE is the term given to the application of
estimating, fitting or calibrating parameters in models involving a network, topology,
superstructure or flowsheet. When estimating parameters with multiple linear regression (MLR),
ordinary least squares (OLS), ridge regression (RR), principal component regression (PCR) and
partial least squares (PLS) there is no explicit model but simply an X-block and Y-block of data.
Hence, these methods are referred to as “non-parametric” or “data-based” methods as opposed
to the “parametric” or “model-based” method used here. To solve these types of problems we
use what is commonly referred to as “error-in-variables” (EIV) regression which is conveniently
implemented as nonlinear data reconciliation and regression (NDRR) using the technology
found in Kelly (1998a; 1998b; 1999) and Kelly and Zyngier (2008a). The primary benefit of
using EIV (NDRR) over the other regression methods is that we can easily handle the inclusion
of conservation laws and constitutive relations, explicitly, a must for any industrial estimation
problem (IEP).
Figure 1. Motor Gasoline Blending (MGB) Flowsheet.
2. In order to demonstrate this, Figure 1 depicts a small but representative motor gasoline blending
(MGB) problem represented in our UOPSS flowsheet paradigm (Kelly, 2004; Kelly 2005;
Zyngier and Kelly, 2012). These types of blending problems are ubiquitous in oil-refining (Kelly
and Mann, 2003; Kelly 2006, Castillo et. al. 2013; Kelly et. al. 2014) where models relating
component recipes or flows (LSR, …, NC4) to component and product (Premium) properties
(RON, MON, RVP, etc.) are required for planning, scheduling, optimizing and controlling these
industrial systems. The UOPSS shapes shown in this figure are diamonds for perimeter unit-operations,
circles with and without “x”’s for outlet and inlet port-states respectively, a rectangle
with an “x” for a continuous-process unit-operation and the lines with arrow-heads for port-to-port
transfers or external streams and lines without arrow-heads for internal streams between
the unit-operation and the port-state.
The overall goal or purpose of this example is to use actual “end-of-blend report” (EBR) data for
thirty-three (33) blends or batches of premium motor gasoline and to estimate, fit or adapt linear
blending-values for each component and for each property i.e., 7 (components) * 3 (properties)
= 21 parameters or coefficients. These blending-values can then be used as the internal model
found in blend property controllers with on-line property measurements, instruments or
analyzers along with bias-updating (parameter-feedback) to effectively control these processes.
The EBR data is very common in blend-shops and reports the amount (volume or weight) of
each component used and the total amount of the product blended and has several measured
properties where RON, MON and RVP are the most common specifications but other properties
such as sulfur, olefins, aromatics content, distillation temperatures, etc. are also specified and
measured (Kelly et. al., 2014). There are essentially three (3) well-known nonlinear blending
models available such as the Ethyl, Dupont (Interaction) and Mobil Transformation methods but
these also require frequent calibration where their intrinsic predictive value over simply adapting
the linear blending-values from actual data is not understood to say the least.
Our novel approach here is to model each of the blends or batches as “scenarios” which are
conceptually identical to scenarios found in Scenario Optimization for example used to
effectively manage uncertainty i.e., to find a robust, reliable and resilient solution to a family of
possible situations. Here a scenario can be thought of as a “sample”, “survey” or “snapshot” of
the process or production at any instant of time in the past where a scenario is usually defined
for future events in planning and scheduling problems. As mentioned, since we have 33
samples or scenarios then technically there are 7 * 3 * 33 = 693 possible blending-values but
instead we common, link or match all of scenario blending-values together for a particular
stream so that we have only 7 * 3 = 21 blending-values (degrees-of-freedom, DoF) to estimate
where the other 672 blending-values are completely dependent (i.e., simple examples of linear
constitutive equations). How we do this in IMPL can be found in Appendix B under the
“Common Data” section. As any new blend is completed and/or when a past blend is deemed
to be too old or out-of-date, the set of scenarios can be modified or updated and the APE
process can be repeated in a rolling, receding or moving horizon estimation procedure (Kelly
and Zyngier, 2008b).
Industrial Modeling Framework (IMF), IMPL and SSIIMPLE
To implement the mathematical formulation of this and other systems, IAL offers a unique
approach and is incorporated into our Industrial Modeling Programming Language we call IMPL.
IMPL has its own modeling language called IML (short for Industrial Modeling Language) which
is a flat or text-file interface as well as a set of API's which can be called from any computer
programming language such as C, C++, Fortran, C#, VBA, Java (SWIG), Python (CTYPES)
and/or Julia (CCALL) called IPL (short for Industrial Programming Language) to both build the
3. model and to view the solution. Models can be a mix of linear, mixed-integer and nonlinear
variables and constraints and are solved using a combination of LP, QP, MILP and NLP solvers
such as COINMP, GLPK, LPSOLVE, SCIP, CPLEX, GUROBI, LINDO, XPRESS, CONOPT,
IPOPT, KNITRO and WORHP as well as our own implementation of SLP called SLPQPE
(Successive Linear & Quadratic Programming Engine) which is a very competitive alternative to
the other nonlinear solvers and embeds all available LP and QP solvers.
In addition and specific to DRR problems, we also have a special solver called SECQPE
standing for Sequential Equality-Constrained QP Engine which computes the least-squares
solution and a post-solver called SORVE standing for Supplemental Observability, Redundancy
and Variability Estimator to estimate the usual DRR statistics. SECQPE also includes a
Levenberg-Marquardt regularization method for nonlinear data regression problems and can be
presolved using SLPQPE i.e., SLPQPE warm-starts SECQPE. SORVE is run after the
SECQPE solver and also computes the well-known "maximum-power" gross-error statistics
(measurement and nodal/constraint tests) to help locate outliers, defects and/or faults i.e., mal-functions
in the measurement system and mis-specifications in the logging system.
The underlying system architecture of IMPL is called SSIIMPLE (we hope literally) which is short
for Server, Solvers, Interfacer (IML), Interacter (IPL), Modeler, Presolver Libraries and
Executable. The Server, Solvers, Presolver and Executable are primarily model or problem-independent
whereas the Interfacer, Interacter and Modeler are typically domain-specific i.e.,
model or problem-dependent. Fortunately, for most industrial planning, scheduling,
optimization, control and monitoring problems found in the process industries, IMPL's standard
Interfacer, Interacter and Modeler are well-suited and comprehensive to model the most difficult
of production and process complexities allowing for the formulations of straightforward
coefficient equations, ubiquitous conservation laws, rigorous constitutive relations, empirical
correlative expressions and other necessary side constraints.
User, custom, adhoc or external constraints can be augmented or appended to IMPL when
necessary in several ways. For MILP or logistics problems we offer user-defined constraints
configurable from the IML file or the IPL code where the variables and constraints are
referenced using unit-operation-port-state names and the quantity-logic variable types. It is also
possible to import a foreign *.ILP file (row-based MPS file) which can be generated by any
algebraic modeling language or matrix generator. This file is read just prior to generating the
matrix and before exporting to the LP, QP or MILP solver. For NLP or quality problems we offer
user-defined formula configuration in the IML file and single-value and multi-value function
blocks writable in C, C++ or Fortran. The nonlinear formulas may include intrinsic functions
such as EXP, LN, LOG, SIN, COS, TAN, MIN, MAX, IF, NOT, EQ, NE, LE, LT, GE, GT, AND,
OR, XOR and CIP, LIP, SIP and KIP (constant, linear and monotonic spline interpolations) as
well as user-written extrinsic functions (XFCN). It is also possible to import another type of
foreign file called the *.INL file where both linear and nonlinear constraints can be added easily
using new or existing IMPL variables.
Industrial modeling frameworks or IMF's are intended to provide a jump-start to an industrial
project implementation i.e., a pre-project if you will, whereby pre-configured IML files and/or IPL
code are available specific to your problem at hand. The IML files and/or IPL code can be
easily enhanced, extended, customized, modified, etc. to meet the diverse needs of your project
and as it evolves over time and use. IMF's also provide graphical user interface prototypes for
drawing the flowsheet as in Figure 1 and typical Gantt charts and trend plots to view the solution
of quantity, logic and quality time-profiles. Current developments use Python 2.3 and 2.7
integrated with open-source Gnome Dia and Matplotlib modules respectively but other
4. prototypes embedded within Microsoft Excel/VBA for example can be created in a
straightforward manner.
However, the primary purpose of the IMF's is to provide a timely, cost-effective, manageable
and maintainable deployment of IMPL to formulate and optimize complex industrial
manufacturing systems in either off-line or on-line environments. Using IMPL alone would be
somewhat similar (but not as bad) to learning the syntax and semantics of an AML as well as
having to code all of the necessary mathematical representations of the problem including the
details of digitizing your data into time-points and periods, demarcating past, present and future
time-horizons, defining sets, index-sets, compound-sets to traverse the network or topology,
calculating independent and dependent parameters to be used as coefficients and bounds and
finally creating all of the necessary variables and constraints to model the complex details of
logistics and quality industrial optimization problems. Instead, IMF's and IMPL provide, in our
opinion, a more elegant and structured approach to industrial modeling and solving so that you
can capture the benefits of advanced decision-making faster, better and cheaper.
Advanced Parameter Estimation (APE) and Motor Gasoline Blending (MGB) Synopsis
At this point we explore further the application of modeling and solving APE problems in IMPL.
The UOPSS shapes or objects arranged in the blend-shop flowsheet of Figure 1 can be found in
Appendix A we call the UPS file. A master IML file is found in Appendix B which configures
several calculations including the hypothetical blending-values (LSR_RON, …, NC4_RVP) from
which we simulate the actual Premium product or grade property values for RON, MON and
RVP where for RVP we simulate the typical (Chevron) blending-index of RVP^1.25. Scenario
1’s IML file (“S1:”) can be found in Appendix C where we use actual component recipes
(LSR=0.0911, …, NC4=0.1202) from an actual blend-shop. The other thirty-two (32) scenario
IML files for “S2:”, …, “S33:” are identical to Appendix C except that the actual component
recipes are different where Appendix B’s Case Data comments shows all of the actual scenario
recipes in table or matrix form. Although Normally distributed random noise could be added to
the simulated product properties in each scenario (see NOISESTD, NOISESEED and NRN)),
no noise was superimposed in order to better compare the regressed blending-values with the
simulated values.
The procedure to estimate the blending-values using the EBR data is to regress each property
individually in order to determine the individual “sum of squares of residuals” (SSR) which also
determines the “standard error” (SE). To do this in IMPL, the RONSE (Appendix B) is set to 1.0
while the MONSE and RVPSE are set to some large number such as 1E+20 and the SECQPE
solver is run which performs NDRR respecting equality constraints only (ignores inequality
constraints). The three SSR’s are 0.5100, 0.4501 and 0.0594 respectively where when we
divide the SSR’s by the nominal DoF of 32 this computes the SE where the inverse or reciprocal
is used as the 2-norm performance weight for the estimation (see Appendix C’s “Cost Data”).
The diagnostics are computed using SORVE which determines the observability of the
blending-values or coefficients (unmeasured or regressed variables), redundancy of the
measurements (measured or reconciled variables) and variances for both. Given the variances
we can compute the Student-t and Chi-Squared distribution statistics required by the data
reconciliation diagnostics known as the maximum-power measurement statistic, parameter
confidence-intervals and the global or objective function statistic. If significant autocorrelation is
detected in the residuals (measured minus predicted) such as detected by the Durbin-Watson
test for example then either a dynamic model needs to be configured using lagged or time-
5. shifted variables (explicit Euler’s method) or only steady-state data should be considered (Kelly
and Hedengren, 2013). Fortunately for this EBR data set, there is no autocorrelation present.
Table 1 shows the simulated versus regressed blending-values with 95% confidence-intervals
(CI’s) in parentheses. All of the blending-value coefficients are within their 95% CI’s except for
HCR which is somewhat related to the fact that there are only sixteen (16) scenarios with non-zero
HCR recipe or flow out of thirty-three (33). Although not shown, the RVP blending-values
are all within their CI’s comfortably.
Table 1. Simulated v. Regressed Blending-Value Parameters (95% Confidence-Intervals).
RON (Simulated) RON (Regressed) MON (Simulated) MON (Regressed)
LSR 74.80 75.95 (73.93,77.97) 71.20 72.27 (70.37,74.17)
LCR 97.40 96.89 (96.16,97.62) 90.90 90.43 (89.75,91.11)
LCN 80.70 79.65 (77.26,82.04) 78.50 77.50 (75.25,79.74)
HCR 103.00 102.04 (101.61,102.47) 93.00 92.12 (91.71,92.52)
HCN 89.60 91.90 (89.07,94.72) 80.50 82.66 (80.00,85.31)
ALK 95.30 95.03 (94.51,95.54) 92.20 91.93 (91.45,92.42)
NC4 96.00 95.01 (93.39,96.64) 90.50 89.56 (88.03,91.09)
An important feature of APE and NDRR is its ability to handle what is commonly referred to as
“missing-data”. Missing-data is the issue where not all of the X-block and Y-block data are
available. With most regression methods (excluding PCR and PLS), missing-data is handled
either by completing removing the observation, sample or scenario or “imputing” a value such
as using its mean. When missing-data is present in APE, we simply make the measured data
into unmeasured data whereby the NDRR will actually estimate or fit a reconciled/regressed
value using the inherent redundancy in the data and in the model. If we assume that the LSR
recipe or flow is missing in scenario “S1:” (see Appendix C’s Command Data), then we simply
set its lower and upper bounds to be some appropriate range. This then becomes a nonlinear
problem due to the flow times property bilinear term and SECQPE estimates its value to be
0.6613 (0.6546, 0.6681) where its measured value is 0.6582 and is clearly within its CI’s. If we
assume that the RON property in “S1:” is missing (see Appendix C’s Command Data), then we
simply set the target bound to our Non-Naturally Occurring Number (NNON=-99,999) which will
ignore this as a measurement. This is still a linear problem where SECQPE finds the RON
unmeasured value to be 92.60 (92.53, 92.68) where its measured value is 92.49.
In summary, it should be clear that IMPL can be used to model and solve advanced parameter
estimation (APE) problems which can also be considered as “Process or Production Analytics”
given that we are using prior engineering knowledge, process/production data and popular
statistics to identify and estimate these models that can then be used in industrial optimization
problems (IOP’s). Not only can we estimate process/production models that include a
flowsheet, nonlinearities, dynamics and missing-data using well-established statistical methods
such as EIV and NDRR but we are also able to provide the necessary diagnostic capability to
validate these models.
References
Kelly, J.D., "On finding the matrix projection in the data reconciliation solution", Computers and
Chemical Engineering, 1553, (1998a).
6. Kelly, J.D., "A regularization approach to the reconciliation of constrained data sets", Computers
and Chemical Engineering, 1771, (1998b).
Kelly, J.D., "Reconciliation of process data using other projection matrices", Computers and
Chemical Engineering, 785, (1999).
Kelly, J.D., Mann, J.M., "Crude-oil blend scheduling optimization: an application with multi-million
dollar benefits", Hydrocarbon Processing, June, 47, July, 72, (2003).
Kelly, J.D., "Production modeling for multimodal operations", Chemical Engineering Progress,
February, 44, (2004).
Kelly, J.D., "The unit-operation-stock superstructure (UOSS) and the quantity-logic-quality
paradigm (QLQP) for production scheduling in the process industries", In: MISTA 2005
Conference Proceedings, 327, (2005).
Kelly, J.D., "Logistics: the missing link in blend scheduling optimization", Hydrocarbon
Processing, June, 45, (2006).
Kelly, J.D., Zyngier, D., "A new and improved MILP formulation to optimize observability,
redundancy and precision for sensor network problems", American Institute of Chemical
Engineering Journal, 54, 1282, (2008a).
Kelly, J.D., Zyngier, D., "Continuously improve planning and scheduling models with parameter
feedback", FOCAPO 2008, July, (2008).
Zyngier, D., Kelly, J.D., "UOPSS: a new paradigm for modeling production planning and
scheduling systems", ESCAPE 22, June, (2012).
Castillo, P.A., Kelly, J.D., Mahalec, V., "Inventory pinch analysis for gasoline blend planning",
AIChE J., June, (2013).
Kelly, J.D., Hedengren, J.D., "A steady-state detection (SDD) algorithm to detect non-stationary
drifts in processes", Journal of Process Control, 23, 326, (2013).
Kelly, J.D., Menezes, B.C., Grossmann, I.E., “Distillation blending and cutpoint temperature
optimization using monotonic interpolation”, Industrial and Engineering Chemistry Research, 53,
15146-15156, (2014).
Appendix A – APE-IMF.UPS File
i M P l (c)
Copyright and Property of i n d u s t r I A L g o r i t h m s LLC.
checksum,73
!!!!!!!!!!!!!!!!!!!!!!!!!!!!!!!!!!!!!!!!!!!!!!!!!!!!!!!!!!!!!!
! Unit-Operation-Port-State-Superstructure (UOPSS) *.UPS File.
! (This file is automatically generated from the Python program IALConstructer.py)
!!!!!!!!!!!!!!!!!!!!!!!!!!!!!!!!!!!!!!!!!!!!!!!!!!!!!!!!!!!!!!
&sUnit,&sOperation,@sType,@sSubtype,@sUse
ALK,,perimeter,,
Blender,Premium,processc,blender%,
HCN,,perimeter,,
HCR,,perimeter,,
LCN,,perimeter,,
LCR,,perimeter,,
LSR,,perimeter,,
NC4,,perimeter,,
7. Premium,,perimeter,,
&sUnit,&sOperation,@sType,@sSubtype,@sUse
! Number of UO shapes = 9
&sAlias,&sUnit,&sOperation
ALLPARTS,ALK,
ALLPARTS,Blender,Premium
ALLPARTS,HCN,
ALLPARTS,HCR,
ALLPARTS,LCN,
ALLPARTS,LCR,
ALLPARTS,LSR,
ALLPARTS,NC4,
ALLPARTS,Premium,
&sAlias,&sUnit,&sOperation
&sUnit,&sOperation,&sPort,&sState,@sType,@sSubtype
ALK,,o,,out,
Blender,Premium,ALK,,in,
Blender,Premium,HCN,,in,
Blender,Premium,HCR,,in,
Blender,Premium,LCN,,in,
Blender,Premium,LCR,,in,
Blender,Premium,LSR,,in,
Blender,Premium,NC4,,in,
Blender,Premium,o,,out,
HCN,,o,,out,
HCR,,o,,out,
LCN,,o,,out,
LCR,,o,,out,
LSR,,o,,out,
NC4,,o,,out,
Premium,,i,,in,
&sUnit,&sOperation,&sPort,&sState,@sType,@sSubtype
! Number of UOPS shapes = 16
&sAlias,&sUnit,&sOperation,&sPort,&sState
ALLINPORTS,Blender,Premium,ALK,
ALLINPORTS,Blender,Premium,HCN,
ALLINPORTS,Blender,Premium,HCR,
ALLINPORTS,Blender,Premium,LCN,
ALLINPORTS,Blender,Premium,LCR,
ALLINPORTS,Blender,Premium,LSR,
ALLINPORTS,Blender,Premium,NC4,
ALLINPORTS,Premium,,i,
ALLOUTPORTS,ALK,,o,
ALLOUTPORTS,Blender,Premium,o,
ALLOUTPORTS,HCN,,o,
ALLOUTPORTS,HCR,,o,
ALLOUTPORTS,LCN,,o,
ALLOUTPORTS,LCR,,o,
ALLOUTPORTS,LSR,,o,
ALLOUTPORTS,NC4,,o,
&sAlias,&sUnit,&sOperation,&sPort,&sState
&sUnit,&sOperation,&sPort,&sState,&sUnit,&sOperation,&sPort,&sState
ALK,,o,,Blender,Premium,ALK,
Blender,Premium,o,,Premium,,i,
HCN,,o,,Blender,Premium,HCN,
HCR,,o,,Blender,Premium,HCR,
LCN,,o,,Blender,Premium,LCN,
LCR,,o,,Blender,Premium,LCR,
LSR,,o,,Blender,Premium,LSR,
NC4,,o,,Blender,Premium,NC4,
&sUnit,&sOperation,&sPort,&sState,&sUnit,&sOperation,&sPort,&sState
! Number of UOPSPSUO shapes = 8
&sAlias,&sUnit,&sOperation,&sPort,&sState,&sUnit,&sOperation,&sPort,&sState
ALLPATHS,ALK,,o,,Blender,Premium,ALK,
ALLPATHS,HCN,,o,,Blender,Premium,HCN,
ALLPATHS,HCR,,o,,Blender,Premium,HCR,
ALLPATHS,LCN,,o,,Blender,Premium,LCN,
ALLPATHS,LCR,,o,,Blender,Premium,LCR,
ALLPATHS,LSR,,o,,Blender,Premium,LSR,
ALLPATHS,NC4,,o,,Blender,Premium,NC4,
ALLPATHS,Blender,Premium,o,,Premium,,i,
&sAlias,&sUnit,&sOperation,&sPort,&sState,&sUnit,&sOperation,&sPort,&sState
Appendix B – APE-IMF.IML File
i M P l (c)
Copyright and Property of i n d u s t r I A L g o r i t h m s LLC.
!!!!!!!!!!!!!!!!!!!!!!!!!!!!!!!!!!!!!!!!!!!!!!!!!!!!!!!!!!!!!!!!!!!!!!!!!!!!!!!!
! Calculation Data (Parameters)
!!!!!!!!!!!!!!!!!!!!!!!!!!!!!!!!!!!!!!!!!!!!!!!!!!!!!!!!!!!!!!!!!!!!!!!!!!!!!!!!
&sCalc,@sValue
PERIOD,1.0
START,-PERIOD
10. Include-@sFile_Name
APE-IMF-S25.iml
Include-@sFile_Name
Include-@sFile_Name
APE-IMF-S26.iml
Include-@sFile_Name
Include-@sFile_Name
APE-IMF-S27.iml
Include-@sFile_Name
Include-@sFile_Name
APE-IMF-S28.iml
Include-@sFile_Name
Include-@sFile_Name
APE-IMF-S29.iml
Include-@sFile_Name
Include-@sFile_Name
APE-IMF-S30.iml
Include-@sFile_Name
Include-@sFile_Name
APE-IMF-S31.iml
Include-@sFile_Name
Include-@sFile_Name
APE-IMF-S32.iml
Include-@sFile_Name
Include-@sFile_Name
APE-IMF-S33.iml
Include-@sFile_Name
!!!!!!!!!!!!!!!!!!!!!!!!!!!!!!!!!!!!!!!!!!!!!!!!!!!!!!!!!!!!!!!!!!!!!!!!!!!!!!!!
! Common Data (Parities)
!!!!!!!!!!!!!!!!!!!!!!!!!!!!!!!!!!!!!!!!!!!!!!!!!!!!!!!!!!!!!!!!!!!!!!!!!!!!!!!!
&sUnit,&sOperation,&sPort,&sState,&sQuality,@sType,&sUnit,&sOperation,&sPort,&sState,&sQuality,@sType
LSR,,o,,RON,PP,
LCR,,o,,RON,PP,
LCN,,o,,RON,PP,
HCR,,o,,RON,PP,
HCN,,o,,RON,PP,
ALK,,o,,RON,PP,
NC4,,o,,RON,PP,
LSR,,o,,MON,PP,
LCR,,o,,MON,PP,
LCN,,o,,MON,PP,
HCR,,o,,MON,PP,
HCN,,o,,MON,PP,
ALK,,o,,MON,PP,
NC4,,o,,MON,PP,
LSR,,o,,RVP,PP,
LCR,,o,,RVP,PP,
LCN,,o,,RVP,PP,
HCR,,o,,RVP,PP,
HCN,,o,,RVP,PP,
ALK,,o,,RVP,PP,
NC4,,o,,RVP,PP,
&sUnit,&sOperation,&sPort,&sState,&sQuality,@sType,&sUnit,&sOperation,&sPort,&sState,&sQuality,@sType
Appendix C – APE-IMF-S1.IML File
i M P l (c)
Copyright and Property of i n d u s t r I A L g o r i t h m s LLC.
!!!!!!!!!!!!!!!!!!!!!!!!!!!!!!!!!!!!!!!!!!!!!!!!!!!!!!!!!!!!!!!!!!!!!!!!!!!!!!!!
! Case Data (Prefixes)
!!!!!!!!!!!!!!!!!!!!!!!!!!!!!!!!!!!!!!!!!!!!!!!!!!!!!!!!!!!!!!!!!!!!!!!!!!!!!!!!
&sScenario
S1:
&sScenario
!!!!!!!!!!!!!!!!!!!!!!!!!!!!!!!!!!!!!!!!!!!!!!!!!!!!!!!!!!!!!!!!!!!!!!!!!!!!!!!!
! Calculation Data (Parameters)
!!!!!!!!!!!!!!!!!!!!!!!!!!!!!!!!!!!!!!!!!!!!!!!!!!!!!!!!!!!!!!!!!!!!!!!!!!!!!!!!
&sCalc,@sValue
PERIOD,1.0
START,-PERIOD
BEGIN,0.0
END,1.0
! Measured/fixed component recipes.
LSR,0.0911
LCR,0.6582