This document discusses optimizing fantasy football teams to maximize points scored over a 17-week season. It develops a nonlinear programming model using an evolutionary solver with 200 binary variables representing each player. The model aims to select players with the highest historical scoring averages who provide consistent weekly points and availability. Future improvements will add constraints to reduce total variance across positions and simulate different draft outcomes based on pick order, as well as calculating optimal bench players for bye-weeks.
Mastering Football Prediction Tips and Strategies for Accurate Results.pdfMULA BETTING
Elevate your football betting game with our comprehensive guide on Mastering Football Prediction Tips and Strategies for Accurate Results! Whether you're a seasoned punter or just starting, our expert insights will empower you to make informed predictions and boost your success rate.
Dive deep into the world of predictive analytics and discover winning strategies that go beyond luck. From game analysis to key statistics, we've got you covered with the essential tools to make precise football predictions.
Uncover the secrets of successful betting with insider tips and expert advice. Learn how to develop your game plan, analyze teams effectively, and stay ahead of the curve in the dynamic world of football predictions.
Whether you're passionate about the sport or looking to enhance your betting skills, this video is your go-to resource for mastering the art of football predictions. Subscribe now and kick-start your journey to consistent betting success! Don't just watch the game, predict it with confidence! #FootballPredictions #WinningStrategies #BettingTips #MasteringFootball #AccuratePredictions #SportsAnalytics
Data analytics mostly involves studying data trends over a given period, and then extracting useful information from these trends.
Why Is Data Analytics Important?
More precise decision making process: Data analytics helps organizations make more accurate decisions based on the insights gotten from data trends over time.
For example, a company selling different products can figure out what time of the year different products sell higher. This will enable them boost production of such products at the required time.
A better decision making process will eliminate the need for guess work, and minimize losses and avoidable risks.
Improved customer satisfaction: When you're able to serve customers, you retain them and keep business going. Insights gotten from data analytics can help you understand exactly what your customers want and when to act.
Data analytics also enables businesses to identify their target audience easily.
Improved business strategy: Data analytics helps organizations channel their resources towards the most efficient strategies.
Performance evaluation: Data analytics can help organizations evaluate how well or badly they've performed over a specified period. This will enable them make important decisions for the future of the organization.
Although the points listed above seem to be from the business point of view, that's not the only industry where data analytics is important.
You can see data analytics being used in healthcare, education, agriculture, and so on.
Types of Data Analytics
There are mainly four different types of data analytics:
Descriptive analytics: This type of analytics has to do with what happened with analyzed data over a specified period of time.
Diagnostic analytics: Diagnostic data analytics shows the "why" in a data trend. This involves having a deeper look into why certain patterns were present in the data.
Predictive analytics: The goal here is to foretell what is expected to happen in the future based on the outcomes of analyzed data over time.
Prescriptive analytics: In prescriptive analytics, the results from data analysis is used to make recommendations on what to do next.
What Is the Difference Between Data Analysis and Data Analytics?
You'll come across different definitions of data analytics and data analysis.
Some sources would define data analytics and data analysis as the same. Others would use them interchangeably.
Although, they are closely related, these terms have slightly different meanings. They are similar because they aid in the decision making process.
What Is Data Analysis?
Data analysis is the process of studying what has happened in the past in a dataset. There is no need to extend this definition.
Data analysis studies the why and how of data trends. Yes, it involves data collection, organization, and "analysis".
"How did the users respond to a new feature?".
"Why did the rate of purchase of a product fall during a particular period?".
Data analysts can make use o
The best investment app in India is here. Nobias Finance is a platform that processes thousands of articles daily, employing machine learning to categorise them into different rating levels. Whether you're a new investor or a pioneer in investment, leveraging this platform can provide valuable insights. Users can follow analysts/bloggers on Nobias to understand how a stock will likely perform based on their ratings.
MVR is a sports technology company that uses artificial intelligence to test athletic vision, drive, and awareness. These short cognitive assessments have been able to predict success across sports. Research shows that speed, agility, balance, and coordination are all related to cognitive processing demands accurately measured by MVR’s intelligent, cloud-based system that successfully predict in-game performance statistics across amateur and professional ranks in various sports.
Integer Optimisation for Dream 11 Cricket Team Selectionsaurav singla
A retrospective approach to team selection using the real-world data collected from Player performances in the last 10 matches, to propose a Dream 11 Fantasy team for the upcoming cricket match.
Systems Thinking with the Ball Point Game - A&B 2019Jeff Kosciejew
Using the Ball Point Game, this workshop looks at some of the foundational concepts and ideas of Systems Thinking. It's an introduction to this topic, and only an introduction. This is from the talk I delivered at Agile & Beyond 2019.
To those who may not be aware, fantasy football is a game played predominantly by football fans that have a passion for the game. Each of the player draft his/her own team and compete against teams built by others.
We tested ODH|CPLEX 4.24 on Miplib Open-v7 Models, a public collection of 286 models to which and optimal solution has not been proven. 257 of these are known to have a feasible solution.
ODH|CPLEX proved optimality on 6 models and found better solutions in 2 hours, to 40% of the models with 12 threads and 35% with 8 threads. ODH|CPLEX matched on 21% of the models.
EX Optimization Studio* solves large-scale optimization problems and enables better business decisions and resulting financial benefits in areas such as supply chain management, operations, healthcare, retail, transportation, logistics and asset management. It has been applied in sectors as diverse as manufacturing, processing, distribution, retailing, transport, finance and investment. CPLEX Optimization Studio is an analytical decision support toolkit for rapid development and deployment of optimization models using mathematical and constraint programming. It combines an integrated development environment (IDE) with the powerful Optimization Programming Language (OPL) and high-performance ILOG CPLEX optimizer solvers. CPLEX Optimization Studio enables clients to: Optimize business decisions with high-performance optimization engines. Develop and deploy optimization models quickly by using flexible interfaces and prebuilt deployment scenarios. Create real-world applications that can significantly improve business outcomes. Optimization Direct has partnered with and entered into a technology licensing and distribution agreement with IBM. By combining the founders' industry and software experience and IBM’s CPLEX Optimization Studio product with the arsenal of Optimization modeling and solving tools from IBM provides customers the most powerful capabilities in the industry.
Missing-Value Handling in Dynamic Model Estimation using IMPL Alkis Vazacopoulos
Presented in this short document is a description of how IMPL handles missing-values or missing-data when estimating dynamic models which inherently involve time-lagged or time-shifted input and output variables. Missing-values in a data set imply that for some reason the data is not available most likely due to a mal-functioning instrument or even lack of proper accounting. Missing-data handling is relatively well-studied especially for time-series or dynamic data given that it is not as easy as removing, ignoring or deleting bad sections of data when static or steady-state models are calibrated (Honaker and King, 2010; Smits and Baggelaar, 2010; Fisher and Waclawski, 2015). Unfortunately, all of their methods involve what is known as “imputation” i.e., replacing or substituting missing-data with some reasonably assumed value which is at the very least is a biased estimate. When regression techniques such as PLS and PCR are used (Nelson et. al., 2006) then missing-data can be handled without imputation by computing the input-output covariance matrices excluding the contribution from the missing-values given the temporal and structural redundancy in the system. However, it is shown in Dayal (1996) that using PLS and other types of regression techniques such as Canonical Correlation Regression (CCR) and Reduced Rank Regression (RRR) to fit non-parsimonious and non-parametric finite impulse/step response models (FIR/FSR), that this is not as reliable as fitting lower-ordered transfer functions especially considering the robust stability of the resulting model predictive controller if that is its intended use.
Finite Impulse Response Estimation of Gas Furnace Data in IMPL Industrial Mod...Alkis Vazacopoulos
Presented in this short document is a description of how to estimate deterministic and stochastic non-parametric finite impulse response (FIR) models in IMPL applied to industrial gas furnace data identical to that found in TSE-GFD-IMF using parametric transfer-functions. The methodology of time-series analysis or system identification involves essentially three (3) stages (Box and Jenkins, 1976): (1) model structure identification, (2) model parameter estimation and (3) model checking and diagnostics. We do not address (1) which requires stationarity and seasonality assessment/adjustment, auto-, cross- and partial-correlation, etc. to establish the parametric transfer function polynomial degrees especially when we are using non-parametric FIR estimation. Instead we focus only on the parameter estimation and diagnostics. These types of parameter estimation problems involve dynamic and nonlinear relationships shown below and we solve these using IMPL’s Sequential Equality-Constrained QP Engine (SECQPE) and Supplemental Observability, Redundancy and Variability Estimator (SORVE). Other types of non-parametric identification known as Subspace Identification (Qin, 2006) and can used to estimate state-space models.
Our Industrial Modeling Service (IMS) involves several important (but rarely implemented) methods to significantly improve and advance your existing models and data. Since it is well-known that good decision-making requires good models and data, IMS is ideally suited to support this continuous-improvement endeavour. IMS is specifically designed to either co-exist with your existing design, planning, scheduling, etc. applications or these same models and data can be used seamlessly into our Industrial Modeling and Programming Language (IMPL) to create new value-added applications. The following techniques form the basis of our IMS offering.
This short note describes a relatively simple methodology, procedure or approach to increase the performance of already installed industrial models used for optimization, control, simulation and/or monitoring purposes. The method is called Excess or X-Model Regression (XMR) where the concept of “excess modeling” or an X-model is taken from the field of thermodynamics to describe the departure or residual behaviour of real (non-ideal) gases and liquids from their ideal state (Kyle, 1999; Poling et. al., 2001; Smith et. al., 2001). It has also been applied to model the non-ideal or nonlinear behaviour of blending motor gasoline octanes with its synergistic and antagonistic interactional effects (Muller, 1992).
The fundamental idea of XMR is to calibrate, train, fit or estimate, using actual data and multiple linear regression (MLR) or ordinary least squares (OLS), the deviations of the measured responses from the existing model responses. The existing model may be a glass, grey or black-box model (known or unknown, linear or nonlinear, implicit/open or explicit/closed) depending on the use of the model. That is, for optimization and control the model structure and parameters are available given that derivative information is required although for simulation and monitoring, the model may only be observed through the dependent output variables given the necessary independent input variables.
Presented in this short document is a description of how to model and solve multi-utility scheduling optimization (MUSO) problems in IMPL. Multi-utility systems (co/tri-generation) are typically found in petroleum refineries and petrochemical plants (multi-commodity systems) especially when fuel-gas (i.e., off-gases of methane and ethane) is a co- or by-product of the production from which multi-pressure heating-, motive- and process-steam are generated on-site. Other utilities include hydrogen, electricity, water, cooling media, air, nitrogen, chemicals, etc. where a multi-utility system is shown in Figure 1 with an intermediate or integrated utility (both produced and consumed) such as fuel-gas, steam or electricity. Itemized benefit areas just for better management of an integrated steam network can be found in Pelham (2013) where his sample multi-pressure steam utility flowsheet is found in Figure 2.
Advanced Parameter Estimation (APE) for Motor Gasoline Blending (MGB) Indust...Alkis Vazacopoulos
Presented in this short document is a description of how to model and solve advanced parameter estimation (APE) problems in IMPL. APE is the term given to the application of estimating, fitting or calibrating parameters in models involving a network, topology, superstructure or flowsheet. When estimating parameters with multiple linear regression (MLR), ordinary least squares (OLS), ridge regression (RR), principal component regression (PCR) and partial least squares (PLS) there is no explicit model but simply an X-block and Y-block of data. Hence, these methods are referred to as “non-parametric” or “data-based” methods as opposed to the “parametric” or “model-based” method used here. To solve these types of problems we use what is commonly referred to as “error-in-variables” (EIV) regression which is conveniently implemented as nonlinear data reconciliation and regression (NDRR) using the technology found in Kelly (1998a; 1998b; 1999) and Kelly and Zyngier (2008a). The primary benefit of using EIV (NDRR) over the other regression methods is that we can easily handle the inclusion of conservation laws and constitutive relations, explicitly, a must for any industrial estimation problem (IEP).
Techniques to optimize the pagerank algorithm usually fall in two categories. One is to try reducing the work per iteration, and the other is to try reducing the number of iterations. These goals are often at odds with one another. Skipping computation on vertices which have already converged has the potential to save iteration time. Skipping in-identical vertices, with the same in-links, helps reduce duplicate computations and thus could help reduce iteration time. Road networks often have chains which can be short-circuited before pagerank computation to improve performance. Final ranks of chain nodes can be easily calculated. This could reduce both the iteration time, and the number of iterations. If a graph has no dangling nodes, pagerank of each strongly connected component can be computed in topological order. This could help reduce the iteration time, no. of iterations, and also enable multi-iteration concurrency in pagerank computation. The combination of all of the above methods is the STICD algorithm. [sticd] For dynamic graphs, unchanged components whose ranks are unaffected can be skipped altogether.
Levelwise PageRank with Loop-Based Dead End Handling Strategy : SHORT REPORT ...Subhajit Sahu
Abstract — Levelwise PageRank is an alternative method of PageRank computation which decomposes the input graph into a directed acyclic block-graph of strongly connected components, and processes them in topological order, one level at a time. This enables calculation for ranks in a distributed fashion without per-iteration communication, unlike the standard method where all vertices are processed in each iteration. It however comes with a precondition of the absence of dead ends in the input graph. Here, the native non-distributed performance of Levelwise PageRank was compared against Monolithic PageRank on a CPU as well as a GPU. To ensure a fair comparison, Monolithic PageRank was also performed on a graph where vertices were split by components. Results indicate that Levelwise PageRank is about as fast as Monolithic PageRank on the CPU, but quite a bit slower on the GPU. Slowdown on the GPU is likely caused by a large submission of small workloads, and expected to be non-issue when the computation is performed on massive graphs.
Show drafts
volume_up
Empowering the Data Analytics Ecosystem: A Laser Focus on Value
The data analytics ecosystem thrives when every component functions at its peak, unlocking the true potential of data. Here's a laser focus on key areas for an empowered ecosystem:
1. Democratize Access, Not Data:
Granular Access Controls: Provide users with self-service tools tailored to their specific needs, preventing data overload and misuse.
Data Catalogs: Implement robust data catalogs for easy discovery and understanding of available data sources.
2. Foster Collaboration with Clear Roles:
Data Mesh Architecture: Break down data silos by creating a distributed data ownership model with clear ownership and responsibilities.
Collaborative Workspaces: Utilize interactive platforms where data scientists, analysts, and domain experts can work seamlessly together.
3. Leverage Advanced Analytics Strategically:
AI-powered Automation: Automate repetitive tasks like data cleaning and feature engineering, freeing up data talent for higher-level analysis.
Right-Tool Selection: Strategically choose the most effective advanced analytics techniques (e.g., AI, ML) based on specific business problems.
4. Prioritize Data Quality with Automation:
Automated Data Validation: Implement automated data quality checks to identify and rectify errors at the source, minimizing downstream issues.
Data Lineage Tracking: Track the flow of data throughout the ecosystem, ensuring transparency and facilitating root cause analysis for errors.
5. Cultivate a Data-Driven Mindset:
Metrics-Driven Performance Management: Align KPIs and performance metrics with data-driven insights to ensure actionable decision making.
Data Storytelling Workshops: Equip stakeholders with the skills to translate complex data findings into compelling narratives that drive action.
Benefits of a Precise Ecosystem:
Sharpened Focus: Precise access and clear roles ensure everyone works with the most relevant data, maximizing efficiency.
Actionable Insights: Strategic analytics and automated quality checks lead to more reliable and actionable data insights.
Continuous Improvement: Data-driven performance management fosters a culture of learning and continuous improvement.
Sustainable Growth: Empowered by data, organizations can make informed decisions to drive sustainable growth and innovation.
By focusing on these precise actions, organizations can create an empowered data analytics ecosystem that delivers real value by driving data-driven decisions and maximizing the return on their data investment.
Best best suvichar in gujarati english meaning of this sentence as Silk road ...
Bia project poster fantasy football
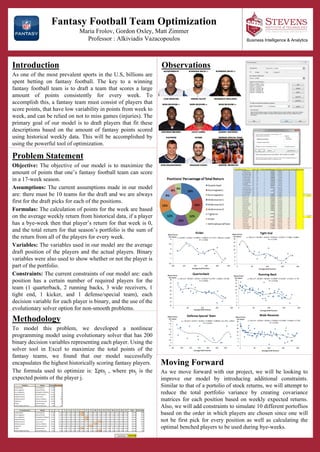
1. Fantasy Football Team Optimization
Maria Frolov, Gordon Oxley, Matt Zimmer
Professor : Alkiviadis Vazacopoulos
ObservationsIntroduction
As one of the most prevalent sports in the U.S, billions are
spent betting on fantasy football. The key to a winning
fantasy football team is to draft a team that scores a large
amount of points consistently for every week. To
accomplish this, a fantasy team must consist of players that
score points, that have low variability in points from week to
week, and can be relied on not to miss games (injuries). The
primary goal of our model is to draft players that fit these
descriptions based on the amount of fantasy points scored
using historical weekly data. This will be accomplished by
using the powerful tool of optimization.
Methodology
To model this problem, we developed a nonlinear
programming model using evolutionary solver that has 200
binary decision variables representing each player. Using the
solver tool in Excel to maximize the total points of the
fantasy teams, we found that our model successfully
encapsulates the highest historically scoring fantasy players.
The formula used to optimize is: Σptsj , where ptsj is the
expected points of the player j.
Business Intelligence & Analytics
Problem Statement
Objective: The objective of our model is to maximize the
amount of points that one’s fantasy football team can score
in a 17-week season.
Assumptions: The current assumptions made in our model
are: there must be 10 teams for the draft and we are always
first for the draft picks for each of the positions.
Formulas: The calculation of points for the week are based
on the average weekly return from historical data, if a player
has a bye-week then that player’s return for that week is 0,
and the total return for that season’s portfolio is the sum of
the return from all of the players for every week.
Variables: The variables used in our model are the average
draft position of the players and the actual players. Binary
variables were also used to show whether or not the player is
part of the portfolio.
Constraints: The current constraints of our model are: each
position has a certain number of required players for the
team (1 quarterback, 2 running backs, 3 wide receivers, 1
tight end, 1 kicker, and 1 defense/special team), each
decision variable for each player is binary, and the use of the
evolutionary solver option for non-smooth problems.
Moving Forward
As we move forward with our project, we will be looking to
improve our model by introducing additional constraints.
Similar to that of a portolio of stock returns, we will attempt to
reduce the total portfolio variance by creating covariance
matrices for each position based on weekly expected returns.
Also, we will add constraints to simulate 10 different portoflios
based on the order in which players are chosen since one will
not be first pick for every position as well as calculating the
optimal benched players to be used during bye-weeks.