Research Methods
How doyou do research in psychology?
Psychology uses the scientific process:
Question
Hypothesis
Data
Interpretation
3.
Research Methods
Hindsight biasis the tendency of people to overestimate their
ability to have predicted an outcome that could not possibly
have been predicted.
However, the goal of science is to be predictive; that is,
determine an outcome before it happens, not after.
4.
Research Methods
Ways ofdoing research in psychology (research design):
There are different ways of doing research:
Experimental design (experiment)
- Laboratory experiment (usually just “experiment”)
- Quasi-experiments (like an experiment*)
- Field experiments (like an experiment*)
Naturalistic observation
Correlational design (correlation)
Survey
Case Study
5.
Research Methods
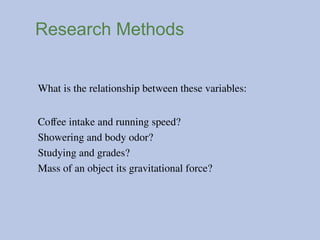
What isthe relationship between these variables:
Coffee intake and running speed?
Showering and body odor?
Studying and grades?
Mass of an object its gravitational force?
6.
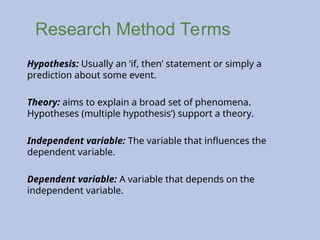
Research Method Terms
Hypothesis:Usually an ‘if, then’ statement or simply a
prediction about some event.
Theory: aims to explain a broad set of phenomena.
Hypotheses (multiple hypothesis’) support a theory.
Independent variable: The variable that influences the
dependent variable.
Dependent variable: A variable that depends on the
independent variable.
Operational Definitions
Hypothesis: Ifpeople are given money, they experience greater
happiness than if given candy.
How do we measure happiness?
Operational Definitions (IMPORTANT)
Definitions of variables in research need to be quantifiable
(countable) and observable. They need to be operationally
defined.
Example, happiness: how many times someone smiles.
9.
Validity & Reliability
Researchaims to be valid and reliable
Validity refers to whether the research measures
what the researchers set out to measure.
Reliability refers to whether the same results can
be produced under similar conditions.
10.
Validity & ReliabilityExample
If you have a scale, and it says you weigh 100lbs., but on
every other scale you step on, the scale says 180lbs., the scale
would not be a ‘valid’ measure of your weight.
On the other hand, if you stepped on the scale and it said
100lbs., and then five minutes later stepped on the same scale
again, and it said 130lbs., the scale would not be a ‘reliable’
measure of your weight.
11.
Research Method Terms
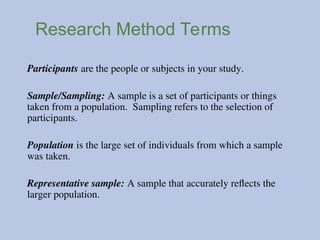
Participantsare the people or subjects in your study.
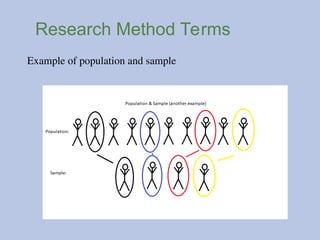
Sample/Sampling: A sample is a set of participants or things
taken from a population. Sampling refers to the selection of
participants.
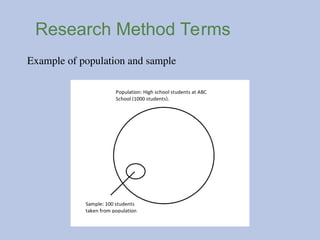
Population is the large set of individuals from which a sample
was taken.
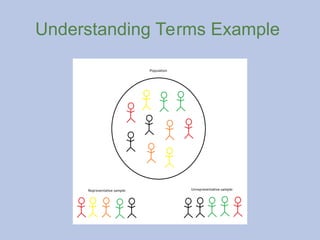
Representative sample: A sample that accurately reflects the
larger population.
Understanding Terms Example
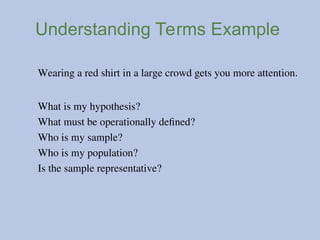
Wearinga red shirt in a large crowd gets you more attention.
What is my hypothesis?
What must be operationally defined?
Who is my sample?
Who is my population?
Is the sample representative?
15.
Understanding Terms Example
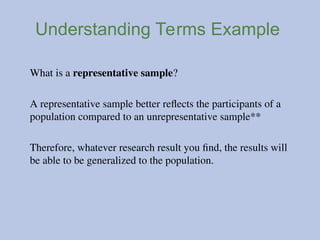
Whatis a representative sample?
A representative sample better reflects the participants of a
population compared to an unrepresentative sample**
Therefore, whatever research result you find, the results will
be able to be generalized to the population.
Random Selection
Random selectionmeans that every member of the
population has an equal chance of being selected.
How could we randomly select in the previous
example?
More on RandomSelection
Stratified sampling: A process that allows a researcher to
ensure the sample represents the population on some criteria.
If I want to research whether different racial groups respond
differently to a survey, I could select 10 Caucasians, 10
Asians, 10 African Americans….
Stratified sampling takes place at the selection level. If you
want your sample to meet some criterion or criteria, then that
is stratified sampling*
20.
Experimental Method
Psychologists preferexperiments because they can establish a cause-
effect relationship.
Laboratory experiments are conducted in a controlled environment and
use random assignment.
Field experiments are conducted in the ‘real’ world. Researchers go out
and manipulate some variable and observe the effect. Example here.
Quasi-experiments are experiments, but do not use random assignment.
21.
Experimental Research
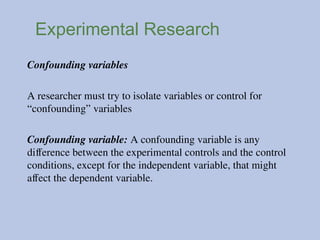
Confounding variables
Aresearcher must try to isolate variables or control for
“confounding” variables
Confounding variable: A confounding variable is any
difference between the experimental controls and the control
conditions, except for the independent variable, that might
affect the dependent variable.
22.
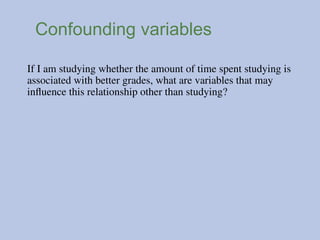
Confounding variables
If Iam studying whether the amount of time spent studying is
associated with better grades, what are variables that may
influence this relationship other than studying?
23.
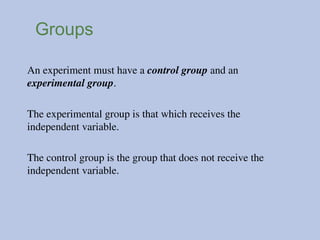
Groups
An experiment musthave a control group and an
experimental group.
The experimental group is that which receives the
independent variable.
The control group is the group that does not receive the
independent variable.
24.
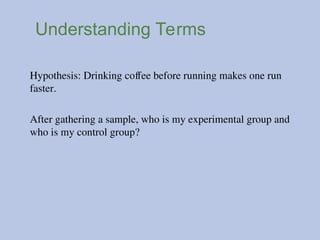
Understanding Terms
Hypothesis: Drinkingcoffee before running makes one run
faster.
After gathering a sample, who is my experimental group and
who is my control group?
25.
Terms
Assignment: Assignment isthe process by which participants
are put into a group, experimental or control.
Random assignment: The process of randomly assigning
participants to either the control or experimental group.
Terms
What if inmy coffee experiment, I allow
participants to join which ever group they
want?
Participant-relevant confounding variables: If
participants were given the opportunity to
choose which group to be in, the results might
become biased.
28.
Terms
Group-matching: If onewanted to match for sexual
orientation, eye color, skin color, or something other variable,
then group matching is the process of assigning individuals to
groups based on some criteria.
Situation-relevant confounding variables: When conducting
an experiment, both groups (experimental and control) must
be subject to the same environment.
29.
Terms
Experimenter Bias: Thetendency for researchers to treat
members of the experimental and control groups differently.
If the aim of my study is confirm my hypothesis, I may
interpret the results differently than someone who is not
involved or does not have an interest.
30.
Controlling for Bias:Experimental
Designs
Single Blind: Participants do not know whether they’re in the
experimental group or the control group.
Double Blind: Neither the participants nor the research
knows who is in which group.
31.
Placebo & PlaceboEffect
Placebo is a substance that has no therapeutic effect; it is
often used in control groups for testing new drugs.
Placebo effect: Participants feel a “psychological” effect, but
have not been given a real substance that would cause “real”
physiological differences in their body.
Correlational Method
Correlation isa statistical measure that indicates the extent to
which two or more variable fluctuate together.
A correlation expresses a relationship between two variables
without ascribing a cause.
Correlation does not equal causation.
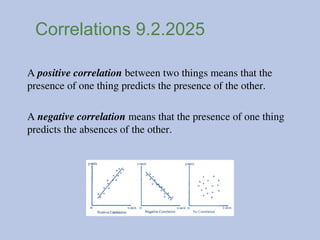
Correlations 9.2.2025
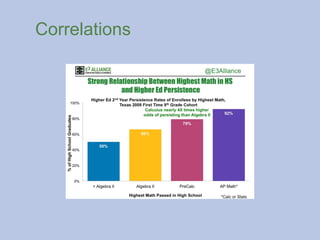
A positivecorrelation between two things means that the
presence of one thing predicts the presence of the other.
A negative correlation means that the presence of one thing
predicts the absences of the other.
38.
Correlations
Predict the correlation
Drinkingwater and feeling thirsty
Studying and amount of free time
Colour of t-shirt worn on exam day and exam grade
Number of hours spent studying and grades
Amount of coffee drunk and talkativeness
Staying up all night and fatigue
Number of fictional books read and driving ability
39.
Correlations
Why use correlations,why not always conduct an
experiment?
Sometimes correlations are the best research method because
you cannot manipulate the data in an experiment.
Does weather affect shop lifting? Is there any way we can
manipulate the weather?
40.
Surveys
Conducting a surveyinvolves asking participants to complete
a questionnaire.
Using the survey method means that one cannot control for
certain confounding variables.
Survey method is subject to the social desirability effect: the
tendency of survey respondents to answer questions in a
manner that will be viewed favorably by others.
41.
Naturalistic Observation
Naturalistic observation:Researchers go out and observe
participants in their natural habitat without interfering at all.
Naturalistic observation is different from field experiments
because in naturalistic observation, researchers do not
interfere.
42.
Case Studies
The casestudy method is often used in clinical psychology.
Case studies allow researchers to get a picture of a small
group of people (as little as one), but this means that the
findings cannot be generalized to any population.
An example of a case studies may be studying a rare
psychological disorder.
43.
APA Ethical Guidelines
Ethicalconsiderations are a major part of research regarding
human and animal research.
Guidelines are established by the American Psychological
Association (APA) for human and animal research.
44.
APA Ethical Guidelines(Animals)
1. Must have a clear scientific purpose.
2. Questions of research must be important.
3. Animals chosen must be suited for the question.
4. Animals must be cared for in a humane way.
5. Animals must be acquired legally.
6. The experimental procedures must be ones which employ
the least amount of suffering possible.
45.
APA Ethical Guidelines(Humans)
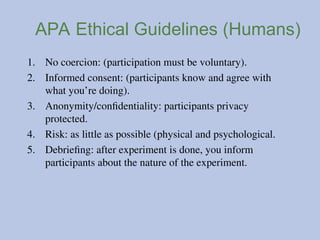
1. No coercion: (participation must be voluntary).
2. Informed consent: (participants know and agree with
what you’re doing).
3. Anonymity/confidentiality: participants privacy
protected.
4. Risk: as little as possible (physical and psychological.
5. Debriefing: after experiment is done, you inform
participants about the nature of the experiment.
Research Methods: Statistics
DescriptiveStatistics
Descriptive statistics describe a set of data.
How many people have black hair in this room?
How many people play a musical instrument?
Good overview video Crash Course’s Methods video
48.
Research Methods: Statistics
DescriptiveStatistics
Reason for using descriptive statistics:
To organize quantitative information into something that is
meaningful.
Descriptive statistics are the measures of central tendency
(mean, median, mode) and the measures of variability (range,
variance, standard deviation).
49.
Statistics
Measures of CentralTendency describe the center of a data
set.
The measures of central tendency are the Mean, Median, and
Mode.
.
50.
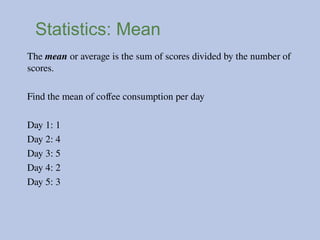
Statistics: Mean
The meanor average is the sum of scores divided by the number of
scores.
Find the mean of coffee consumption per day
Day 1: 1
Day 2: 4
Day 3: 5
Day 4: 2
Day 5: 3
51.
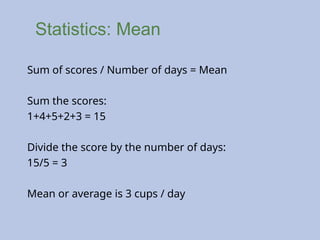
Statistics: Mean
Sum ofscores / Number of days = Mean
Sum the scores:
1+4+5+2+3 = 15
Divide the score by the number of days:
15/5 = 3
Mean or average is 3 cups / day
52.
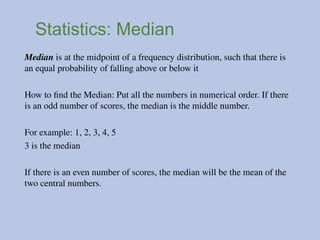
Statistics: Median
Median isat the midpoint of a frequency distribution, such that there is
an equal probability of falling above or below it
How to find the Median: Put all the numbers in numerical order. If there
is an odd number of scores, the median is the middle number.
For example: 1, 2, 3, 4, 5
3 is the median
If there is an even number of scores, the median will be the mean of the
two central numbers.
53.
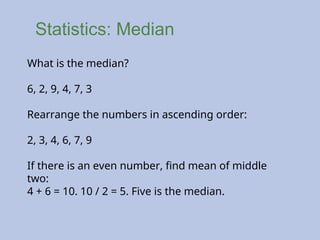
Statistics: Median
What isthe median?
6, 2, 9, 4, 7, 3
Rearrange the numbers in ascending order:
2, 3, 4, 6, 7, 9
If there is an even number, find mean of middle
two:
4 + 6 = 10. 10 / 2 = 5. Five is the median.
54.
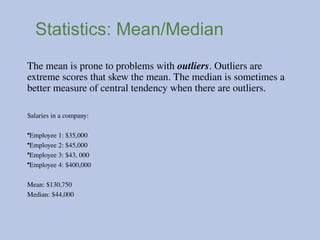
Statistics: Mean/Median
The meanis prone to problems with outliers. Outliers are
extreme scores that skew the mean. The median is sometimes a
better measure of central tendency when there are outliers.
Salaries in a company:
•Employee 1: $35,000
•Employee 2: $45,000
•Employee 3: $43, 000
•Employee 4: $400,000
Mean: $130,750
Median: $44,000
55.
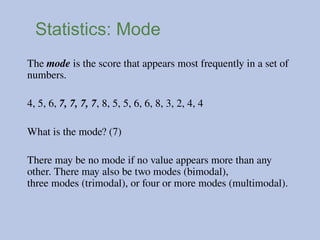
Statistics: Mode
The modeis the score that appears most frequently in a set of
numbers.
4, 5, 6, 7, 7, 7, 7, 8, 5, 5, 6, 6, 8, 3, 2, 4, 4
What is the mode? (7)
There may be no mode if no value appears more than any
other. There may also be two modes (bimodal),
three modes (trimodal), or four or more modes (multimodal).
56.
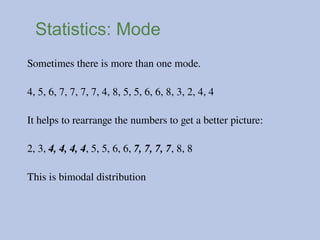
Statistics: Mode
Sometimes thereis more than one mode.
4, 5, 6, 7, 7, 7, 7, 4, 8, 5, 5, 6, 6, 8, 3, 2, 4, 4
It helps to rearrange the numbers to get a better picture:
2, 3, 4, 4, 4, 4, 5, 5, 6, 6, 7, 7, 7, 7, 8, 8
This is bimodal distribution
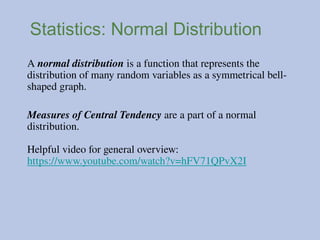
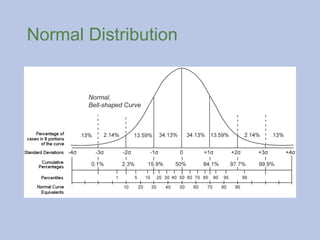
Statistics: Normal Distribution
Anormal distribution is a function that represents the
distribution of many random variables as a symmetrical bell-
shaped graph.
Measures of Central Tendency are a part of a normal
distribution.
Helpful video for general overview:
https://www.youtube.com/watch?v=hFV71QPvX2I
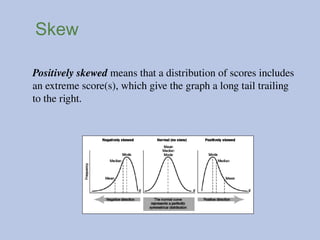
Skew
Positively skewed meansthat a distribution of scores includes
an extreme score(s), which give the graph a long tail trailing
to the right.
61.
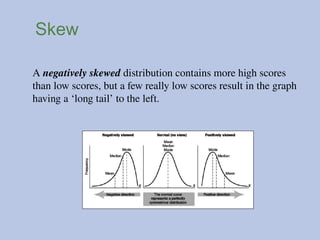
Skew
A negatively skeweddistribution contains more high scores
than low scores, but a few really low scores result in the graph
having a ‘long tail’ to the left.
Measures of Variability
Measuresof variability are statistics that describe the amount
of difference and spread in a data set.
Measures of variability are a part of descriptive statistics, just
like measures of central tendency.
Measures of variability here include range, variance, and
standard deviation.
64.
Range
The range isthe difference between the highest and the lowest
score in a distribution.
If the highest score is 75 and the lowest score is 25, what is
the range?
If the highest score is 10 and the lowest score is 1, what is the
range?
65.
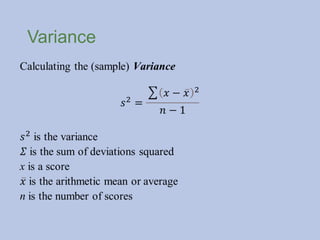
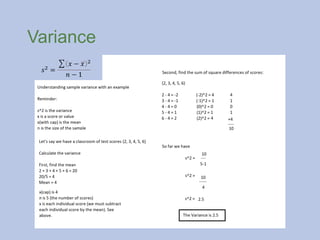
Variance
Variance is thedispersion from the mean.
In a wide variety of cases, we are trying to measure dispersion
from the mean due to a multitude of chance effects.
In other words, the variance measures how much things differ
from the average or mean.
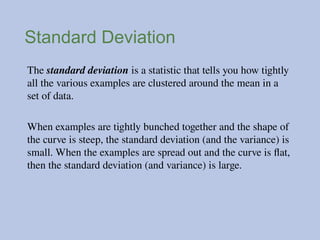
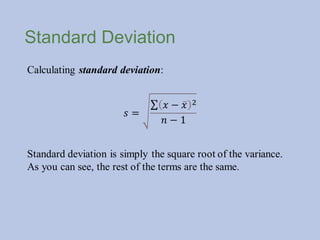
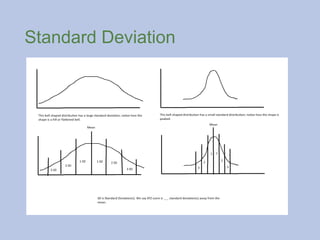
Standard Deviation
The standarddeviation is a statistic that tells you how tightly
all the various examples are clustered around the mean in a
set of data.
When examples are tightly bunched together and the shape of
the curve is steep, the standard deviation (and the variance) is
small. When the examples are spread out and the curve is flat,
then the standard deviation (and variance) is large.
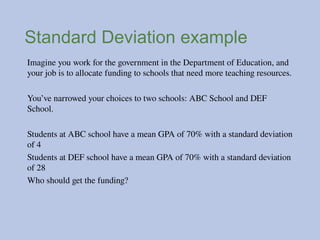
Standard Deviation example
Imagineyou work for the government in the Department of Education, and
your job is to allocate funding to schools that need more teaching resources.
You’ve narrowed your choices to two schools: ABC School and DEF
School.
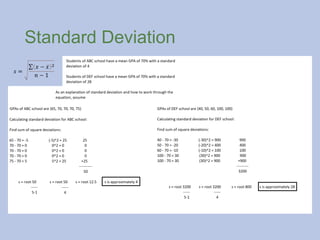
Students at ABC school have a mean GPA of 70% with a standard deviation
of 4
Students at DEF school have a mean GPA of 70% with a standard deviation
of 28
Who should get the funding?
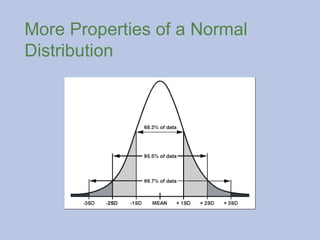
Properties of aNormal
Distribution
The ND is a theoretical bell-shaped curve.
Roughly 68% of scores in a ND fall within one standard
deviation of the mean, approximately 95% of scores fall
within two standard deviations of the mean, and 99% of sores
fall within three standard deviations of the mean.
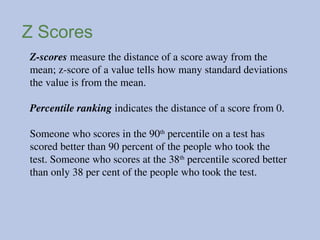
Z Scores
Z-scores measurethe distance of a score away from the
mean; z-score of a value tells how many standard deviations
the value is from the mean.
Percentile ranking indicates the distance of a score from 0.
Someone who scores in the 90th
percentile on a test has
scored better than 90 percent of the people who took the
test. Someone who scores at the 38th
percentile scored better
than only 38 per cent of the people who took the test.
76.
Normal Distribution
Someone whoscores at the 50th
percentile has a Z score of 0,
and someone who scores at the 98th
percentile has an
approximate Z score of +2
What is my z-score if I am in the 99.9 percentile?
77.
Statistical Significance
Statistical significance– used in hypothesis testing which this course does
not cover – is a method to determine whether you can accept your
hypothesis.
Statistical significance is denoted by the Greek letter α
(alpha) and is usually set at 0.05 or 5% in social science research
(psychology).
A researcher calculates what is called the p-value and compares it to α
(0.05), and if the p-value is less than or equal to α then the (alternative)
hypothesis is supported. If the p-value is greater than alpha, then the
(alternative) hypothesis is not supported (we say the null hypothesis is
supported).
78.
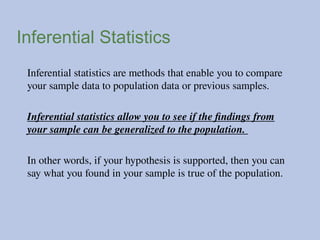
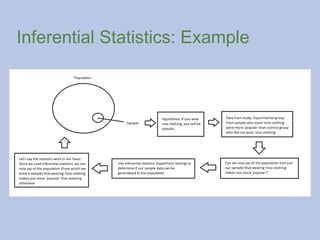
Inferential Statistics
Inferential statisticsare methods that enable you to compare
your sample data to population data or previous samples.
Inferential statistics allow you to see if the findings from
your sample can be generalized to the population.
In other words, if your hypothesis is supported, then you can
say what you found in your sample is true of the population.
#2 The research methods chapter makes up 8-10% of the exam. One of the FRQs is usually a research methods’ question. This is one of the more important chapters to study.
Remember to read the chapter.
#3 The hindsight bias has also been called the I-knew-it-all along phenomenon. If you toss a coin, guess that the coin will heads, it turns out to be tails, and then say, “I had a gut feeling it was going to be tails!,” this is an example of the hindsight bias. Why didn’t you say tails to begin with then?
Overconfidence is another term that may appear on the exam; overconfidence refers to overestimating our belief in an outcome, like an election or how something will turn out.
#4 Psychologist prefer using experiments because experiments can establish cause-and-effect relationships between variables.
Laboratory experiments (or just experiments) are experiments where a sample is drawn from a population and participants are randomly assigned to either the control group and experiment group(s).
*Quasi-experiments are a form of experimental design without random assignment (more on this later).
*Field experiments are a form of experimental design that takes places outside the laboratory or, for brevity, with ‘real people out in the real world’.
Quasi and field experiments cannot yield cause-and-effect relationships because there may be confounding variables (more on this later).
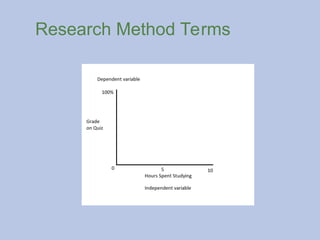
#7 Just like in math:
Independent variable is on the x-axis
Dependent variable is on the y-axis
#8 The exam almost always tests your knowledge of what an operational definition is; either in the multiple-choice questions or in the FRQs.
You can operationally define almost anything by making the variable quantifiable (countable) and by making it observable (able to be detected by your senses or some instrument).
Sadness or depression could be operationally defined as how often someone cries (we can count that and observe that).
We need to operationally define variables so that the experiment can be replicated by other researchers, so that they can provide further support or refute our results.
#9 Validity and reliability both refer to your research design. Does your research design yield reliable results (i.e., results that are consistent). Is your research design valid (i.e., are you measuring some variable, like happiness, in a way that makes sense?).
An invalid – bad measure – of happiness could be observing how often people frown and deciding that is what happiness is; frowning is not what we normally mean by the word happy.
#13 A sample is a small portion (subset) of the population.
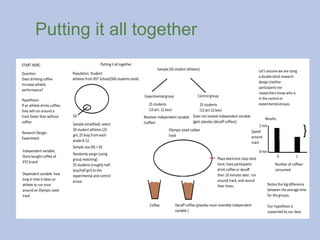
#15 **For example, if I am studying how drinking coffee influences athletic performance, my sample should take from many types of athletes (football athletes, soccer, baseball, tennis, golf, etc.) rather than selecting my sample from one athletic group (football).
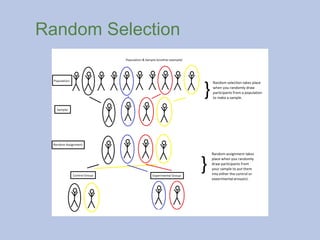
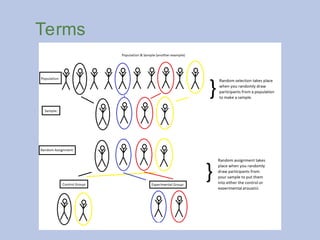
#17 Random selection and random assignment are different; random selection takes place when you’re choosing participants from you population; random assignment is
when you have participants and are assigning them to either the control or experimental group(s).
#18 Random selection and random assignment are different; Random selection takes place when you’re choosing participants from you population; random assignment is
when you have participants and are assigning them to either the control or experimental group(s).
The exam will almost always ask about these terms, and your ability to distinguish the two is crucial.
#19 Stratified sampling and group matching (see later slides) are similar.
Group matching takes place when assignment participants to either the control or experimental group. For example, you might want an equal number of men and women in both the control and experimental group. That is an example of group matching. If you were to use purely random assignment – although group matching can still be random – there might be more women or more men in either the control or experimental group.
*An example of both: Let’s assume our hypothesis is “if given two cups of coffee before a workout, athletes lift 10% more weight. In our sample, we might include 10 football players, 10 soccer, 10 swimmers, 10 golfers, 10 etc.. So our sample is stratified by type of sport. Group matching would be randomly assigning an equal number of each athletic group into either the control or experimental group. For example, 5 football players, 5 golfers, etc., in the experimental group. Five football players, etc., in the control group.
#21 Example: Imagine you wanted to do an experiment to see if a new style of running shoe made people run faster.
Imagine two groups: one set of people with the new running shoe; another group without.
They run around a track and you find that the people who wore your running shoe had a quicker time around the track.
But, maybe it wasn’t the running shoe that accounted for the difference; maybe the people in your running shoe group were athletes, taller, older, stronger, (any other variable that might influence speed but which is not the running shoe).
Those ‘other things’ or variables that may influence your results are confounding variables. Random assignment reduces the likelihood of confounding variables.
#25 Random selection and random assignment are different; Random selection takes place when you’re choosing participants from you population; random assignment is when you have participants (a sample) and are assigning them to either the control or experimental group(s).
Random assignment must randomly assign participants to either the control or experiment group, like drawing names out of a hat.
#26 Random selection and random assignment are different; Random selection takes place when you’re choosing participants from you population; random assignment is when you have participants (a sample) and are assigning them to either the control or experimental group(s).
Random assignment must randomly assign participants to either the control or experiment group, like drawing names out of a hat.
Random assignment – theoretically – eliminates confounding variables.
#28 Stratified sampling and group matching (see later slides) are similar.
Group matching takes place when assignment participants to either the control or experimental group. For example, you might want an equal number of men and women in both the control and experimental group. That is an example of group matching. If you were to use purely random assignment – although group matching can still be random – there might be more women or more men in either the control or experimental group.
An example of both: Let’s assume our hypothesis is “if given two cups of coffee before a workout, athletes lift 10% more weight. In our sample, we might include 10 football players, 10 soccer, 10 swimmers, 10 golfers, 10 etc.. So our sample is stratified by type of sport. Group matching would be randomly assigning an equal number of each athletic group into either the control or experimental group. For example, 5 football players, 5 golfers, etc., in the experimental group. Five football players, etc., in the control group.
#37 Correlation coefficient is another term you might see on the exam. It measures the relatedness of two variables. It ranges from -1 (indicating a strong negative correlation) to +1 (indicating a strong positive correlation). If a correlation coefficient is close to 0, then that indicates that there is not a correlation between the two variables; for example, color of socks worn on exam day and result of exam.
Correlational data is plotted on scatterplots.
#38 Another term you may see on the exam:
Illusory correlation: the belief that there is a correlation between two variables when there is not.
#41 Naturalistic observation is simply observing people or events in ‘real life’.
#47 Descriptive statistics include measures of central tendency (mean, median, mode) and measures of variability (range, variance, standard deviation).
Remember to read the chapter.
#48 Descriptive statistics include measures of central tendency (mean, median, mode) and measures of variability (range, variance, standard deviation).
Remember to read the chapter.
#54 Outliers and ‘extreme scores’ are synonyms. There can be one or a few outliers that cause a graph to become skewed (more on this later).
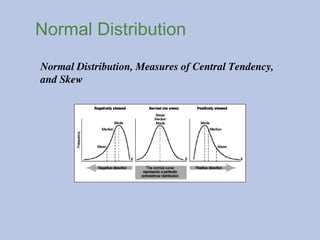
#59 A skewed distribution (positive/negative) is where the mean, median, and mode are not all in the middle of the distribution.
Notice how the measures of central tendency vary between a negatively skewed graph and a positively skewed graph.
Remember outliers or extreme scores? Outliers cause a distribution to have its skewed shape.
I like to think of a negatively skewed distribution like a class of students taking a very easy test: most people do very well, but one or two people do poorly or don’t show up. Those one or two peoples’ scores create the tail of the graph on the left.
Likewise, I imagine a positively skewed graph as one where a class takes a difficult math test, and most people do poorly; except for a few of the math whizzes. The people who do well on the test create the tail on the right side of the graph.
#60 I suggest drawing out each of the graphs. The test might ask a question like:
What kind of distribution has its measures of central tendency in this order: Mean, median, mode? (negative skew)
Or:
If a distribution has the mean, median, and mode in the center, what kind of distribution is that? (normal)
#63 Remember to read the chapter.
To really understand measures of variability (variance, standard deviation), you should first thoroughly understand how to calculate the arithmetic mean or average: Sum of all scores/number of scores. For example, imagine a set of scores {1, 2, 3, 4, 5}, then the mean is:
(1 + 2 + 3 + 4 + 5)
------------------- = 3
5
#64 The range looks at the variation of scores in a data set. It looks at the difference between the highest score and the lowest score.
The range can provide meaningful information about a student’s grades, prices of products and services, or athletic performance of a sports team.
Figuring out the range of a standardized test like the SAT can tell you a lot about the test and the students: If the range is a small number, then the test may be too easy or too hard, or you may just have a great set of students. In most cases, standardized tests should yield a large range. There is at least one problem here: If there is one or two outliers (extreme scores), then the range may not be the best measure of variability (good thing we have other methods!). Imagine looking at the range of incomes in a Starbucks when a billionaire just happened to be getting a cup of coffee (the range would be skewed by the high incomed).
Note: sometimes the interquartile range is used (this eliminates scores at the extreme ends (not tested on in AP Psych)).
#66 You shouldn’t have to calculate the variance on the AP Psych exam. But if you work though an example, it helps demonstrate the idea and better helps you understand standard deviation (up next).
**This equation calculates sample variance. There is another kind of variance called population variance. You will not need to calculate the variance on the exam.
#67 You shouldn’t have to calculate the variance on the AP Psych exam. But if you work though an example, it helps demonstrate the idea and better helps you understand standard deviation (up next).
**This equation calculates sample variance. There is another kind of variance called population variance.
#69 This equation is for the standard deviation of a sample. You will not need to calculate the standard deviation on the AP Psych exam.
#70 I am purposely using the standard deviation as the deciding factor in this (while there would be other factors).
#72 When a standard deviation is large, it means the distribution will be a flattened bell or shaped like a hill.
When a standard deviation is small, it means the distribution will be peaked like Mount Everest or the Matterhorn (mountain in the Alps).
#77 P-value ≤ α (alpha) accept your hypothesis (the alternative hypothesis)
P-value ≥ α (alpha) reject your hypothesis (accept the null hypothesis)
*In research, the null hypothesis is the opposite of what you set out to support. For example, if your hypothesis is “if someone drinks coffee, they run faster,” then the null hypothesis is “if someone drinks coffee, they DO NOT run faster.
When doing research, you always start with the null hypothesis (the negative statement) and try to provide evidence that it’s wrong; in other words, that your hypothesis (the alternative) is supported by the data.


![Polymer [ बहुलक ] Chemistry Notes PDF - Irfanullah Mehar - JJ Sir Chemistry.pdf](https://cdn.slidesharecdn.com/ss_thumbnails/polymerchemistrynotespdf-irfanullahmehar-jjsirchemistry-260210172118-3f9b37f7-thumbnail.jpg?width=640&height=640&fit=bounds)


