- The study investigated how altering wetland hydrology through different flooding treatments (saturated, flashy flood, dry) affected denitrification rates, and whether the microbial source communities influenced rates.
- Wetlands that naturally experience long floods had the highest denitrification rates after re-wetting.
- Re-wetting and saturated treatments produced similar, higher denitrification rates than the dry treatment.
- The hydrological treatment affected denitrification rates more than the origin of the microbial communities.
Biogeochemical cycle is a pathway by which a chemical substance moves through both biotic (biosphere) and abiotic (lithosphere, atmosphere, and hydrosphere) compartments of Earth.
Biogeochemical cycle is a pathway by which a chemical substance moves through both biotic (biosphere) and abiotic (lithosphere, atmosphere, and hydrosphere) compartments of Earth.
Scientific talk on effects of climate variation and young fish
- general ideas about climate effects on marine ecosystems
- variations in temperature-zooplankton-North Sea cod
- spatial population structure and detecting climate effects
SEASONAL VARIATION IN PHYSICO-CHEMICAL PARAMETERS OF SURFACE WATER AND GROUND...Ijrdt Journal
The present study is carried out to assess the water quality parameters of both surface water and ground water of Singanallur lake region a rivulet from river Noyyal. Parameters like pH, FC, DO, BOD, Turbidity, Total phosphates, Nitrates and Total dissolved solids are measured and compared for both summer and rainy season. Results revealed parameters varied to greater extent for surface water compared to ground water. So the surface water of Singanallur region is highly polluted due to runoff from industries, domestic waste and agricultural
Estuaries are a type of wetland that contains brackish water. These are areas that are covered with water during parts of the year and are very biodiverse areas (contain many different species).
Estuaries and their surrounding wetlands are bodies of water usually found where rivers meet the sea. Estuaries are home to unique plant and animal communities that have adapted to brackish water—a mixture of fresh water draining from the land and salty seawater.
Planetary Boundaries: Exploring the Safe Operating Space for Humanity. Slides are all about summary of Johan Rockström et al., which basically talks about the nine planetary boundaries defined by author globally and explains about the control variables, thresholds, and where we as a Human stand right now with respect to both social boundaries and planetary boundaries.
Treatment Performance of Domestic Wastewater in a Tropical Constructed Wetlan...Oswar Mungkasa
prepared by Jonah S Butler* *Fulbright Scholar, DILG-GTZ Affiliate in Philippines: For Environmental Science Study on Wastewater Treatment. (Email: Jonahsbutler@gmail.com) for Urban Environments in Asia, 25-28 May 2011, Manila, Philippines. organized by International Water Association (IWA).
Land, soil and water management: Watershed management practices and hydrologi...ICRISAT
Improve smallholder agricultural productivity through sustainable intensification by managing water resources using a watershed approach. Studying the seasonal variations of water levels in shallow wells at land scale level, establishing new sets of monitoring stations and field experiments to study the dynamics of water availability and land cover changes, water balance modelling from farm to watershed scale and, regional climate change modelling.
Watershed management practices and hydrological modelling under changing clim...africa-rising
Poster prepared by B.Z. Birhanu, F.Kizito, K.Traore, O. Cofie and R. Tabo for the Africa RISING Science for Impact Workshop, Dar es Salaam, 17-19 January 2017
Identification Of Soil Erosion Prone Zones Using Geomatics Technology In Part...IJERA Editor
Soil erosion is the removal and subsequent loss of soil by the action of water, ice, wind and gravity. Soil erosion is a process that occurs naturally at a slow rate. The average natural geologic rate of soil erosion is approximately 0.2 tons per acre per year. Erosion is the process were by the earth or rock is loosened or dissolved and removed from any part of earth‟s surface. Geological erosion is the rate at which the catchment or land would normally be eroded without any disturbance by human activity. If man alters the natural system by means of various land use practices that is caused accelerated erosion. The present study area is covering Parts of North Arcot The area is lies between E78°30'-E78°45' lattitudes N12°15'-N12°30„. The total aerial extent of the study area is 720 sq.km. It falls in the survey of India Toposheet 58 L11 on 1:50,000 scale. The IRS – 1D satellite imagery data were subjected to different types of image enhancement techniques and soil erosion areas were mapped out and GIS databases were generated showing the soil erosion areas using Arc Map 9.1 version. GIS overlay function was executed between soil erosion prone areas and the various controlling variables and the area has been fragmented into a number of polygons of land segments depending upon the controlling variables. Finally, the remedial measures were suggested for each land segment according to the controlling variables.
Termite footprints in restored versus degraded agrosystems in southwestern Ni...
Antonson_Julia_Poster
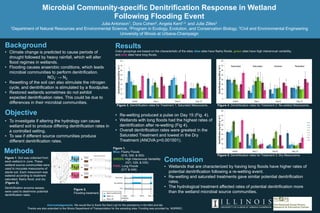
1. Background
• Climate change is predicted to cause periods of
drought followed by heavy rainfall, which will alter
flood regimes in wetlands.
• Flooding causes anaerobic conditions, which leads
microbial communities to perform denitrification.
NO3
- → N2
• Rewetting of the soil can also stimulate the nitrogen
cycle, and denitrification is stimulated by a floodpulse.
• Restored wetlands sometimes do not exhibit
expected denitrification rates. This could be due to
differences in their microbial communities.
Methods
Figure 1. Soil was collected from
each wetland in June. These
wetland source communities were
used to inoculate mesocosms of
sterile soil. Each mesocosm was
watered according to treatment:
saturated, flashy flood, and dry
(Figure 2).
Denitrification enzyme assays
were used to determine potential
denitrification rates.
Acknowledgements: We would like to thank the Kent Lab for the assistance in the field and lab.
Thanks are also extended to the Illinois Department of Transportation for the sampling sites. Funding was provided by NGRREC.
Objective
• To investigate if altering the hydrology can cause
wetland soil to produce differing denitrification rates in
a controlled setting.
• To see if different source communities produce
different denitrification rates.
Figure 1.
Blue: Flashy Floods
(016, 049, & 050)
GREEN: High Interannual Variability
(021, 029, & 035)
PINK: Long Floods
(017 & 046)
Microbial Community-specific Denitrification Response in Wetland
Following Flooding Event
Julia Antonson1, Dora Cohen2, Angela Kent1,2
, and Julie Zilles3
1Department of Natural Resources and Environmental Science, 2Program in Ecology, Evolution, and Conservation Biology, 3Civil and Environmental Engineering
University of Illinois at Urbana-Champaign
Results
Figure 2.
Flooding treatment.
Color groupings are based on the characteristic of the sites: blue sites have flashy floods, green sites have high interannual variability,
and pink sites have long floods.
• Re-wetting produced a pulse on Day 15 (Fig. 4).
• Wetlands with long floods had the highest rates of
denitrification after re-wetting (Fig 4).
• Overall denitrification rates were greatest in the
Saturated Treatment and lowest in the Dry
Treatment (ANOVA p=0.001501).
• Wetlands that are characterized by having long floods have higher rates of
potential denitrification following a re-wetting event.
• Re-wetting and saturated treatments gave similar potential denitrification
rates.
• The hydrological treatment affected rates of potential denitrification more
than the wetland microbial source communities.
Conclusion
Figure 3. Denitrification rates for Treatment 1: Saturated Mesocosms.
0
10
20
30
40
50
60
70
80
initial Day 1 Day 8 Day 15
Denitrification (ng N2O g-1hr-1)
Figure 4. Denitrification rates for Treatment 2: Re-wetted Mesocosms.
0
10
20
30
40
50
60
70
80
initial Day 1 Day 8 Day 15
Denitrification (ng N2O g-1hr-1)
Figure 5. Denitrification rates for Treatment 3: Dry Mesocosms.
0
10
20
30
40
50
60
70
80
initial Day 1 Day 8 Day 15
Denitrification (ng N2O g-1hr-1)
016
049
050
021
029
035
017
046
Saturated Saturated Drained Rewetted