Annual_Sales_With_Pivot_Table
•
0 likes•81 views
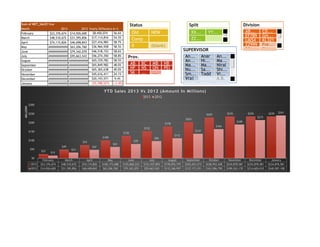
The document shows net sales figures for 2013 and 2012 by month. For each month, it provides the dollar amount for 2013 and 2012 and the yearly difference in both dollars and percentage terms. Overall, net sales were significantly higher in 2013 than 2012 for every month, with percentage increases ranging from 9.4% to 58.8%. A line graph depicts the year-to-date sales figures for 2013 versus 2012, with 2013 sales substantially above 2012 each month.
Report
Share
Report
Share
Download to read offline
Recommended
FHC EUNITEDSTATESE FORECAST BUDGETING 2019
The document presents monthly and total statistics for various metrics from January to December. The totals include 109500 numbers, 4599 dollars, 6260 dollars, 3194 dollars, and 6260 dollars respectively. The monthly percentages range from 50% to 75% for the number categories. Total figures are also provided for room spaces and budgets for various room types from January to December.
Projected budget 2016 FHC K'CANADA'K
The document appears to be a monthly budget report for a hotel and conference center. It includes data on room bookings, revenues, and expenses broken down by month. The totals at the bottom indicate that for the year, the hotel booked 36,500 room nights generating over $2 million in room revenue and $1.3 million in food and beverage revenue. Expenses for the year totaled over $3.7 million, resulting in a net profit of around $3.6 million.
For You: Love Poems
The document is a collection of poems by a college professor on the nature of continuity. The poems reflect on how continuity is our first collection of poetry and explores the nature of ongoingness through various subjects.
Monthly_Sale_Vs._Average_Monthly_Sales
This document shows monthly sales figures for 2013, comparing actual sales to the average monthly sales. Actual sales were significantly below average in February and July, dropping 32.1% and 13.9% respectively. Sales exceeded the average in April, May, August, October, rising as much as 16.3% in August. A chart illustrates the monthly sales figures and how actual sales compared to the average monthly sales.
3 projected budgeting 2016 X'FHC KL'M
This document contains capacity and financial information for various hotels and concepts over 12 months. It includes numbers of rooms sold, projected revenues from accommodation, food and beverage, spa packages and events. Total projected revenue for the year across all concepts mentioned is over $7 million. Exploitation risks of 10% on taxes and a 5% advertising budget are also included.
FHC BUDGET IUSAI 2017
YOUR BUSINESS IS YOUR PROFITABILITY IN CONCEPT HOTEL FUTURIST. SEE YOUR FUTURE AS YOUR PRESENT AND INVEST IN CREATIVITY THAT MAKES SENSE AND REALITY FOR BOTH GUESTS, MANAGEMENT AND STAFF. A NEW VISION AT SHORT TERM, MID TERM OR LONG TERM QUALITY AND TECHNOLOGY HOSPITALITY INDUSTRY.
FHC BUDGET YLONDONE 2018
YOUR BUSINESS IS YOUR PROFITABILITY IN CONCEPT HOTEL FUTURIST. SEE YOUR FUTURE AS YOUR PRESENT AND INVEST IN CREATIVITY THAT MAKES SENSE AND REALITY FOR BOTH GUESTS, MANAGEMENT AND STAFF. A NEW VISION AT SHORT TERM, MID TERM OR LONG TERM QUALITY AND TECHNOLOGY HOSPITALITY INDUSTRY.
FHC M ARAB O 2017
The document appears to contain monthly financial data for various categories including numbers, percentages, amounts in AED currency, and room rates. It includes data for 12 months as well as totals. The data seems to cover multiple divisions and includes things like turnover, rooms sold, seminar rooms, aquatic universe, hotel revenue and more. Overall it is a detailed financial report with monthly and total figures.
3 projected budgeting 2016 FHC Z'DUBLIN'E
The document contains monthly capacity and budgeting projections for a hotel called the Futurist Hotel Concept Z'Dublin'I**** for the year 2016. It includes projections for room numbers, prices, budgets, expenses, room rates and packages, and projected totals for accommodation, exploitation and risks. The projections show steady occupancy from January through December with rates varying by month. A total annual budget of over 12 million euros is projected along with potential risks and additional projected figures.
1 projected budgeting 2016 FHC Y'LONDON'E
The document contains tables with capacity, numbers, prices and rates for various months. It shows occupancy percentages and figures for a hotel with different room types, packages, and seminar pricing. The total projected budget for an aquatic concept hotel in London called 'Y'London'e is estimated at $7,902,800 with additional projected risks and taxes.
FHC BUDGET RDATCHAM 2018
YOUR BUSINESS IS YOUR PROFITABILITY IN CONCEPT HOTEL FUTURIST. SEE YOUR FUTURE AS YOUR PRESENT AND INVEST IN CREATIVITY THAT MAKES SENSE AND REALITY FOR BOTH GUESTS, MANAGEMENT AND STAFF. A NEW VISION AT SHORT TERM, MID TERM OR LONG TERM QUALITY AND TECHNOLOGY HOSPITALITY INDUSTRY.
FHC YLONDONE FORECAST BUDGETING 2019
YOUR BUSINESS IS YOUR PROFITABILITY IN CONCEPT HOTEL FUTURIST. SEE YOUR FUTURE AS YOUR PRESENT AND INVEST IN CREATIVITY THAT MAKES SENSE AND REALITY FOR BOTH GUESTS, MANAGEMENT AND STAFF. A NEW VISION AT SHORT TERM, MID TERM OR LONG TERM QUALITY AND TECHNOLOGY HOSPITALITY INDUSTRY.
Projected budgeting 2016 FHC E'UNITED STATES'E
The document shows monthly data for room sales and revenue for a hotel over a 12 month period in 2016. It includes details like room rates, occupancy percentages, numbers of rooms sold, revenue amounts, and totals for the year. Overall room sales and revenue totals for the year are provided at the end.
Projected budgeting 2016 FHC O'NEW YORK'A
The document appears to be a financial report containing data on numbers, percentages, monetary values, prices and room occupancy for each month of the year. It includes sections with tables of figures for things like numbers booked, prices, totals and projected risks. The report seems to provide an overview of the financial performance and projections for something described as the 'Futurist Hotel Concept O'New York'a 2016'.
FHC WAMERICAW FORECAST BUDGETING 2019
YOUR BUSINESS IS YOUR PROFITABILITY IN CONCEPT HOTEL FUTURIST. SEE YOUR FUTURE AS YOUR PRESENT AND INVEST IN CREATIVITY THAT MAKES SENSE AND REALITY FOR BOTH GUESTS, MANAGEMENT AND STAFF. A NEW VISION AT SHORT TERM, MID TERM OR LONG TERM QUALITY AND TECHNOLOGY HOSPITALITY INDUSTRY.
4 projected budgeting 2016 FHC Y'LONDON'E
The document contains capacity and budgeting information for a hotel called the Futurist Hotel Concept Y'London'E. It includes data on room numbers, rates, and projected budgets for accommodation spaces, packages, and outlets. The totals projected for exploitation are $97.7 million and $30.6 million, with projected risks of 10% on included taxes and figures.
FHC JISRAELS FORECAST BUDGETING 2019
YOUR BUSINESS IS YOUR PROFITABILITY IN CONCEPT HOTEL FUTURIST. SEE YOUR FUTURE AS YOUR PRESENT AND INVEST IN CREATIVITY THAT MAKES SENSE AND REALITY FOR BOTH GUESTS, MANAGEMENT AND STAFF. A NEW VISION AT SHORT TERM, MID TERM OR LONG TERM QUALITY AND TECHNOLOGY HOSPITALITY INDUSTRY.
4 projected budgeting 2016 FHC P'VEGAS'M
The document contains monthly capacity and financial data for an unnamed hotel from January to December. It includes information on numbers of guests and rooms sold each month, accommodation prices, spa/treatment packages and prices, projected advertising budgets, and total monthly and weekly figures. Overall metrics on total guests, rooms, and revenues for the year are also provided.
2 projected budgeting 2016 X'FHC KL'M
This document contains tables with capacity, numbers, and financial data for different months. There are sections showing numbers of people, rooms sold, and revenues for various locations for each month of the year. Total annual numbers and revenues are provided at the bottom.
FHC BUDGET DAUSTRALIAP 2017
YOUR BUSINESS IS YOUR PROFITABILITY IN CONCEPT HOTEL FUTURIST. SEE YOUR FUTURE AS YOUR PRESENT AND INVEST IN CREATIVITY THAT MAKES SENSE AND REALITY FOR BOTH GUESTS, MANAGEMENT AND STAFF. A NEW VISION AT SHORT TERM, MID TERM OR LONG TERM QUALITY AND TECHNOLOGY HOSPITALITY INDUSTRY.
Excel Chart Gallery
This document contains a heat chart showing utilization percentages for incoming and outgoing network traffic over time. The chart includes volume overlay and percentiles to provide managers multiple ways to view utilization data trends and identify potential capacity issues. Managers can choose the visualization that best suits their needs to make effective decisions regarding system upgrades or downgrades. Additional analyses can be added as needed.
(Mangaca)lab 2 scissors office supply annual sales 1 sheet1
The document shows annual sales figures from five different offices - Boston, Miami, St. Louis, Santa Fe, and their totals. It includes sales categories of consumer, small business, large business, government, and nonprofit. Santa Fe had the highest total annual sales of $736,386.88 while Boston had the lowest of $873,218.31.
Charts total annual unit sales - all property-jan 2014
Total home sales in the Crystal Coast region have fluctuated since 2003, peaking at over 3,700 units in 2005 but falling to below 1,200 in 2008 due to the recession. Sales have since rebounded, reaching over 2,600 units in 2012 and estimated to be over 2,600 for 2013 based on year-to-date figures.
Scissors office supply annual sales (emerson)
Scissors Office Supply's annual sales report shows total sales of $2.8 million distributed across different customer types and locations, with the largest shares coming from Boston ($873,254) and Santa Fe ($736,386) and the biggest customer types being small businesses ($761,439) and large businesses ($709,646).
(Lucagbo) Chap1-lab2 Scissors office supply annual sales sheet1
The document shows the annual sales figures for different customer segments in four cities for a scissors and office supply company. Total annual sales across all cities was over $2.8 million, with the highest sales in Boston and the lowest in St. Louis. Government and large business customers contributed the most to total sales.
How to Plan an Effective Annual Sales Meeting
In this presentation you'll learn a helpful acronym to help you remember five objectives to consider for planning an effective annual sales meeting.
Sales contests and sales meetings
The document discusses sales meetings and their purpose, types, advantages, and disadvantages. It notes that sales meetings are held for communication, motivation, and exchanging information and ideas. The main types discussed are national sales meetings, regional sales meetings, and the use of technology like closed-circuit TV. Advantages include stimulation for sales personnel and learning from others' experiences, while disadvantages include disruption to business and increased costs.
Hawaii Real Estate 2014 statistics trends sale report All Islands Hawaii Big ...
Hawaii Real Estate 2014 statistics trends sale report All Islands Hawaii Big Island, Maui, Kauai, Oahu
Historic Sales Price Trend Of Lake Lanier Waterfront Homes For The Past 5 Years!
Historic Sales Price Trend Of Lake Lanier Waterfront Homes For The Past 5 Years! Wow! These numbers are startling!
www.LakeSidneyLanierHomes.com
www.LakeSidneyLanierHomes.Blogspot.com
www.LakeLanierLotsAndLand.com
Test
This document summarizes key digital metrics for WKBW.com for July 24th, 2017. It includes pageviews, video views, unique users, and social media interactions for the day and month-to-date, broken down by age, gender, device, and top referral sites. Performance is compared to goals and prior year. Definitions of terms are provided to explain the various metrics.
More Related Content
What's hot
3 projected budgeting 2016 FHC Z'DUBLIN'E
The document contains monthly capacity and budgeting projections for a hotel called the Futurist Hotel Concept Z'Dublin'I**** for the year 2016. It includes projections for room numbers, prices, budgets, expenses, room rates and packages, and projected totals for accommodation, exploitation and risks. The projections show steady occupancy from January through December with rates varying by month. A total annual budget of over 12 million euros is projected along with potential risks and additional projected figures.
1 projected budgeting 2016 FHC Y'LONDON'E
The document contains tables with capacity, numbers, prices and rates for various months. It shows occupancy percentages and figures for a hotel with different room types, packages, and seminar pricing. The total projected budget for an aquatic concept hotel in London called 'Y'London'e is estimated at $7,902,800 with additional projected risks and taxes.
FHC BUDGET RDATCHAM 2018
YOUR BUSINESS IS YOUR PROFITABILITY IN CONCEPT HOTEL FUTURIST. SEE YOUR FUTURE AS YOUR PRESENT AND INVEST IN CREATIVITY THAT MAKES SENSE AND REALITY FOR BOTH GUESTS, MANAGEMENT AND STAFF. A NEW VISION AT SHORT TERM, MID TERM OR LONG TERM QUALITY AND TECHNOLOGY HOSPITALITY INDUSTRY.
FHC YLONDONE FORECAST BUDGETING 2019
YOUR BUSINESS IS YOUR PROFITABILITY IN CONCEPT HOTEL FUTURIST. SEE YOUR FUTURE AS YOUR PRESENT AND INVEST IN CREATIVITY THAT MAKES SENSE AND REALITY FOR BOTH GUESTS, MANAGEMENT AND STAFF. A NEW VISION AT SHORT TERM, MID TERM OR LONG TERM QUALITY AND TECHNOLOGY HOSPITALITY INDUSTRY.
Projected budgeting 2016 FHC E'UNITED STATES'E
The document shows monthly data for room sales and revenue for a hotel over a 12 month period in 2016. It includes details like room rates, occupancy percentages, numbers of rooms sold, revenue amounts, and totals for the year. Overall room sales and revenue totals for the year are provided at the end.
Projected budgeting 2016 FHC O'NEW YORK'A
The document appears to be a financial report containing data on numbers, percentages, monetary values, prices and room occupancy for each month of the year. It includes sections with tables of figures for things like numbers booked, prices, totals and projected risks. The report seems to provide an overview of the financial performance and projections for something described as the 'Futurist Hotel Concept O'New York'a 2016'.
FHC WAMERICAW FORECAST BUDGETING 2019
YOUR BUSINESS IS YOUR PROFITABILITY IN CONCEPT HOTEL FUTURIST. SEE YOUR FUTURE AS YOUR PRESENT AND INVEST IN CREATIVITY THAT MAKES SENSE AND REALITY FOR BOTH GUESTS, MANAGEMENT AND STAFF. A NEW VISION AT SHORT TERM, MID TERM OR LONG TERM QUALITY AND TECHNOLOGY HOSPITALITY INDUSTRY.
4 projected budgeting 2016 FHC Y'LONDON'E
The document contains capacity and budgeting information for a hotel called the Futurist Hotel Concept Y'London'E. It includes data on room numbers, rates, and projected budgets for accommodation spaces, packages, and outlets. The totals projected for exploitation are $97.7 million and $30.6 million, with projected risks of 10% on included taxes and figures.
FHC JISRAELS FORECAST BUDGETING 2019
YOUR BUSINESS IS YOUR PROFITABILITY IN CONCEPT HOTEL FUTURIST. SEE YOUR FUTURE AS YOUR PRESENT AND INVEST IN CREATIVITY THAT MAKES SENSE AND REALITY FOR BOTH GUESTS, MANAGEMENT AND STAFF. A NEW VISION AT SHORT TERM, MID TERM OR LONG TERM QUALITY AND TECHNOLOGY HOSPITALITY INDUSTRY.
4 projected budgeting 2016 FHC P'VEGAS'M
The document contains monthly capacity and financial data for an unnamed hotel from January to December. It includes information on numbers of guests and rooms sold each month, accommodation prices, spa/treatment packages and prices, projected advertising budgets, and total monthly and weekly figures. Overall metrics on total guests, rooms, and revenues for the year are also provided.
2 projected budgeting 2016 X'FHC KL'M
This document contains tables with capacity, numbers, and financial data for different months. There are sections showing numbers of people, rooms sold, and revenues for various locations for each month of the year. Total annual numbers and revenues are provided at the bottom.
FHC BUDGET DAUSTRALIAP 2017
YOUR BUSINESS IS YOUR PROFITABILITY IN CONCEPT HOTEL FUTURIST. SEE YOUR FUTURE AS YOUR PRESENT AND INVEST IN CREATIVITY THAT MAKES SENSE AND REALITY FOR BOTH GUESTS, MANAGEMENT AND STAFF. A NEW VISION AT SHORT TERM, MID TERM OR LONG TERM QUALITY AND TECHNOLOGY HOSPITALITY INDUSTRY.
Excel Chart Gallery
This document contains a heat chart showing utilization percentages for incoming and outgoing network traffic over time. The chart includes volume overlay and percentiles to provide managers multiple ways to view utilization data trends and identify potential capacity issues. Managers can choose the visualization that best suits their needs to make effective decisions regarding system upgrades or downgrades. Additional analyses can be added as needed.
What's hot (13)
Viewers also liked
(Mangaca)lab 2 scissors office supply annual sales 1 sheet1
The document shows annual sales figures from five different offices - Boston, Miami, St. Louis, Santa Fe, and their totals. It includes sales categories of consumer, small business, large business, government, and nonprofit. Santa Fe had the highest total annual sales of $736,386.88 while Boston had the lowest of $873,218.31.
Charts total annual unit sales - all property-jan 2014
Total home sales in the Crystal Coast region have fluctuated since 2003, peaking at over 3,700 units in 2005 but falling to below 1,200 in 2008 due to the recession. Sales have since rebounded, reaching over 2,600 units in 2012 and estimated to be over 2,600 for 2013 based on year-to-date figures.
Scissors office supply annual sales (emerson)
Scissors Office Supply's annual sales report shows total sales of $2.8 million distributed across different customer types and locations, with the largest shares coming from Boston ($873,254) and Santa Fe ($736,386) and the biggest customer types being small businesses ($761,439) and large businesses ($709,646).
(Lucagbo) Chap1-lab2 Scissors office supply annual sales sheet1
The document shows the annual sales figures for different customer segments in four cities for a scissors and office supply company. Total annual sales across all cities was over $2.8 million, with the highest sales in Boston and the lowest in St. Louis. Government and large business customers contributed the most to total sales.
How to Plan an Effective Annual Sales Meeting
In this presentation you'll learn a helpful acronym to help you remember five objectives to consider for planning an effective annual sales meeting.
Sales contests and sales meetings
The document discusses sales meetings and their purpose, types, advantages, and disadvantages. It notes that sales meetings are held for communication, motivation, and exchanging information and ideas. The main types discussed are national sales meetings, regional sales meetings, and the use of technology like closed-circuit TV. Advantages include stimulation for sales personnel and learning from others' experiences, while disadvantages include disruption to business and increased costs.
Viewers also liked (6)
(Mangaca)lab 2 scissors office supply annual sales 1 sheet1
(Mangaca)lab 2 scissors office supply annual sales 1 sheet1
Charts total annual unit sales - all property-jan 2014
Charts total annual unit sales - all property-jan 2014
(Lucagbo) Chap1-lab2 Scissors office supply annual sales sheet1
(Lucagbo) Chap1-lab2 Scissors office supply annual sales sheet1
Similar to Annual_Sales_With_Pivot_Table
Hawaii Real Estate 2014 statistics trends sale report All Islands Hawaii Big ...
Hawaii Real Estate 2014 statistics trends sale report All Islands Hawaii Big Island, Maui, Kauai, Oahu
Historic Sales Price Trend Of Lake Lanier Waterfront Homes For The Past 5 Years!
Historic Sales Price Trend Of Lake Lanier Waterfront Homes For The Past 5 Years! Wow! These numbers are startling!
www.LakeSidneyLanierHomes.com
www.LakeSidneyLanierHomes.Blogspot.com
www.LakeLanierLotsAndLand.com
Test
This document summarizes key digital metrics for WKBW.com for July 24th, 2017. It includes pageviews, video views, unique users, and social media interactions for the day and month-to-date, broken down by age, gender, device, and top referral sites. Performance is compared to goals and prior year. Definitions of terms are provided to explain the various metrics.
Austin Real Estate Statistics May 2013 Austin Home Team
Austin real estate market statistics for May 2013. Provided by Austin Home Team via the Austin Board of REALTORS.
SAS Analytics Presentation 2012 Retail ECOX Final1
This document discusses how banking and retail organizations can leverage customer data and analytics to improve customer retention, cross-selling, and targeting of offers. It notes that both industries can use predictive modeling approaches like next best offer analysis on transaction and customer data to better understand customer needs and behavior over their lifetime with the organization. Specifically, the document discusses how customer spending, product holdings, and attrition rates can be analyzed across time periods to identify opportunities to keep customers engaged at different life stages.
PFP RMA_RMC Presentation Kevin
The document analyzes productivity and costs associated with glove box removal at the PFP site. It finds that the RMA/RMC teams have an average efficiency rate of 68%, resulting in 33.5 missed shifts per month and added costs of $1.1 million per month. Over 7 months, the total additional costs amount to $8 million. The document categorizes causes of missed shifts such as project management, external factors, and overtime.
Graphs 123456789 CHSZ
This document contains tables and graphs showing profit and advertising costs over 5 years for an unknown company. It includes a table with monthly profits from January to December for each of the 5 years. It also includes a table with annual advertising costs broken down by type of advertising. Finally, it contains an amortization schedule showing the balance, principal, interest and additional payment due each month over 17 months.
Graphs 4444565e5545454654545
This document contains tables and graphs showing profit and advertising costs over 5 years for an unknown company. It includes a table with monthly profits from January to December for each of the 5 years. It also includes a table with annual advertising costs broken down by type of advertising. Finally, it contains an amortization schedule showing the balance, principal, interest and additional payment due each month over 17 months.
Graphs 123456789 CHSZ
This document contains tables and graphs showing profit and advertising costs over 5 years for an unknown company. It includes a table with monthly profits from January to December for each of the 5 years. It also includes a table with annual advertising costs broken down by type of advertising. Finally, it contains an amortization schedule showing the balance, principal, interest and additional payment due each month over 17 months.
FHC BUDGET MARABO 2017
This document contains tables of financial data for different months of the year. It includes numbers of people, rooms sold, room rates, and revenues for various types of rooms in dirhams. It also includes totals for revenues from rooms, seminar rooms, and additional facilities like an aquatic center. The tables show monthly and overall totals for the year for occupancy rates, revenues, and average daily room rates.
HeroConf2016_Forecasting Preso_Final
This document provides tips for creating successful paid search forecasts through storytelling. It recommends framing forecasts as a story to make them more engaging for audiences. Key elements of an effective story-based forecast include keeping it simple, emotional, truthful, based on real data, and showing numbers to validate assumptions. The document also stresses the importance of accounting for variables like seasonality, metrics fluctuations, and regularly updating forecasts as new information becomes available. The overall goal of forecasting is to set benchmarks, measure progress, and tell the marketing story rather than perfectly predict numbers.
Rmls Data 1 22 08
The document contains monthly sales data from 1993 to 2007 for closed home sales, total sales volume, average home price, and average days on market. Some key trends highlighted in the data include:
- Closed home sales declined 7.63% from 2007 to 2008 but had generally increased each year from 1993 to 2006.
- Total sales volume peaked in 2006 but declined 1.49% in 2007 and 7.53% in 2008.
- The average home price increased over 71% from 2001 to 2007, with continuous annual growth over that period.
- The absorption rate, measuring the speed of home sales, fluctuated monthly but generally declined from the early 2000s figures.
Data Analysis A4
The document is a summary report analyzing trends in four financial industries from 2012-2022. It finds that portfolio management had the highest average rates in the last two years while commercial banking had the lowest. All industries generally increased over the past decade with 2022 being the highest year for most. The greatest increase in average rates over the last year was in all other financial investment activities.
FHC BUDGET ACOSTARICAC 2018
The document contains financial data for a hotel project in Costa Rica across 12 months. It includes numbers of guests, rooms sold and room rates for different room types. The total projected revenue for the hotel is ₡17,756,520. It also includes budgets for additional facilities like an aquatic universe, seminar rooms and a spa.
July 2015 - Market Snapshot - General Overview
This document contains market data comparing July 2015 to previous months and years for several counties in California. The key points are:
- Single family and condo/townhouse inventory increased in July 2015 compared to July 2014 across most counties. Santa Clara county saw the largest year-over-year inventory growth at 31%.
- Closed sales were up in July 2015 compared to the previous year for most counties. Santa Clara county again saw the largest increase, with closed sales rising 31% from July 2014 to July 2015.
- Median and average sales prices rose from July 2014 to July 2015 in most counties, with increases ranging from 3% to 14% depending on the county and property type.
Visualizing data
The document contains data on various industries from 2008-2018 including average rates, monthly rates, and yearly rates. It analyzes the computer systems design industry, which had the highest average rates in recent years, as well as the building inspection industry, which had the lowest. The data shows all industries increased over the 10-year period from 2008 to 2018. The document also notes September had the highest values across industries each year.
Graphs nnn
This document contains tables and graphs showing the monthly profits, costs, and interest accrued on loans for a business over 5 years. It includes the monthly profits from January to December for each of the 5 years. It also includes tables listing the costs of various inventory items purchased each year, advertising costs, and a amortization schedule showing the monthly payments, interest, and balances on a $1,175 business loan over 14 months. References are provided at the end.
Graphs 34
This document contains tables and graphs showing the monthly profits, costs, and interest accrued on loans for a business over 5 years. It includes the monthly profits from January to December for each of the 5 years. It also includes tables listing the costs of various inventory items purchased each year, advertising costs, and a amortization schedule showing the monthly payments, interest, and balances on a $1,175 business loan over 14 months. References are provided at the end.
Bus Terminal2551
This document contains tabular data reporting statistics on various metrics (such as population, number of incidents, etc.) for multiple regions over three time periods. The data is broken down by region and metric, with totals provided at the bottom. Metrics include population counts, number of incidents, expenditures, etc. The data allows for comparisons across regions and time periods on these different policy metrics.
September 2015 - Market Snapshot - General Overvew
- The document provides market snapshot data for single family homes and condos/townhomes in several California counties (Monterey, San Benito, San Mateo, Santa Clara, Santa Cruz) comparing September 2015 to August 2015 and September 2014.
- For single family homes, inventory decreased or remained flat month-over-month but increased year-over-year for most counties. Median and average prices increased for most counties both month-over-month and year-over-year.
- For condos/townhomes, inventory increased month-over-month for most counties while closed sales were mixed; median and average prices generally increased.
Similar to Annual_Sales_With_Pivot_Table (20)
Hawaii Real Estate 2014 statistics trends sale report All Islands Hawaii Big ...
Hawaii Real Estate 2014 statistics trends sale report All Islands Hawaii Big ...
Historic Sales Price Trend Of Lake Lanier Waterfront Homes For The Past 5 Years!
Historic Sales Price Trend Of Lake Lanier Waterfront Homes For The Past 5 Years!
Austin Real Estate Statistics May 2013 Austin Home Team
Austin Real Estate Statistics May 2013 Austin Home Team
SAS Analytics Presentation 2012 Retail ECOX Final1
SAS Analytics Presentation 2012 Retail ECOX Final1
September 2015 - Market Snapshot - General Overvew
September 2015 - Market Snapshot - General Overvew
More from Anand Chokshi
Tableau - ANAND Chokshi DEMO - Horizontol Bar Chart1
This document contains sales data for various US states broken down by category (furniture, office supplies, technology). It shows the sum of sales for each state in each category, with the values labeled on a bar chart ranging from $0 to $150,000. The top selling states for furniture were California, New York and Texas. The top states for office supplies were California, New York and Pennsylvania. The top states for technology were California, Texas and New York.
Tableau - ANAND Chokshi DEMO - Box and Whisker Plot Chart
This chart shows the sum of sales for three categories - Furniture, Office Supplies, and Technology - grouped by quarterly order dates. The data ranges from $0 to $100,000 in sales for each category quarterly.
Tableau - ANAND CHOKSHI DEMO - Line Chart
This line chart shows the total monthly sales from 2011 to 2014 broken down by category (Furniture, Office Supplies, Technology) with each category displayed in a different color. Sales data is listed by month on the x-axis with the corresponding dollar amount on the y-axis, demonstrating trends in monthly sales over the years for each category.
Tableau - ANAND CHOKHI DEMO - Circle View (By Region) Chart
This document contains data on monthly order profits, quantities, and sales from January 2011 to December 2014 broken down by region. A circle chart visualizes the sum of profit, quantity, and sales for each month and region over this time period. Color is used to show details for each of the four regions: Central, East, South, and West.
Anand Chokshi - Tableau DEMO - Line Chart
This table shows sales figures from 2011 to 2015, with sales increasing from $0 to $100,000 over those years and the difference in sales and percentage difference in sales also increasing substantially over time, with the percentage difference growing from 0% to 1000% between 2011 and 2015.
Tableau - ANAND DEMO - Horizontol Bar Chart
This document contains a table showing sales figures for each US state broken down by country. The table lists each state alongside sales values ranging from $0 to $500,000. The highest selling states were Texas with $457,688 in sales, California with $310,876, and New York with $170,188. Many other states had sales under $100,000. This table provides a breakdown of sales by US state and country.
Tableau - ANAND CHOKHI DEMO - Tress Map Chart
This document contains a table listing US states and their corresponding sales figures. The state with the highest sales is California with 457,688 followed by Texas with 170,188. The table includes sales data for 31 states ranging from Rhode Island with 22,628 to Utah with 11,220.
Tableau - ANAND CHOKHI DEMO - Lines (3) Bar Chart
This data shows the profit, quantity, and sales amounts for each month from 2011 to 2015. The sums of profit, quantity, and sales are plotted on a line and bar chart to visualize the trends over time for these values grouped by month of the order date.
Tableau - ANAND CHOKHI DEMO - Line Chart1
This line chart shows the total sales and quantity by month from May 2011 to November 2014, with data grouped by region. The trends show increasing sales and quantity over time, with the most sales and quantity consistently in the Central region and the least in the West region.
Tableau - ANAND CHOKHI DEMO - Line Chart
This line chart shows the total monthly sales from May 2011 to November 2014 grouped by region, with the regions represented by different colors. The chart demonstrates that overall sales increased over time, reaching over 30,000 units by November 2014, with the central and western regions typically having higher sales than the east and south.
Tableau - ANAND CHOKHI DEMO - Filled Map Chart
This document contains population data for various US states ranging from 920 people in North Dakota to 457,688 people in California. It lists the state name followed by the population count. The data is formatted in a table-like structure and could be used for mapping state populations on a chart or map.
Tableau - ANAND CHOKHI DEMO - Filled Map (By Profit) Chart
This document shows profit amounts for various US states, ranging from a loss of 25,729 for Texas to a gain of 76,381 for California. Most states had profits between 100 and 33,403, with a few having losses between 1,190 and 16,971. The data is presented in a map view with labels for each state and its corresponding profit amount.
Tableau - ANAND CHOKHI DEMO - Dual Line Chart
This document contains a dual line chart showing the trends in quantity and sales broken down by region for 2011 to 2015. The chart displays the monthly quantity and sales figures for four regions - Central, East, South, and West. Color is used to distinguish the data for quantity and sales in the chart.
Tableau - ANAND CHOKHI DEMO - Dual Area Chart
This data visualization shows the total quantity and sales by month for four regions from May 2011 to November 2014, with quantity on the left vertical axis and sales on the right. The chart displays the monthly totals for quantity and sales for each region over time using different colors to distinguish the regions.
Tableau - ANAND CHOKHI DEMO - Circle View Chart
This document contains a table showing total sales figures broken down by ship date year, quarter, month and region. The data ranges from 2011 to 2014 and includes sales sums for each combination of ship date attributes. A color legend indicates which region each sales amount corresponds to.
Tableau - ANAND CHOKHI DEMO - Area(3) Bar Chart
This bar chart shows the total quantity, sales, and profit by month for order dates from 2011 to 2015. Quantity, sales, and profit amounts increased each year, with the highest amounts in 2015. The data is from a Tableau demo analyzing order metrics over multiple years.
Tableau - ANAND CHOKHI DEMO - Area Chart
This area chart shows the total sales by month from May 2011 to November 2014 for four regions: Central, East, South, and West. The chart uses color to distinguish between regions and displays the sum of monthly sales amounts over the period for each region.
Book3
The document contains two bar charts showing trends in quantity and sales over time. The first chart shows quantity and sales by month of order date from 2011 to 2015. The second chart shows quantity by quarter of order date, with regions represented by different colors. Both charts provide visual comparisons of quantity and sales metrics over time.
Book2
This bar chart shows the quantities and sales amounts for each month from 2011 to 2015, with quantity in blue and sales in orange. Quantity and sales both increased each year, with 2015 having the highest quantities and sales amounts. The chart allows comparison of the trends in quantity and sales over time.
Book1
This document contains sales and product cost data for 6 countries over a 12 month period. It shows the sales amount and total product cost for each country each month, with the values ranging from around $1 million to $10 million. The data is presented in a table with the country names as rows and the months as columns to display the monthly sales and cost figures for easy comparison across countries over time.
More from Anand Chokshi (20)
Tableau - ANAND Chokshi DEMO - Horizontol Bar Chart1
Tableau - ANAND Chokshi DEMO - Horizontol Bar Chart1
Tableau - ANAND Chokshi DEMO - Box and Whisker Plot Chart
Tableau - ANAND Chokshi DEMO - Box and Whisker Plot Chart
Tableau - ANAND CHOKHI DEMO - Circle View (By Region) Chart
Tableau - ANAND CHOKHI DEMO - Circle View (By Region) Chart
Tableau - ANAND CHOKHI DEMO - Filled Map (By Profit) Chart
Tableau - ANAND CHOKHI DEMO - Filled Map (By Profit) Chart
Annual_Sales_With_Pivot_Table
- 1. Sum of NET_SALESYear Month 2013 2012 Yearly DifferenceIn % February $23,376,674 $14,926,600 $8,450,074 56.6% March $48,510,672 $31,395,856 $17,114,816 54.5% April $74,115,826 $46,698,843 $27,416,983 58.7% May ############ $63,206,760 $36,966,928 58.5% June ############ $79,342,070 $46,518,153 58.6% July ############ $95,663,543 $56,274,350 58.8% August ############ ############ $65,729,782 58.5% September ############ ############ $65,849,982 48.0% October ############ ############ $65,365,638 40.0% November ############ ############ $45,616,411 24.1% December ############ ############ $20,193,571 9.4% January ############ ############ ($5,708,527) (-2.4%) February March April May June July August September October November December January 2013 $23,376,674 $48,510,672 $74,115,826 $100,173,688 $125,860,223 $151,937,893 $178,076,779 $203,023,273 $228,952,428 $234,878,581 $234,878,581 $234,878,581 2012 $14,926,600 $31,395,856 $46,698,843 $63,206,760 $79,342,070 $95,663,543 $112,346,997 $137,173,291 $163,586,790 $189,262,170 $214,685,010 $240,587,108 $23 $49 $74 $100 $126 $152 $178 $203 $229 $235 $235 $235 $15 $31 $47 $63 $79 $96 $112 $137 $164 $189 $215 $241 $0 $50 $100 $150 $200 $250 $300 MILLIONS YTD Sales 2013 Vs 2012 (Amount In Millions) 2013 2012 Prov. AB BC MB NB NF NS ON PEI SK ... ... Division AB... CD... EF789 GH... IJ654 KL321 ZZ999 Fre... SC Sho... Split XX... YY... ZZ... Status Old NEW Comp 0 (blank) SUPERVISOR An... Anar An... An... Hi... Ma... Ma... Ma... Niral Nu... Sa... Shi... Sm... Todd Vi... Vraj A.B. B.W. D.L. G.R.