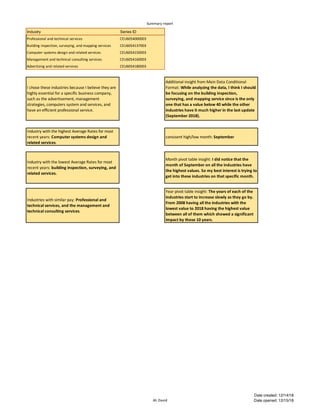
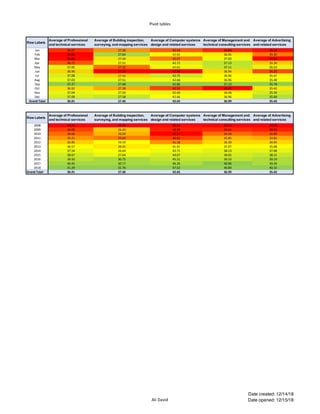
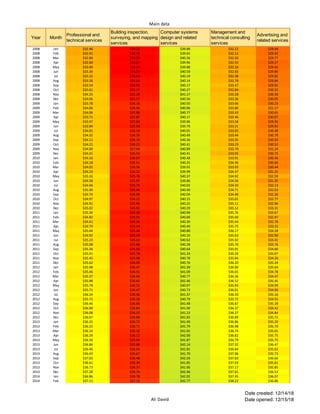
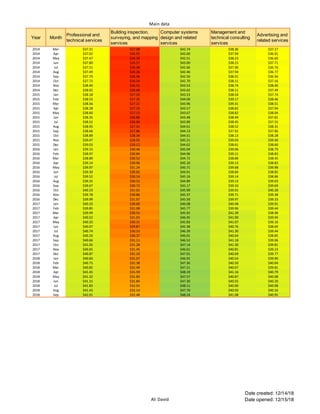
SlideShare a Scribd company logo
Summary report
Ali David
Date created: 12/14/18
Date opened: 12/15/18
Industry Series ID
Professional and technical services CEU6054000003
Building inspection, surveying, and mapping services CEU6054137003
Computer systems design and related services CEU6054150003
Management and technical consulting services CEU6054160003
Advertising and related services CEU6054180003
I chose these industries because I believe they are
highly essential for a specific business company,
such as the advertisement, management
strategies, computers system and services, and
have an efficient professional service.
Additional insight from Main Data Conditional
Format: While analyzing the data, I think I should
be focusing on the building inspection,
surveying, and mapping service since is the only
one that has a value below 40 while the other
industries have it much higher in the last update
(September 2018).
Industry with the highest Average Rates for most
recent years: Computer systems design and
related services.
consisent high/low month: September
Industry with the lowest Average Rates for most
recent years: building inspection, surveying, and
related services.
Month pivot table insight: I did notice that the
month of September on all the industries have
the highest values. So my best interest is trying to
get into these industries on that specific month.
Industries with similar pay: Professional and
technical services, and the management and
technical consulting services.
Year pivot table insight: The years of each of the
industries start to increase slowly as they go by.
From 2008 having all the industries with the
lowest value to 2018 having the highest value
between all of them which showed a significant
impact by those 10 years.
Pivot tables
Ali David
Date created: 12/14/18
Date opened: 12/15/18
Row Labels
Average of Professional
and technical services
Average of Building inspection,
surveying, and mapping services
Average of Computer systems
design and related services
Average of Management and
technical consulting services
Average of Advertising
and related services
Jan 36.67 27.36 42.54 36.84 35.18
Feb 36.59 27.64 42.65 36.95 35.30
Mar 36.60 27.44 42.57 37.00 35.16
Apr 36.72 27.51 42.72 37.13 35.39
May 37.05 27.32 42.65 37.11 35.53
Jun 36.90 27.20 42.48 36.94 35.25
Jul 37.08 27.42 42.75 36.96 35.47
Aug 37.03 27.51 42.68 36.96 35.48
Sep 37.27 27.68 42.86 37.23 35.78
Oct 36.92 27.38 42.53 36.82 35.42
Nov 37.04 27.50 42.69 36.98 35.59
Dec 37.09 27.58 42.66 36.96 35.68
Grand Total 36.91 27.46 42.65 36.99 35.43
Row Labels
Average of Professional
and technical services
Average of Building inspection,
surveying, and mapping services
Average of Computer systems
design and related services
Average of Management and
technical consulting services
Average of Advertising
and related services
2008 33.21 24.70 40.23 32.71 29.78
2009 34.09 26.20 40.39 33.41 30.50
2010 34.64 26.04 40.17 34.58 31.89
2011 35.21 25.64 40.62 35.85 33.83
2012 35.95 26.59 41.18 36.39 34.94
2013 36.57 26.41 41.91 37.07 35.88
2014 37.54 26.64 42.71 38.13 37.08
2015 38.67 27.64 44.07 38.65 38.21
2016 39.50 30.75 45.21 39.33 39.19
2017 40.45 30.77 46.26 40.96 39.36
2018 41.29 31.76 47.62 40.80 40.32
Grand Total 36.91 27.46 42.65 36.99 35.43
Main data
Ali David
Date created: 12/14/18
Date opened: 12/15/18
Year Month
Professional and
technical services
Building inspection,
surveying, and mapping
services
Computer systems
design and related
services
Management and
technical consulting
services
Advertising and
related services
2008 Jan $32.46 $24.21 $39.89 $32.22 $29.44
2008 Feb $32.41 $24.56 $39.65 $32.12 $29.42
2008 Mar $32.84 $24.26 $40.26 $32.50 $29.77
2008 Apr $32.60 $24.37 $39.96 $32.43 $29.27
2008 May $33.00 $24.30 $39.88 $32.26 $29.45
2008 Jun $33.39 $24.19 $40.59 $32.83 $29.80
2008 Jul $33.15 $24.58 $40.19 $32.38 $29.82
2008 Aug $33.26 $25.03 $40.14 $32.78 $29.84
2008 Sep $33.54 $24.91 $40.17 $33.47 $29.91
2008 Oct $33.61 $25.17 $40.27 $32.84 $30.32
2008 Nov $34.25 $25.29 $41.17 $33.28 $30.30
2008 Dec $34.06 $25.57 $40.56 $33.36 $30.05
2009 Jan $33.78 $26.16 $40.50 $33.66 $30.23
2009 Feb $34.06 $26.45 $40.96 $33.80 $31.17
2009 Mar $34.06 $25.86 $40.77 $33.43 $30.65
2009 Apr $33.71 $25.87 $40.17 $33.46 $30.07
2009 May $33.97 $25.83 $39.96 $33.58 $29.96
2009 Jun $33.84 $25.59 $39.79 $33.21 $29.93
2009 Jul $34.01 $26.19 $40.05 $33.05 $30.48
2009 Aug $34.32 $26.35 $40.49 $33.44 $30.70
2009 Sep $34.11 $26.23 $40.26 $33.35 $30.33
2009 Oct $34.21 $26.25 $40.41 $33.23 $30.52
2009 Nov $34.69 $27.04 $40.89 $33.70 $31.24
2009 Dec $34.31 $26.54 $40.41 $33.05 $30.72
2010 Jan $34.16 $26.07 $40.48 $33.91 $30.36
2010 Feb $34.18 $26.51 $40.25 $34.36 $30.66
2010 Mar $34.02 $26.56 $39.92 $33.93 $30.44
2010 Apr $34.23 $26.22 $39.99 $34.47 $31.21
2010 May $35.16 $25.76 $40.37 $34.92 $32.59
2010 Jun $34.58 $25.97 $39.86 $34.56 $31.35
2010 Jul $34.66 $25.70 $40.02 $34.33 $32.13
2010 Aug $35.00 $25.48 $40.40 $34.71 $32.63
2010 Sep $34.76 $26.04 $40.04 $34.48 $32.26
2010 Oct $34.97 $26.22 $40.15 $35.02 $32.77
2010 Nov $34.91 $25.95 $40.22 $35.11 $32.96
2010 Dec $35.02 $26.02 $40.29 $35.12 $33.31
2011 Jan $35.34 $25.20 $40.94 $35.76 $33.67
2011 Feb $34.82 $25.55 $40.60 $35.60 $32.97
2011 Mar $34.61 $25.36 $40.30 $35.44 $32.78
2011 Apr $34.79 $25.54 $40.40 $35.75 $33.15
2011 May $35.44 $25.44 $40.80 $36.17 $34.18
2011 Jun $34.92 $25.24 $40.10 $35.63 $32.90
2011 Jul $35.23 $26.03 $40.62 $35.92 $33.41
2011 Aug $35.08 $25.88 $40.28 $35.70 $33.76
2011 Sep $35.36 $25.54 $40.64 $35.91 $34.60
2011 Oct $35.91 $25.78 $41.24 $36.26 $35.07
2011 Nov $35.45 $25.98 $40.78 $35.84 $34.26
2011 Dec $35.62 $26.09 $40.76 $36.20 $35.24
2012 Jan $35.98 $26.47 $41.39 $36.80 $35.64
2012 Feb $35.46 $26.51 $41.09 $36.65 $34.78
2012 Mar $35.37 $26.64 $40.77 $36.36 $34.47
2012 Apr $35.88 $26.65 $41.46 $36.52 $35.45
2012 May $35.78 $26.52 $40.97 $35.83 $34.99
2012 Jun $35.71 $26.47 $40.73 $36.01 $34.00
2012 Jul $36.24 $26.46 $41.37 $36.33 $35.16
2012 Aug $35.71 $26.50 $40.79 $35.72 $34.55
2012 Sep $36.46 $26.66 $41.48 $36.87 $35.28
2012 Oct $36.00 $26.83 $41.00 $36.37 $34.42
2012 Nov $36.08 $26.52 $41.23 $36.37 $34.84
2012 Dec $36.67 $26.88 $41.92 $36.89 $35.72
2013 Jan $36.25 $26.72 $41.49 $36.86 $35.20
2013 Feb $36.22 $26.71 $41.79 $36.98 $35.70
2013 Mar $36.14 $26.32 $41.65 $36.74 $35.65
2013 Apr $36.29 $26.12 $42.00 $36.82 $35.75
2013 May $36.50 $25.93 $41.87 $36.79 $35.75
2013 Jun $36.84 $25.96 $42.14 $37.32 $36.47
2013 Jul $36.46 $26.54 $41.81 $36.84 $35.62
2013 Aug $36.43 $26.67 $41.70 $37.06 $35.73
2013 Sep $37.03 $26.48 $42.24 $37.63 $36.66
2013 Oct $36.61 $26.39 $41.85 $37.03 $35.61
2013 Nov $36.73 $26.37 $41.90 $37.17 $35.85
2013 Dec $37.28 $26.76 $42.46 $37.61 $36.53
2014 Jan $36.86 $26.78 $42.02 $37.45 $36.07
2014 Feb $37.21 $27.15 $42.77 $38.22 $36.86
Main data
Ali David
Date created: 12/14/18
Date opened: 12/15/18
Year Month
Professional and
technical services
Building inspection,
surveying, and mapping
services
Computer systems
design and related
services
Management and
technical consulting
services
Advertising and
related services
2014 Mar $37.31 $27.08 $42.74 $38.36 $37.27
2014 Apr $37.02 $26.92 $42.60 $37.94 $36.91
2014 May $37.47 $26.20 $42.51 $38.23 $36.60
2014 Jun $37.80 $26.57 $43.00 $38.15 $37.71
2014 Jul $37.51 $26.48 $42.66 $37.96 $36.76
2014 Aug $37.49 $26.26 $42.46 $37.94 $36.77
2014 Sep $37.70 $26.46 $42.56 $38.31 $36.94
2014 Oct $37.72 $26.54 $42.70 $38.11 $37.16
2014 Nov $38.40 $26.55 $43.53 $38.74 $38.40
2014 Dec $38.02 $26.68 $43.02 $38.11 $37.49
2015 Jan $38.18 $27.20 $43.23 $38.54 $37.74
2015 Feb $38.53 $27.35 $44.00 $39.17 $38.46
2015 Mar $38.56 $27.21 $43.96 $39.31 $38.51
2015 Apr $38.28 $27.33 $43.57 $38.82 $37.94
2015 May $38.60 $27.13 $43.67 $38.82 $38.04
2015 Jun $38.35 $26.86 $43.48 $38.49 $37.81
2015 Jul $38.52 $26.94 $43.89 $38.45 $37.55
2015 Aug $38.95 $27.41 $44.61 $38.52 $38.31
2015 Sep $38.66 $27.86 $44.13 $37.92 $37.86
2015 Oct $38.89 $28.34 $44.51 $38.13 $38.28
2015 Nov $39.47 $28.95 $45.21 $39.03 $39.40
2015 Dec $39.03 $29.12 $44.62 $38.61 $38.60
2016 Jan $39.15 $30.46 $45.04 $39.06 $38.79
2016 Feb $38.97 $30.84 $44.96 $39.11 $38.83
2016 Mar $38.89 $30.52 $44.72 $38.89 $38.45
2016 Apr $39.14 $30.96 $45.10 $39.13 $38.83
2016 May $39.97 $31.24 $45.71 $39.68 $39.98
2016 Jun $39.30 $30.65 $44.91 $38.84 $38.85
2016 Jul $39.52 $30.14 $45.16 $39.14 $38.86
2016 Aug $39.35 $30.52 $44.89 $39.13 $39.03
2016 Sep $39.67 $30.72 $45.17 $39.33 $39.69
2016 Oct $40.23 $31.02 $45.99 $39.91 $40.28
2016 Nov $39.78 $30.86 $45.37 $39.71 $39.38
2016 Dec $39.99 $31.07 $45.50 $39.97 $39.33
2017 Jan $40.33 $30.60 $46.08 $40.48 $39.91
2017 Feb $39.85 $31.08 $45.77 $39.96 $39.44
2017 Mar $39.99 $30.55 $45.92 $41.39 $38.98
2017 Apr $40.52 $31.03 $46.45 $41.90 $39.94
2017 May $40.35 $30.31 $45.83 $41.07 $39.16
2017 Jun $40.07 $29.87 $45.38 $40.76 $38.69
2017 Jul $40.74 $30.53 $46.39 $41.30 $39.44
2017 Aug $40.26 $30.37 $46.01 $40.64 $38.85
2017 Sep $40.66 $31.11 $46.52 $41.18 $39.06
2017 Oct $41.05 $31.28 $47.14 $41.30 $39.81
2017 Nov $40.65 $31.45 $46.61 $40.81 $39.23
2017 Dec $40.87 $31.10 $47.01 $40.69 $39.77
2018 Jan $40.83 $31.07 $46.92 $40.54 $39.90
2018 Feb $40.75 $31.38 $47.36 $40.50 $40.04
2018 Mar $40.82 $31.49 $47.21 $40.67 $39.81
2018 Apr $41.45 $31.59 $48.19 $41.16 $40.79
2018 May $41.32 $31.83 $47.57 $40.87 $40.08
2018 Jun $41.15 $31.84 $47.30 $40.55 $40.20
2018 Jul $41.83 $32.03 $48.11 $40.90 $40.98
2018 Aug $41.43 $32.14 $47.70 $40.93 $40.16
2018 Sep $42.01 $32.48 $48.24 $41.08 $40.95

More Related Content

Similar to Visualizing data

Barrow_Lee_DataAnalysisReporting.pdf
Barrow_Lee_DataAnalysisReporting.pdfBarrow_Lee_DataAnalysisReporting.pdf
Barrow_Lee_DataAnalysisReporting.pdf
LeeBarrow1
 
Levi Leitma Hourly Wage Comparisons in the Music Industry
Levi Leitma Hourly Wage Comparisons in the Music IndustryLevi Leitma Hourly Wage Comparisons in the Music Industry
Levi Leitma Hourly Wage Comparisons in the Music Industry
LeviLeitma
 
Data Analysis and Reporting
Data Analysis and ReportingData Analysis and Reporting
Data Analysis and Reporting
Keila Olea
 
Industry Summary Report
Industry Summary ReportIndustry Summary Report
Industry Summary Report
ChaseTodaro1
 
Data Analysis A4
Data Analysis A4Data Analysis A4
Data Analysis A4
IgorFerreira256197
 
Data Analysis Report
Data Analysis ReportData Analysis Report
Data Analysis Report
ThomasScovens1
 
A4SalomeS.pdf
A4SalomeS.pdfA4SalomeS.pdf
A4SalomeS.pdf
SalomeSaladze1
 
A4SalomeS.pdf
A4SalomeS.pdfA4SalomeS.pdf
A4SalomeS.pdf
SalomeSaladze2
 
A4SalomeSa.pdf
A4SalomeSa.pdfA4SalomeSa.pdf
A4SalomeSa.pdf
SalomeSaladze2
 
Data Analysis & Reporting - Visualizing Data
Data Analysis & Reporting - Visualizing DataData Analysis & Reporting - Visualizing Data
Data Analysis & Reporting - Visualizing Data
Full Sail University
 
Music Industry Careers
Music Industry CareersMusic Industry Careers
Music Industry Careers
MelissaMiller601538
 
A4 yolandawardanalysis
A4 yolandawardanalysisA4 yolandawardanalysis
A4 yolandawardanalysis
YolandaWard2
 
A4 yolandawardzip
A4 yolandawardzipA4 yolandawardzip
A4 yolandawardzip
YolandaWard2
 
DAR Analysis Report
DAR Analysis ReportDAR Analysis Report
DAR Analysis Report
Yao Lu
 
Hawaii Real Estate 2014 statistics trends sale report All Islands Hawaii Big ...
Hawaii Real Estate 2014 statistics trends sale report All Islands Hawaii Big ...Hawaii Real Estate 2014 statistics trends sale report All Islands Hawaii Big ...
Hawaii Real Estate 2014 statistics trends sale report All Islands Hawaii Big ...
Eric West
 
A4 finalsubmissionmapplewhite
A4 finalsubmissionmapplewhiteA4 finalsubmissionmapplewhite
A4 finalsubmissionmapplewhite
MalenaApplewhite
 
Excel Proficiency
Excel ProficiencyExcel Proficiency
Excel Proficiency
PierceAllenLux
 
Data Analysis and Reporting
Data Analysis and ReportingData Analysis and Reporting
Data Analysis and Reporting
Shantell Brooks
 
Assignment 4 dar gilberto pena
Assignment 4 dar gilberto penaAssignment 4 dar gilberto pena
Assignment 4 dar gilberto pena
gilbertoPena2
 
Financial Forecasting
Financial ForecastingFinancial Forecasting
Financial Forecasting
JamariHodges1
 

Similar to Visualizing data (20)

Barrow_Lee_DataAnalysisReporting.pdf
Barrow_Lee_DataAnalysisReporting.pdfBarrow_Lee_DataAnalysisReporting.pdf
Barrow_Lee_DataAnalysisReporting.pdf
 
Levi Leitma Hourly Wage Comparisons in the Music Industry
Levi Leitma Hourly Wage Comparisons in the Music IndustryLevi Leitma Hourly Wage Comparisons in the Music Industry
Levi Leitma Hourly Wage Comparisons in the Music Industry
 
Data Analysis and Reporting
Data Analysis and ReportingData Analysis and Reporting
Data Analysis and Reporting
 
Industry Summary Report
Industry Summary ReportIndustry Summary Report
Industry Summary Report
 
Data Analysis A4
Data Analysis A4Data Analysis A4
Data Analysis A4
 
Data Analysis Report
Data Analysis ReportData Analysis Report
Data Analysis Report
 
A4SalomeS.pdf
A4SalomeS.pdfA4SalomeS.pdf
A4SalomeS.pdf
 
A4SalomeS.pdf
A4SalomeS.pdfA4SalomeS.pdf
A4SalomeS.pdf
 
A4SalomeSa.pdf
A4SalomeSa.pdfA4SalomeSa.pdf
A4SalomeSa.pdf
 
Data Analysis & Reporting - Visualizing Data
Data Analysis & Reporting - Visualizing DataData Analysis & Reporting - Visualizing Data
Data Analysis & Reporting - Visualizing Data
 
Music Industry Careers
Music Industry CareersMusic Industry Careers
Music Industry Careers
 
A4 yolandawardanalysis
A4 yolandawardanalysisA4 yolandawardanalysis
A4 yolandawardanalysis
 
A4 yolandawardzip
A4 yolandawardzipA4 yolandawardzip
A4 yolandawardzip
 
DAR Analysis Report
DAR Analysis ReportDAR Analysis Report
DAR Analysis Report
 
Hawaii Real Estate 2014 statistics trends sale report All Islands Hawaii Big ...
Hawaii Real Estate 2014 statistics trends sale report All Islands Hawaii Big ...Hawaii Real Estate 2014 statistics trends sale report All Islands Hawaii Big ...
Hawaii Real Estate 2014 statistics trends sale report All Islands Hawaii Big ...
 
A4 finalsubmissionmapplewhite
A4 finalsubmissionmapplewhiteA4 finalsubmissionmapplewhite
A4 finalsubmissionmapplewhite
 
Excel Proficiency
Excel ProficiencyExcel Proficiency
Excel Proficiency
 
Data Analysis and Reporting
Data Analysis and ReportingData Analysis and Reporting
Data Analysis and Reporting
 
Assignment 4 dar gilberto pena
Assignment 4 dar gilberto penaAssignment 4 dar gilberto pena
Assignment 4 dar gilberto pena
 
Financial Forecasting
Financial ForecastingFinancial Forecasting
Financial Forecasting
 

More from AliDavid1998

Economics movie location
Economics movie locationEconomics movie location
Economics movie location
AliDavid1998
 
Apple watch digital marketing plan
Apple watch digital marketing planApple watch digital marketing plan
Apple watch digital marketing plan
AliDavid1998
 
Movie trends Report
Movie trends ReportMovie trends Report
Movie trends Report
AliDavid1998
 
FPS Video game event budget template
FPS Video game event budget templateFPS Video game event budget template
FPS Video game event budget template
AliDavid1998
 
Reporting to management of Gemstar Productions
Reporting to management of Gemstar ProductionsReporting to management of Gemstar Productions
Reporting to management of Gemstar Productions
AliDavid1998
 
Reporting to Management
Reporting to Management Reporting to Management
Reporting to Management
AliDavid1998
 
Marketing plan
Marketing plan Marketing plan
Marketing plan
AliDavid1998
 
Personal brand canvas
Personal brand canvas Personal brand canvas
Personal brand canvas
AliDavid1998
 
Ali david personal brand
Ali david personal brand Ali david personal brand
Ali david personal brand
AliDavid1998
 

More from AliDavid1998 (9)

Economics movie location
Economics movie locationEconomics movie location
Economics movie location
 
Apple watch digital marketing plan
Apple watch digital marketing planApple watch digital marketing plan
Apple watch digital marketing plan
 
Movie trends Report
Movie trends ReportMovie trends Report
Movie trends Report
 
FPS Video game event budget template
FPS Video game event budget templateFPS Video game event budget template
FPS Video game event budget template
 
Reporting to management of Gemstar Productions
Reporting to management of Gemstar ProductionsReporting to management of Gemstar Productions
Reporting to management of Gemstar Productions
 
Reporting to Management
Reporting to Management Reporting to Management
Reporting to Management
 
Marketing plan
Marketing plan Marketing plan
Marketing plan
 
Personal brand canvas
Personal brand canvas Personal brand canvas
Personal brand canvas
 
Ali david personal brand
Ali david personal brand Ali david personal brand
Ali david personal brand
 

Recently uploaded

一比一原版(QU毕业证)皇后大学毕业证成绩单
一比一原版(QU毕业证)皇后大学毕业证成绩单一比一原版(QU毕业证)皇后大学毕业证成绩单
一比一原版(QU毕业证)皇后大学毕业证成绩单
enxupq
 
Empowering Data Analytics Ecosystem.pptx
Empowering Data Analytics Ecosystem.pptxEmpowering Data Analytics Ecosystem.pptx
Empowering Data Analytics Ecosystem.pptx
benishzehra469
 
做(mqu毕业证书)麦考瑞大学毕业证硕士文凭证书学费发票原版一模一样
做(mqu毕业证书)麦考瑞大学毕业证硕士文凭证书学费发票原版一模一样做(mqu毕业证书)麦考瑞大学毕业证硕士文凭证书学费发票原版一模一样
做(mqu毕业证书)麦考瑞大学毕业证硕士文凭证书学费发票原版一模一样
axoqas
 
Best best suvichar in gujarati english meaning of this sentence as Silk road ...
Best best suvichar in gujarati english meaning of this sentence as Silk road ...Best best suvichar in gujarati english meaning of this sentence as Silk road ...
Best best suvichar in gujarati english meaning of this sentence as Silk road ...
AbhimanyuSinha9
 
一比一原版(CBU毕业证)卡普顿大学毕业证成绩单
一比一原版(CBU毕业证)卡普顿大学毕业证成绩单一比一原版(CBU毕业证)卡普顿大学毕业证成绩单
一比一原版(CBU毕业证)卡普顿大学毕业证成绩单
nscud
 
一比一原版(RUG毕业证)格罗宁根大学毕业证成绩单
一比一原版(RUG毕业证)格罗宁根大学毕业证成绩单一比一原版(RUG毕业证)格罗宁根大学毕业证成绩单
一比一原版(RUG毕业证)格罗宁根大学毕业证成绩单
vcaxypu
 
Jpolillo Amazon PPC - Bid Optimization Sample
Jpolillo Amazon PPC - Bid Optimization SampleJpolillo Amazon PPC - Bid Optimization Sample
Jpolillo Amazon PPC - Bid Optimization Sample
James Polillo
 
Chatty Kathy - UNC Bootcamp Final Project Presentation - Final Version - 5.23...
Chatty Kathy - UNC Bootcamp Final Project Presentation - Final Version - 5.23...Chatty Kathy - UNC Bootcamp Final Project Presentation - Final Version - 5.23...
Chatty Kathy - UNC Bootcamp Final Project Presentation - Final Version - 5.23...
John Andrews
 
tapal brand analysis PPT slide for comptetive data
tapal brand analysis PPT slide for comptetive datatapal brand analysis PPT slide for comptetive data
tapal brand analysis PPT slide for comptetive data
theahmadsaood
 
Q1’2024 Update: MYCI’s Leap Year Rebound
Q1’2024 Update: MYCI’s Leap Year ReboundQ1’2024 Update: MYCI’s Leap Year Rebound
Q1’2024 Update: MYCI’s Leap Year Rebound
Oppotus
 
一比一原版(UofM毕业证)明尼苏达大学毕业证成绩单
一比一原版(UofM毕业证)明尼苏达大学毕业证成绩单一比一原版(UofM毕业证)明尼苏达大学毕业证成绩单
一比一原版(UofM毕业证)明尼苏达大学毕业证成绩单
ewymefz
 
一比一原版(BU毕业证)波士顿大学毕业证成绩单
一比一原版(BU毕业证)波士顿大学毕业证成绩单一比一原版(BU毕业证)波士顿大学毕业证成绩单
一比一原版(BU毕业证)波士顿大学毕业证成绩单
ewymefz
 
Levelwise PageRank with Loop-Based Dead End Handling Strategy : SHORT REPORT ...
Levelwise PageRank with Loop-Based Dead End Handling Strategy : SHORT REPORT ...Levelwise PageRank with Loop-Based Dead End Handling Strategy : SHORT REPORT ...
Levelwise PageRank with Loop-Based Dead End Handling Strategy : SHORT REPORT ...
Subhajit Sahu
 
Criminal IP - Threat Hunting Webinar.pdf
Criminal IP - Threat Hunting Webinar.pdfCriminal IP - Threat Hunting Webinar.pdf
Criminal IP - Threat Hunting Webinar.pdf
Criminal IP
 
Sample_Global Non-invasive Prenatal Testing (NIPT) Market, 2019-2030.pdf
Sample_Global Non-invasive Prenatal Testing (NIPT) Market, 2019-2030.pdfSample_Global Non-invasive Prenatal Testing (NIPT) Market, 2019-2030.pdf
Sample_Global Non-invasive Prenatal Testing (NIPT) Market, 2019-2030.pdf
Linda486226
 
Adjusting primitives for graph : SHORT REPORT / NOTES
Adjusting primitives for graph : SHORT REPORT / NOTESAdjusting primitives for graph : SHORT REPORT / NOTES
Adjusting primitives for graph : SHORT REPORT / NOTES
Subhajit Sahu
 
一比一原版(UVic毕业证)维多利亚大学毕业证成绩单
一比一原版(UVic毕业证)维多利亚大学毕业证成绩单一比一原版(UVic毕业证)维多利亚大学毕业证成绩单
一比一原版(UVic毕业证)维多利亚大学毕业证成绩单
ukgaet
 
Malana- Gimlet Market Analysis (Portfolio 2)
Malana- Gimlet Market Analysis (Portfolio 2)Malana- Gimlet Market Analysis (Portfolio 2)
Malana- Gimlet Market Analysis (Portfolio 2)
TravisMalana
 
Predicting Product Ad Campaign Performance: A Data Analysis Project Presentation
Predicting Product Ad Campaign Performance: A Data Analysis Project PresentationPredicting Product Ad Campaign Performance: A Data Analysis Project Presentation
Predicting Product Ad Campaign Performance: A Data Analysis Project Presentation
Boston Institute of Analytics
 
Opendatabay - Open Data Marketplace.pptx
Opendatabay - Open Data Marketplace.pptxOpendatabay - Open Data Marketplace.pptx
Opendatabay - Open Data Marketplace.pptx
Opendatabay
 

Recently uploaded (20)

一比一原版(QU毕业证)皇后大学毕业证成绩单
一比一原版(QU毕业证)皇后大学毕业证成绩单一比一原版(QU毕业证)皇后大学毕业证成绩单
一比一原版(QU毕业证)皇后大学毕业证成绩单
 
Empowering Data Analytics Ecosystem.pptx
Empowering Data Analytics Ecosystem.pptxEmpowering Data Analytics Ecosystem.pptx
Empowering Data Analytics Ecosystem.pptx
 
做(mqu毕业证书)麦考瑞大学毕业证硕士文凭证书学费发票原版一模一样
做(mqu毕业证书)麦考瑞大学毕业证硕士文凭证书学费发票原版一模一样做(mqu毕业证书)麦考瑞大学毕业证硕士文凭证书学费发票原版一模一样
做(mqu毕业证书)麦考瑞大学毕业证硕士文凭证书学费发票原版一模一样
 
Best best suvichar in gujarati english meaning of this sentence as Silk road ...
Best best suvichar in gujarati english meaning of this sentence as Silk road ...Best best suvichar in gujarati english meaning of this sentence as Silk road ...
Best best suvichar in gujarati english meaning of this sentence as Silk road ...
 
一比一原版(CBU毕业证)卡普顿大学毕业证成绩单
一比一原版(CBU毕业证)卡普顿大学毕业证成绩单一比一原版(CBU毕业证)卡普顿大学毕业证成绩单
一比一原版(CBU毕业证)卡普顿大学毕业证成绩单
 
一比一原版(RUG毕业证)格罗宁根大学毕业证成绩单
一比一原版(RUG毕业证)格罗宁根大学毕业证成绩单一比一原版(RUG毕业证)格罗宁根大学毕业证成绩单
一比一原版(RUG毕业证)格罗宁根大学毕业证成绩单
 
Jpolillo Amazon PPC - Bid Optimization Sample
Jpolillo Amazon PPC - Bid Optimization SampleJpolillo Amazon PPC - Bid Optimization Sample
Jpolillo Amazon PPC - Bid Optimization Sample
 
Chatty Kathy - UNC Bootcamp Final Project Presentation - Final Version - 5.23...
Chatty Kathy - UNC Bootcamp Final Project Presentation - Final Version - 5.23...Chatty Kathy - UNC Bootcamp Final Project Presentation - Final Version - 5.23...
Chatty Kathy - UNC Bootcamp Final Project Presentation - Final Version - 5.23...
 
tapal brand analysis PPT slide for comptetive data
tapal brand analysis PPT slide for comptetive datatapal brand analysis PPT slide for comptetive data
tapal brand analysis PPT slide for comptetive data
 
Q1’2024 Update: MYCI’s Leap Year Rebound
Q1’2024 Update: MYCI’s Leap Year ReboundQ1’2024 Update: MYCI’s Leap Year Rebound
Q1’2024 Update: MYCI’s Leap Year Rebound
 
一比一原版(UofM毕业证)明尼苏达大学毕业证成绩单
一比一原版(UofM毕业证)明尼苏达大学毕业证成绩单一比一原版(UofM毕业证)明尼苏达大学毕业证成绩单
一比一原版(UofM毕业证)明尼苏达大学毕业证成绩单
 
一比一原版(BU毕业证)波士顿大学毕业证成绩单
一比一原版(BU毕业证)波士顿大学毕业证成绩单一比一原版(BU毕业证)波士顿大学毕业证成绩单
一比一原版(BU毕业证)波士顿大学毕业证成绩单
 
Levelwise PageRank with Loop-Based Dead End Handling Strategy : SHORT REPORT ...
Levelwise PageRank with Loop-Based Dead End Handling Strategy : SHORT REPORT ...Levelwise PageRank with Loop-Based Dead End Handling Strategy : SHORT REPORT ...
Levelwise PageRank with Loop-Based Dead End Handling Strategy : SHORT REPORT ...
 
Criminal IP - Threat Hunting Webinar.pdf
Criminal IP - Threat Hunting Webinar.pdfCriminal IP - Threat Hunting Webinar.pdf
Criminal IP - Threat Hunting Webinar.pdf
 
Sample_Global Non-invasive Prenatal Testing (NIPT) Market, 2019-2030.pdf
Sample_Global Non-invasive Prenatal Testing (NIPT) Market, 2019-2030.pdfSample_Global Non-invasive Prenatal Testing (NIPT) Market, 2019-2030.pdf
Sample_Global Non-invasive Prenatal Testing (NIPT) Market, 2019-2030.pdf
 
Adjusting primitives for graph : SHORT REPORT / NOTES
Adjusting primitives for graph : SHORT REPORT / NOTESAdjusting primitives for graph : SHORT REPORT / NOTES
Adjusting primitives for graph : SHORT REPORT / NOTES
 
一比一原版(UVic毕业证)维多利亚大学毕业证成绩单
一比一原版(UVic毕业证)维多利亚大学毕业证成绩单一比一原版(UVic毕业证)维多利亚大学毕业证成绩单
一比一原版(UVic毕业证)维多利亚大学毕业证成绩单
 
Malana- Gimlet Market Analysis (Portfolio 2)
Malana- Gimlet Market Analysis (Portfolio 2)Malana- Gimlet Market Analysis (Portfolio 2)
Malana- Gimlet Market Analysis (Portfolio 2)
 
Predicting Product Ad Campaign Performance: A Data Analysis Project Presentation
Predicting Product Ad Campaign Performance: A Data Analysis Project PresentationPredicting Product Ad Campaign Performance: A Data Analysis Project Presentation
Predicting Product Ad Campaign Performance: A Data Analysis Project Presentation
 
Opendatabay - Open Data Marketplace.pptx
Opendatabay - Open Data Marketplace.pptxOpendatabay - Open Data Marketplace.pptx
Opendatabay - Open Data Marketplace.pptx
 

Visualizing data

  • 1. Summary report Ali David Date created: 12/14/18 Date opened: 12/15/18 Industry Series ID Professional and technical services CEU6054000003 Building inspection, surveying, and mapping services CEU6054137003 Computer systems design and related services CEU6054150003 Management and technical consulting services CEU6054160003 Advertising and related services CEU6054180003 I chose these industries because I believe they are highly essential for a specific business company, such as the advertisement, management strategies, computers system and services, and have an efficient professional service. Additional insight from Main Data Conditional Format: While analyzing the data, I think I should be focusing on the building inspection, surveying, and mapping service since is the only one that has a value below 40 while the other industries have it much higher in the last update (September 2018). Industry with the highest Average Rates for most recent years: Computer systems design and related services. consisent high/low month: September Industry with the lowest Average Rates for most recent years: building inspection, surveying, and related services. Month pivot table insight: I did notice that the month of September on all the industries have the highest values. So my best interest is trying to get into these industries on that specific month. Industries with similar pay: Professional and technical services, and the management and technical consulting services. Year pivot table insight: The years of each of the industries start to increase slowly as they go by. From 2008 having all the industries with the lowest value to 2018 having the highest value between all of them which showed a significant impact by those 10 years.
  • 2. Pivot tables Ali David Date created: 12/14/18 Date opened: 12/15/18 Row Labels Average of Professional and technical services Average of Building inspection, surveying, and mapping services Average of Computer systems design and related services Average of Management and technical consulting services Average of Advertising and related services Jan 36.67 27.36 42.54 36.84 35.18 Feb 36.59 27.64 42.65 36.95 35.30 Mar 36.60 27.44 42.57 37.00 35.16 Apr 36.72 27.51 42.72 37.13 35.39 May 37.05 27.32 42.65 37.11 35.53 Jun 36.90 27.20 42.48 36.94 35.25 Jul 37.08 27.42 42.75 36.96 35.47 Aug 37.03 27.51 42.68 36.96 35.48 Sep 37.27 27.68 42.86 37.23 35.78 Oct 36.92 27.38 42.53 36.82 35.42 Nov 37.04 27.50 42.69 36.98 35.59 Dec 37.09 27.58 42.66 36.96 35.68 Grand Total 36.91 27.46 42.65 36.99 35.43 Row Labels Average of Professional and technical services Average of Building inspection, surveying, and mapping services Average of Computer systems design and related services Average of Management and technical consulting services Average of Advertising and related services 2008 33.21 24.70 40.23 32.71 29.78 2009 34.09 26.20 40.39 33.41 30.50 2010 34.64 26.04 40.17 34.58 31.89 2011 35.21 25.64 40.62 35.85 33.83 2012 35.95 26.59 41.18 36.39 34.94 2013 36.57 26.41 41.91 37.07 35.88 2014 37.54 26.64 42.71 38.13 37.08 2015 38.67 27.64 44.07 38.65 38.21 2016 39.50 30.75 45.21 39.33 39.19 2017 40.45 30.77 46.26 40.96 39.36 2018 41.29 31.76 47.62 40.80 40.32 Grand Total 36.91 27.46 42.65 36.99 35.43
  • 3. Main data Ali David Date created: 12/14/18 Date opened: 12/15/18 Year Month Professional and technical services Building inspection, surveying, and mapping services Computer systems design and related services Management and technical consulting services Advertising and related services 2008 Jan $32.46 $24.21 $39.89 $32.22 $29.44 2008 Feb $32.41 $24.56 $39.65 $32.12 $29.42 2008 Mar $32.84 $24.26 $40.26 $32.50 $29.77 2008 Apr $32.60 $24.37 $39.96 $32.43 $29.27 2008 May $33.00 $24.30 $39.88 $32.26 $29.45 2008 Jun $33.39 $24.19 $40.59 $32.83 $29.80 2008 Jul $33.15 $24.58 $40.19 $32.38 $29.82 2008 Aug $33.26 $25.03 $40.14 $32.78 $29.84 2008 Sep $33.54 $24.91 $40.17 $33.47 $29.91 2008 Oct $33.61 $25.17 $40.27 $32.84 $30.32 2008 Nov $34.25 $25.29 $41.17 $33.28 $30.30 2008 Dec $34.06 $25.57 $40.56 $33.36 $30.05 2009 Jan $33.78 $26.16 $40.50 $33.66 $30.23 2009 Feb $34.06 $26.45 $40.96 $33.80 $31.17 2009 Mar $34.06 $25.86 $40.77 $33.43 $30.65 2009 Apr $33.71 $25.87 $40.17 $33.46 $30.07 2009 May $33.97 $25.83 $39.96 $33.58 $29.96 2009 Jun $33.84 $25.59 $39.79 $33.21 $29.93 2009 Jul $34.01 $26.19 $40.05 $33.05 $30.48 2009 Aug $34.32 $26.35 $40.49 $33.44 $30.70 2009 Sep $34.11 $26.23 $40.26 $33.35 $30.33 2009 Oct $34.21 $26.25 $40.41 $33.23 $30.52 2009 Nov $34.69 $27.04 $40.89 $33.70 $31.24 2009 Dec $34.31 $26.54 $40.41 $33.05 $30.72 2010 Jan $34.16 $26.07 $40.48 $33.91 $30.36 2010 Feb $34.18 $26.51 $40.25 $34.36 $30.66 2010 Mar $34.02 $26.56 $39.92 $33.93 $30.44 2010 Apr $34.23 $26.22 $39.99 $34.47 $31.21 2010 May $35.16 $25.76 $40.37 $34.92 $32.59 2010 Jun $34.58 $25.97 $39.86 $34.56 $31.35 2010 Jul $34.66 $25.70 $40.02 $34.33 $32.13 2010 Aug $35.00 $25.48 $40.40 $34.71 $32.63 2010 Sep $34.76 $26.04 $40.04 $34.48 $32.26 2010 Oct $34.97 $26.22 $40.15 $35.02 $32.77 2010 Nov $34.91 $25.95 $40.22 $35.11 $32.96 2010 Dec $35.02 $26.02 $40.29 $35.12 $33.31 2011 Jan $35.34 $25.20 $40.94 $35.76 $33.67 2011 Feb $34.82 $25.55 $40.60 $35.60 $32.97 2011 Mar $34.61 $25.36 $40.30 $35.44 $32.78 2011 Apr $34.79 $25.54 $40.40 $35.75 $33.15 2011 May $35.44 $25.44 $40.80 $36.17 $34.18 2011 Jun $34.92 $25.24 $40.10 $35.63 $32.90 2011 Jul $35.23 $26.03 $40.62 $35.92 $33.41 2011 Aug $35.08 $25.88 $40.28 $35.70 $33.76 2011 Sep $35.36 $25.54 $40.64 $35.91 $34.60 2011 Oct $35.91 $25.78 $41.24 $36.26 $35.07 2011 Nov $35.45 $25.98 $40.78 $35.84 $34.26 2011 Dec $35.62 $26.09 $40.76 $36.20 $35.24 2012 Jan $35.98 $26.47 $41.39 $36.80 $35.64 2012 Feb $35.46 $26.51 $41.09 $36.65 $34.78 2012 Mar $35.37 $26.64 $40.77 $36.36 $34.47 2012 Apr $35.88 $26.65 $41.46 $36.52 $35.45 2012 May $35.78 $26.52 $40.97 $35.83 $34.99 2012 Jun $35.71 $26.47 $40.73 $36.01 $34.00 2012 Jul $36.24 $26.46 $41.37 $36.33 $35.16 2012 Aug $35.71 $26.50 $40.79 $35.72 $34.55 2012 Sep $36.46 $26.66 $41.48 $36.87 $35.28 2012 Oct $36.00 $26.83 $41.00 $36.37 $34.42 2012 Nov $36.08 $26.52 $41.23 $36.37 $34.84 2012 Dec $36.67 $26.88 $41.92 $36.89 $35.72 2013 Jan $36.25 $26.72 $41.49 $36.86 $35.20 2013 Feb $36.22 $26.71 $41.79 $36.98 $35.70 2013 Mar $36.14 $26.32 $41.65 $36.74 $35.65 2013 Apr $36.29 $26.12 $42.00 $36.82 $35.75 2013 May $36.50 $25.93 $41.87 $36.79 $35.75 2013 Jun $36.84 $25.96 $42.14 $37.32 $36.47 2013 Jul $36.46 $26.54 $41.81 $36.84 $35.62 2013 Aug $36.43 $26.67 $41.70 $37.06 $35.73 2013 Sep $37.03 $26.48 $42.24 $37.63 $36.66 2013 Oct $36.61 $26.39 $41.85 $37.03 $35.61 2013 Nov $36.73 $26.37 $41.90 $37.17 $35.85 2013 Dec $37.28 $26.76 $42.46 $37.61 $36.53 2014 Jan $36.86 $26.78 $42.02 $37.45 $36.07 2014 Feb $37.21 $27.15 $42.77 $38.22 $36.86
  • 4. Main data Ali David Date created: 12/14/18 Date opened: 12/15/18 Year Month Professional and technical services Building inspection, surveying, and mapping services Computer systems design and related services Management and technical consulting services Advertising and related services 2014 Mar $37.31 $27.08 $42.74 $38.36 $37.27 2014 Apr $37.02 $26.92 $42.60 $37.94 $36.91 2014 May $37.47 $26.20 $42.51 $38.23 $36.60 2014 Jun $37.80 $26.57 $43.00 $38.15 $37.71 2014 Jul $37.51 $26.48 $42.66 $37.96 $36.76 2014 Aug $37.49 $26.26 $42.46 $37.94 $36.77 2014 Sep $37.70 $26.46 $42.56 $38.31 $36.94 2014 Oct $37.72 $26.54 $42.70 $38.11 $37.16 2014 Nov $38.40 $26.55 $43.53 $38.74 $38.40 2014 Dec $38.02 $26.68 $43.02 $38.11 $37.49 2015 Jan $38.18 $27.20 $43.23 $38.54 $37.74 2015 Feb $38.53 $27.35 $44.00 $39.17 $38.46 2015 Mar $38.56 $27.21 $43.96 $39.31 $38.51 2015 Apr $38.28 $27.33 $43.57 $38.82 $37.94 2015 May $38.60 $27.13 $43.67 $38.82 $38.04 2015 Jun $38.35 $26.86 $43.48 $38.49 $37.81 2015 Jul $38.52 $26.94 $43.89 $38.45 $37.55 2015 Aug $38.95 $27.41 $44.61 $38.52 $38.31 2015 Sep $38.66 $27.86 $44.13 $37.92 $37.86 2015 Oct $38.89 $28.34 $44.51 $38.13 $38.28 2015 Nov $39.47 $28.95 $45.21 $39.03 $39.40 2015 Dec $39.03 $29.12 $44.62 $38.61 $38.60 2016 Jan $39.15 $30.46 $45.04 $39.06 $38.79 2016 Feb $38.97 $30.84 $44.96 $39.11 $38.83 2016 Mar $38.89 $30.52 $44.72 $38.89 $38.45 2016 Apr $39.14 $30.96 $45.10 $39.13 $38.83 2016 May $39.97 $31.24 $45.71 $39.68 $39.98 2016 Jun $39.30 $30.65 $44.91 $38.84 $38.85 2016 Jul $39.52 $30.14 $45.16 $39.14 $38.86 2016 Aug $39.35 $30.52 $44.89 $39.13 $39.03 2016 Sep $39.67 $30.72 $45.17 $39.33 $39.69 2016 Oct $40.23 $31.02 $45.99 $39.91 $40.28 2016 Nov $39.78 $30.86 $45.37 $39.71 $39.38 2016 Dec $39.99 $31.07 $45.50 $39.97 $39.33 2017 Jan $40.33 $30.60 $46.08 $40.48 $39.91 2017 Feb $39.85 $31.08 $45.77 $39.96 $39.44 2017 Mar $39.99 $30.55 $45.92 $41.39 $38.98 2017 Apr $40.52 $31.03 $46.45 $41.90 $39.94 2017 May $40.35 $30.31 $45.83 $41.07 $39.16 2017 Jun $40.07 $29.87 $45.38 $40.76 $38.69 2017 Jul $40.74 $30.53 $46.39 $41.30 $39.44 2017 Aug $40.26 $30.37 $46.01 $40.64 $38.85 2017 Sep $40.66 $31.11 $46.52 $41.18 $39.06 2017 Oct $41.05 $31.28 $47.14 $41.30 $39.81 2017 Nov $40.65 $31.45 $46.61 $40.81 $39.23 2017 Dec $40.87 $31.10 $47.01 $40.69 $39.77 2018 Jan $40.83 $31.07 $46.92 $40.54 $39.90 2018 Feb $40.75 $31.38 $47.36 $40.50 $40.04 2018 Mar $40.82 $31.49 $47.21 $40.67 $39.81 2018 Apr $41.45 $31.59 $48.19 $41.16 $40.79 2018 May $41.32 $31.83 $47.57 $40.87 $40.08 2018 Jun $41.15 $31.84 $47.30 $40.55 $40.20 2018 Jul $41.83 $32.03 $48.11 $40.90 $40.98 2018 Aug $41.43 $32.14 $47.70 $40.93 $40.16 2018 Sep $42.01 $32.48 $48.24 $41.08 $40.95