More Related Content
More from Anand Chokshi (20)
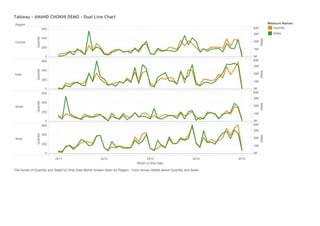
Tableau - ANAND CHOKHI DEMO - Dual Line Chart
- 1. Region
2011 2012 2013 2014 2015
MonthofShipDate
Central
East
South
West
0
200
400
600
Quantity
0
200
400
600
Quantity
0
200
400
600
Quantity
0
200
400
600
Quantity
0K
10K
20K
30K
40K
Sales
0K
10K
20K
30K
40K
Sales
0K
10K
20K
30K
40K
Sales
0K
10K
20K
30K
40K
Sales
Tableau-ANANDCHOKHIDEMO-DualLineChart
MeasureNames
Quantity
Sales
ThetrendsofQuantityandSalesforShipDateMonthbrokendownbyRegion.ColorshowsdetailsaboutQuantityandSales.