Recommended

Recommended
More Related Content
Viewers also liked
More from Anand Chokshi
More from Anand Chokshi (20)
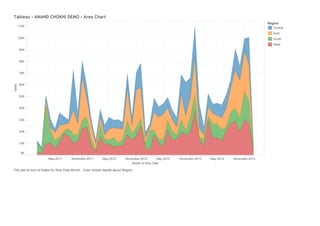
Tableau - ANAND CHOKHI DEMO - Area Chart
- 1. May-2011 November-2011 May-2012 November-2012 May-2013 November-2013 May-2014 November-2014 MonthofShipDate 0K 10K 20K 30K 40K 50K 60K 70K 80K 90K 100K 110K Sales Tableau-ANANDCHOKHIDEMO-AreaChart Region Central East South West TheplotofsumofSalesforShipDateMonth.ColorshowsdetailsaboutRegion.