Recommended

Recommended
More Related Content
Viewers also liked
Viewers also liked (13)
More from Anand Chokshi
More from Anand Chokshi (20)
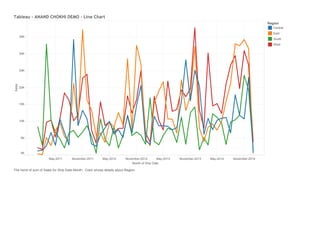
Tableau - ANAND CHOKHI DEMO - Line Chart
- 1. May-2011 November-2011 May-2012 November-2012 May-2013 November-2013 May-2014 November-2014 MonthofShipDate 0K 5K 10K 15K 20K 25K 30K 35K SalesTableau-ANANDCHOKHIDEMO-LineChart Region Central East South West ThetrendofsumofSalesforShipDateMonth.ColorshowsdetailsaboutRegion.