Download to read offline

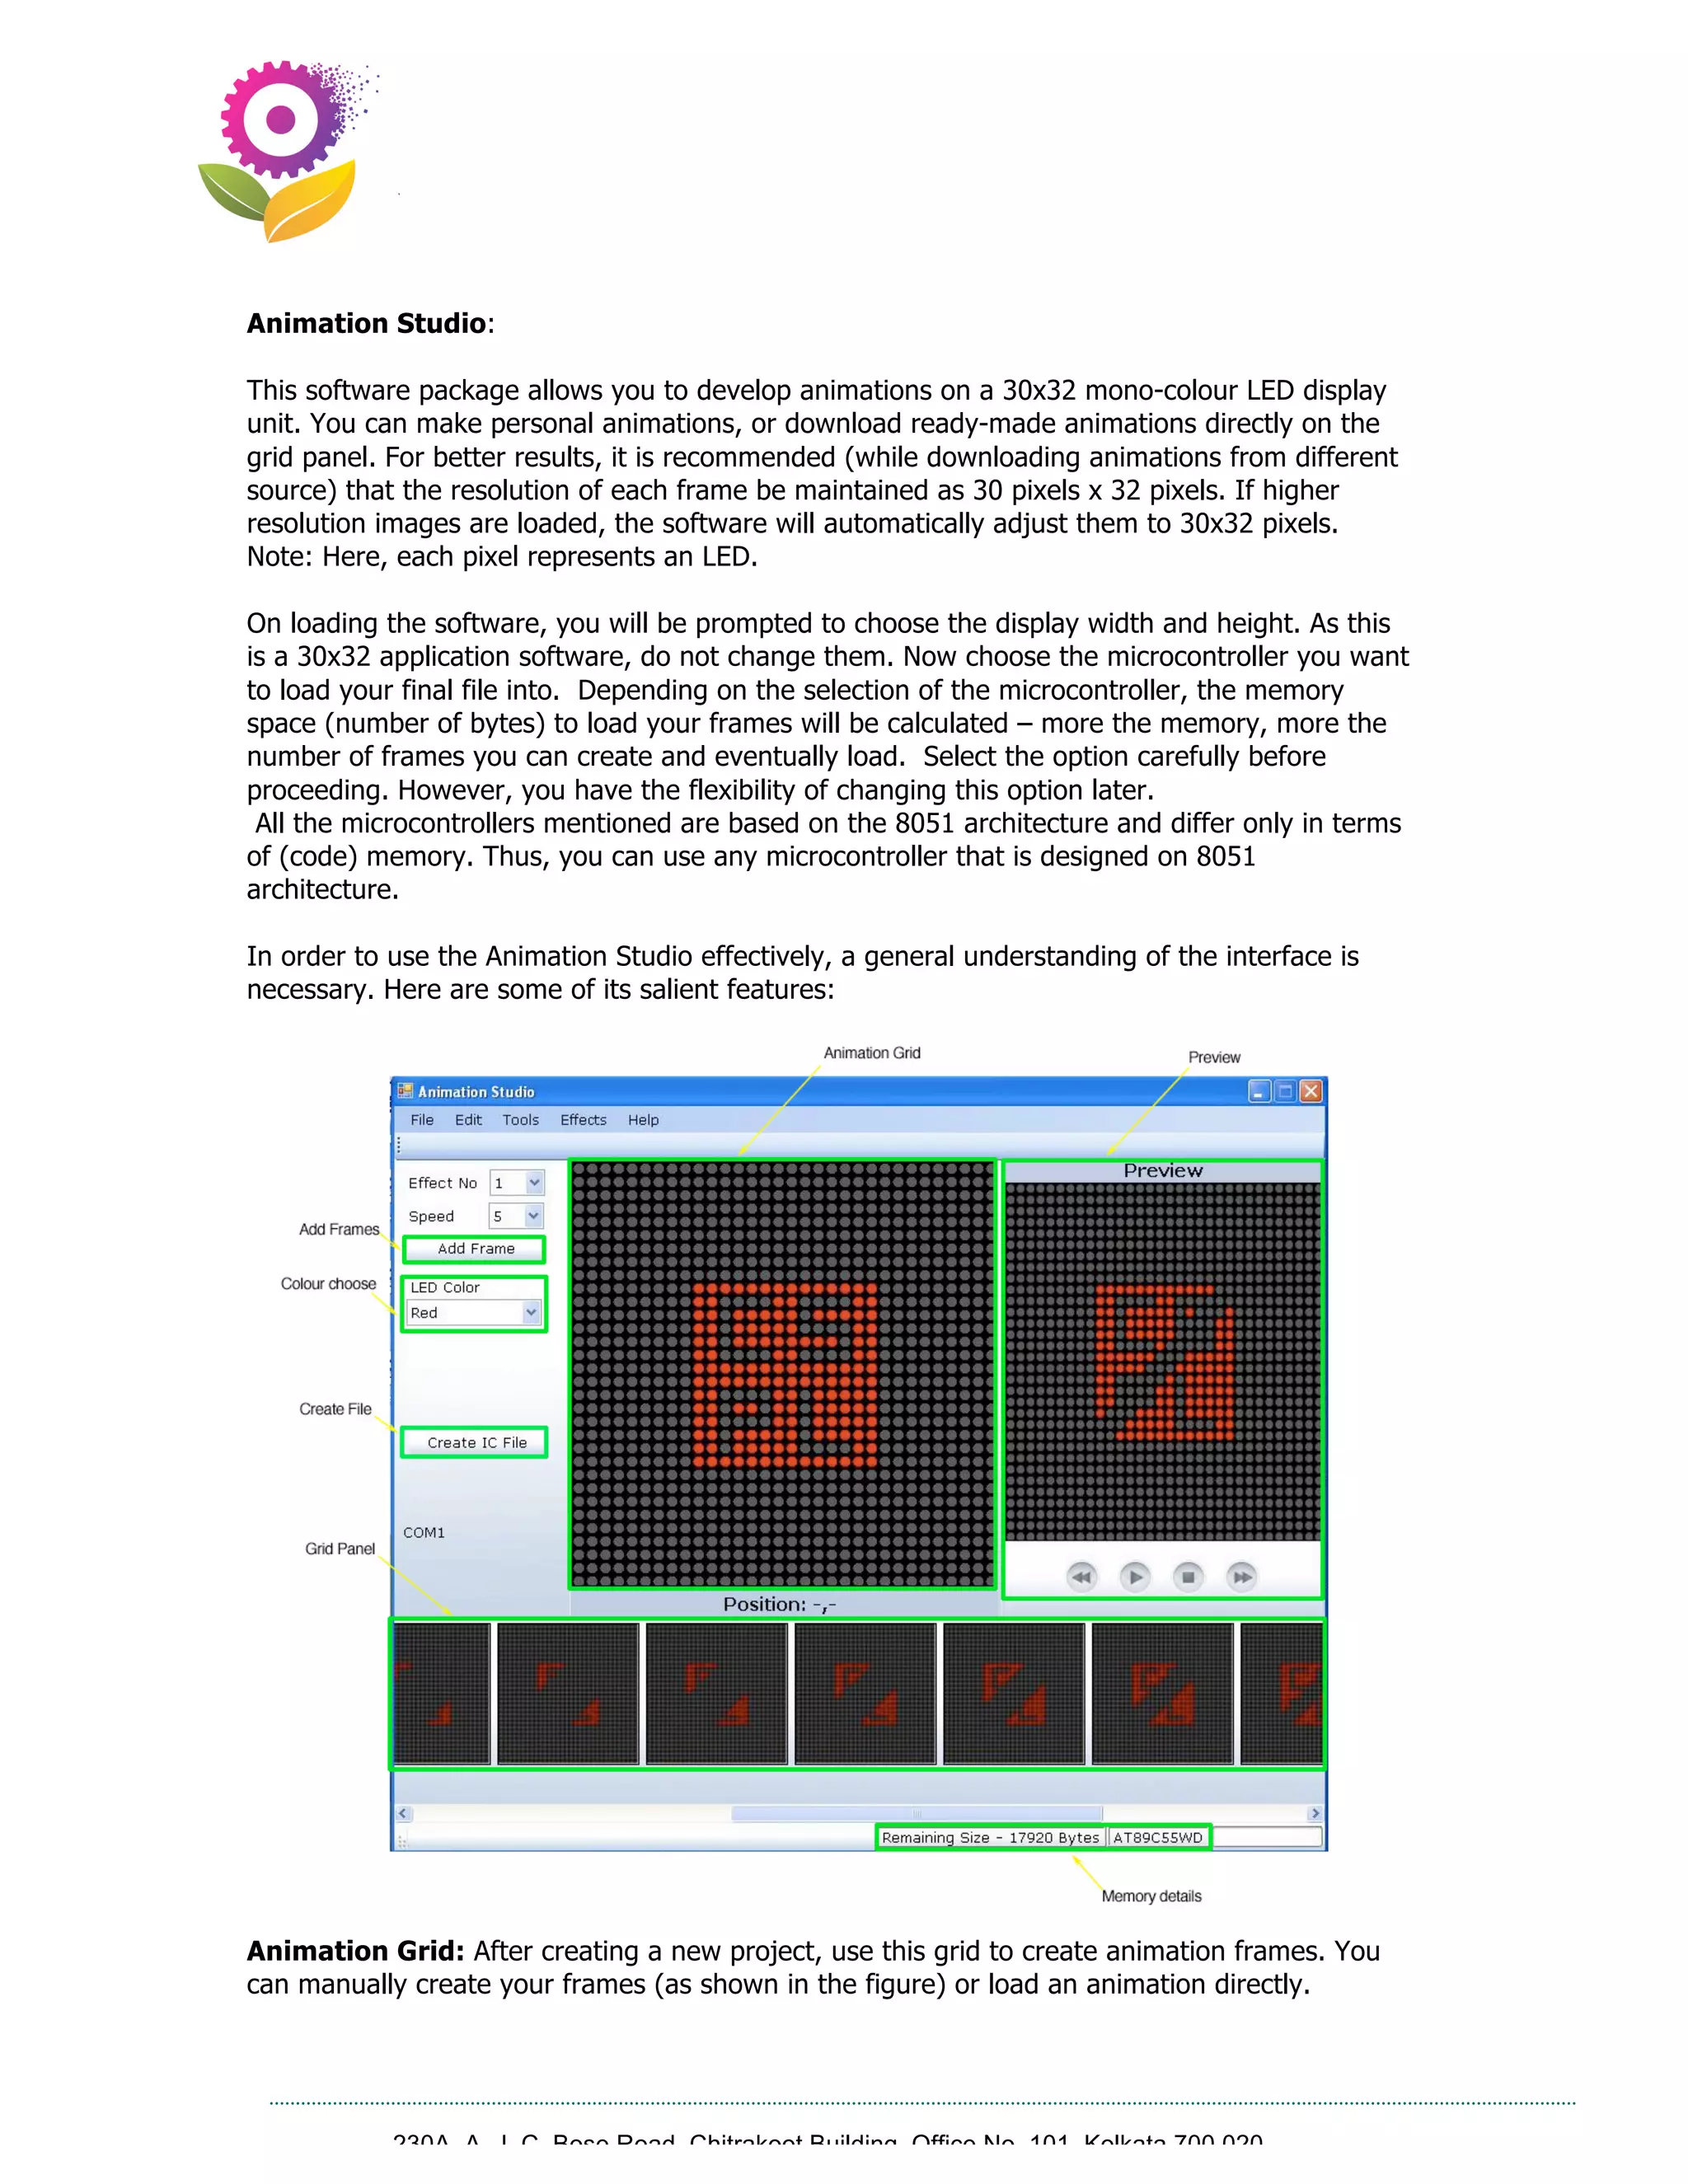
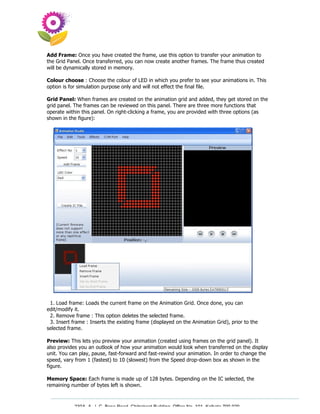
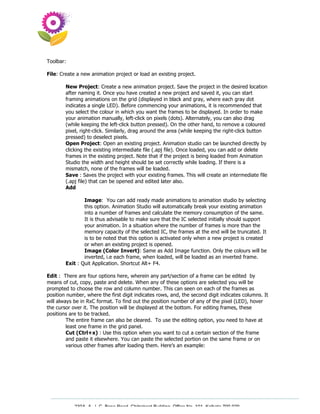
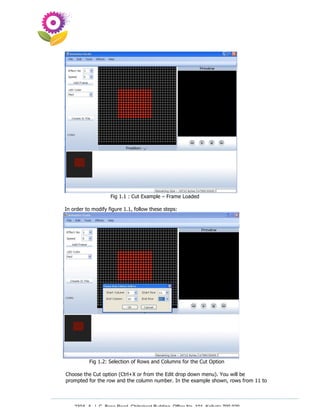
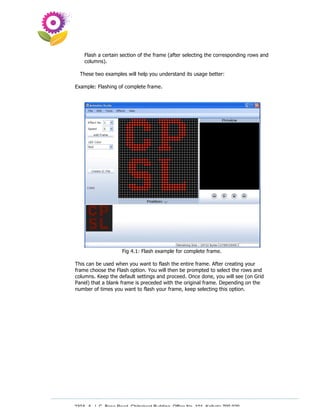
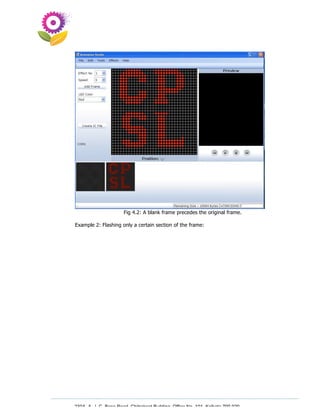
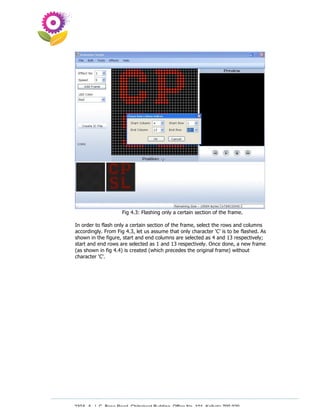
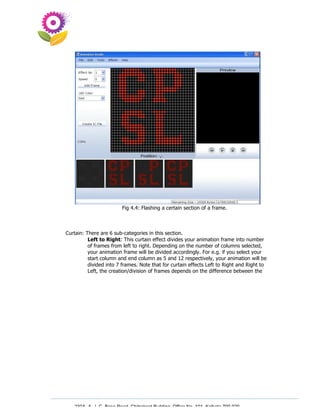
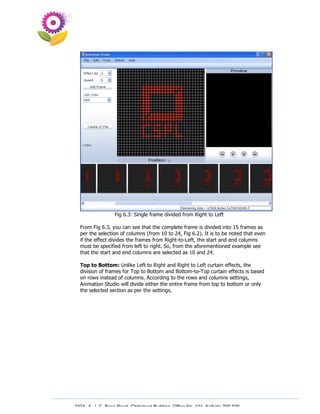
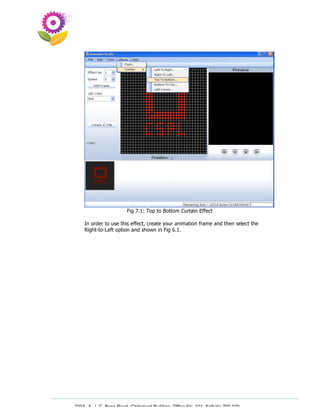
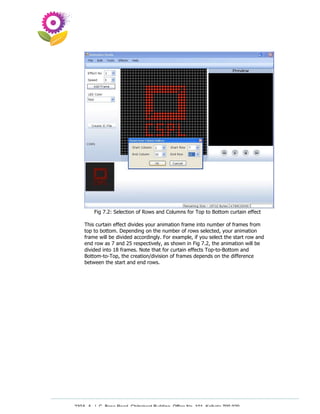
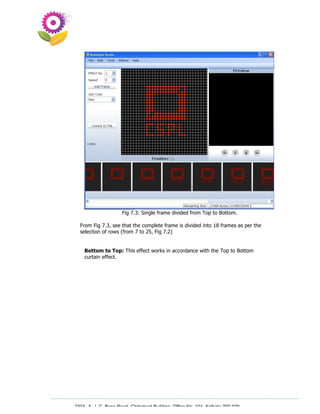

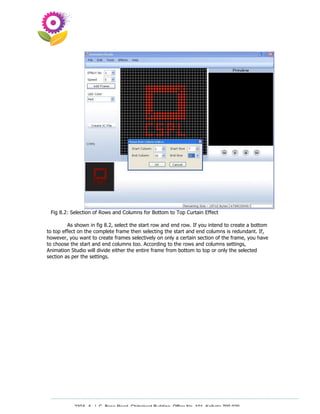
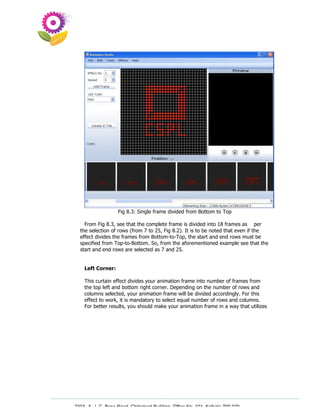
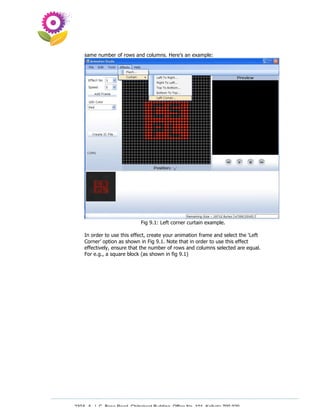
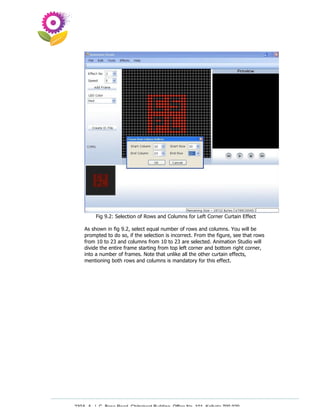
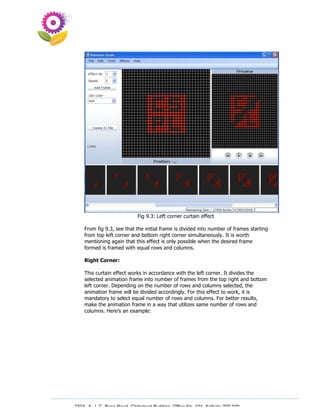


The document describes an animation studio software for creating animations on a 30x32 mono-color LED display. Users can create and load frames, adjust colors for simulation, and utilize various tools for editing and effects. It also includes features for selecting microcontrollers, saving projects, and creating binary files for hardware testing.


