Download to read offline

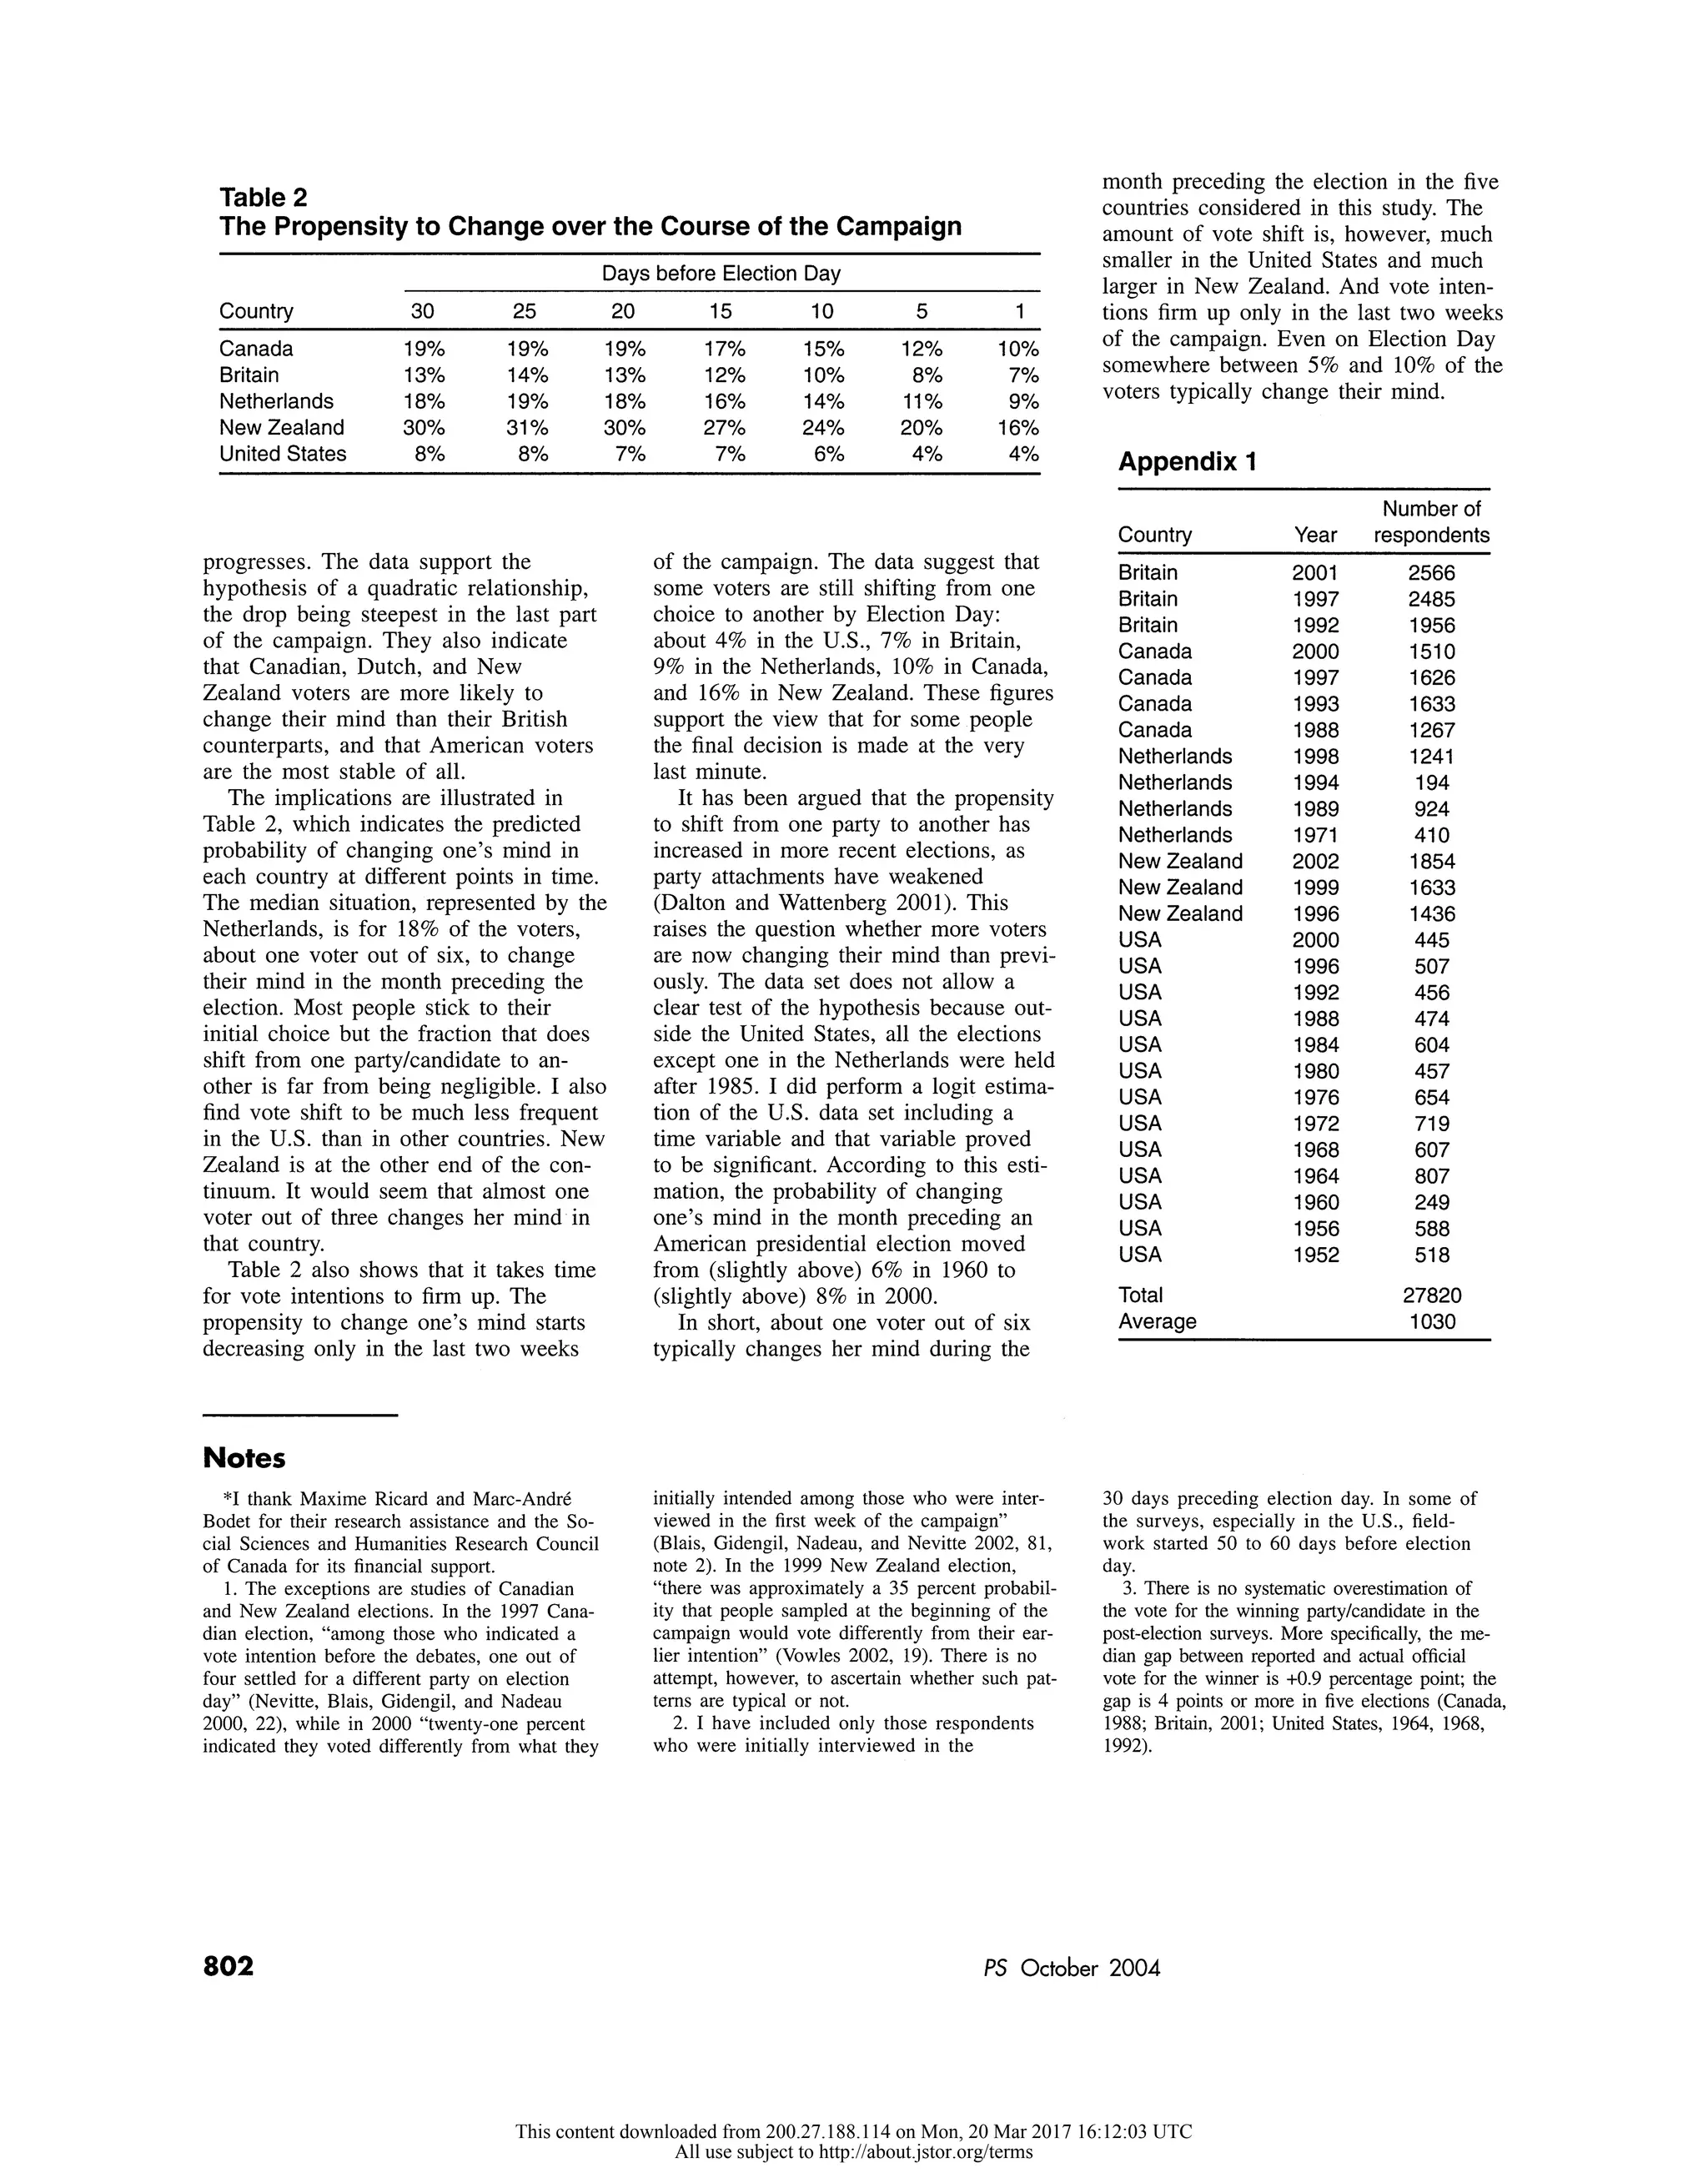

This document analyzes data from 27 election studies across 5 countries to estimate the percentage of voters who change their minds in the month before an election. It finds that on average, about 16% of voters change their preferred party between initial interviews conducted a month before the election and post-election surveys. However, rates vary significantly between countries, from about 4% of voters in the US to 30% in New Zealand. Voters are also more likely to change their minds earlier in the campaign period compared to the final weeks.


