Chapter 1
ANALYZING GROUP WORK PROCESSES:
TOWARDS A CONCEPTUAL FRAMEWORK AND
SYSTEMATIC STATISTICAL ANALYSES
Ming Ming Chiu
mingming@cuhk.edu.hk
ABSTRACT
Each action during group work has many effects, and their effects can vary over time. Thus, a
systematic analysis of group processes requires a multi-dimensional conceptual framework and
dynamic statistical tools. Past research on group work has typically focused on either cognitive or
socio-emotional aspects using coarse levels of analyses. In contrast, this chapter presents a new
framework of individual actions that combines cognitive and socio-emotional aspects. This
framework organizes each action along five dimensions. These are evaluation (agree, disagree,
ignore), knowledge (contribution, repetition, null), validity (right, wrong, unrelated) invitation
(command, question, statement), and politeness (give face, neutral, threaten face). In particular,
evaluations, repetitions, invitations and politeness link actions together to create coherent
interactions. As a result, they help measure how well a group works together. Dynamic analysis of
group processes faces at least six difficulties. First, coding difficulties reduce inter-coder reliability
and the precision of parameter estimates. Second, effects can differ for each group. Third, effects
can change over time. Fourth, we must identify time periods with stable effects. Fifth, the
outcome variables can be discrete rather than continuous. Lastly, serial correlation of the residuals
can occur. This chapter presents a new method that addresses all of these issues: multilevel Logit
with time series analyses. A study shows how group processes are modeled using this framework
and this method.
INTRODUCTION
Research as early as Shaw (1932) has shown that groups often perform better than
individuals. However, groups do not always perform better (e.g., Laughlin, VanderStoep
& Hollingshead, 1991). Why are some groups more successful than others? Earlier
Ming Ming Chiu
2
research in psychology, education, organizational behavior and sociology focused on
group structures and group member traits to explain different group outcomes.
Significant group structures include group size (Goodman, 1979; Levine & Thompson,
1996), reward structure (Slavin, 1990), problem type (E. Cohen, 1994a; Laughlin &
Hollingshead, 1995), time (Larson, Foster-Fishman, & Keys, 1994), group history
(Pavitt, Whitchurch, Siple, & Petersen, 1997) and outside constituencies (Tetlock, 1992).
Likewise significant group member traits include past achievement (Webb, 1980),
perceived ability (Liang, Moreland & Argote, 1995), personality (Boyd, 1991), peer
status (Berger et al., 1972; E. Cohen, 1984), gender (Webb, 1984; Wood & Karten, 1986)
and ethnicity (E. Cohen, 1982; Kirchmeyer, 1993).
However, these studies typically compared a priori group differences with group
outcomes. They did not examine the processes by which the a priori differences affected
the outcomes. Groups often have emergent properties that can not be reduced to their
inputs (Asch, 1952). Without examining the group processes, they can not explain how
groups with similar a priori properties produce different outcomes.
This chapter reviews past research on group processes from communication,
linguistics, psychology, education, organizational behavior, and sociology. Then, I
present a framework for analyzing group processes in detail. Lastly, I introduce a new
methodology for modeling group processes.
RESEARCH ON GROUP PROCESSES
This section discusses past research on group processes' cognitive aspects, socio-
emotional aspects and classification schemes.
Cognitive Aspects of Group Processes
A group can often solve problems that its members cannot solve alone because it can
capitalize on its members' different perspectives (Hastie, 1986; Stasser, 1992) and
distribute cognitive processing among them (Hutchins, 1995; Vygotsky, 1997). Using its
diverse sources of knowledge, a group creates more varied proposals for solutions,
increasing the likelihood that one of them is successful. With their different perspectives,
members can also use each other's ideas to spark new proposals, creatively misinterpret
them and combine them (Chiu, 1997a). Comments by one member, even the use of a
particular word, can spark a proposal from another. A person can also misinterpret
another's wrong proposal to create a correct solution serendipitously. Group members
can also create partial solutions individually and then put them together for a full
solution, an "assembly effect" (Hastie, 1986; Stasser, 1992).
When people discuss conflicting views, they can also create socio-cognitive conflicts
for one another (Asch, 1952; Doise & Mugny, 1984; Perret-Clermont, 1980; Piaget,
1952). Often, the conflicts help individuals recognize the limitations in their point of
Analyzing Group Work Processes:… 3
view. By coordinating these views, they can resolve their conflict to construct deeper
understanding (Piaget's [1952] equilibration). Consider two children, Ana and Sean.
They agree that two tall glasses have the same amount of grape juice. Ana pours all the
juice from one glass into a short, wide bowl. She then says that the wider bowl has more
juice. Sean disagrees. He argues that the taller glass has more. By pointing out the
height and width differences to one another, they can help each other understand that
these differences offset one another. Eventually, they recognize that each container has
the same amount of juice. Through cognitive conflict, Ana and Sean develop a new idea.
Groups can also distribute their cognitive processing among its members for both
efficiency and error reduction. Wegner (1987) showed that groups rely on subsets of
members to remember information related to their area of expertise, "transactive
memory." This distributed memory allows group members to use their limited memory
efficiently. Likewise, the multiple perspectives of different group members allow the
group as a whole to recognize errors more easily (Vygotsky 1997).
Socio-emotional Aspect of Group Processes
Group work promotes friendship and emotional support even among very different
people. Group work provides opportunities to work together for common goals, to get to
know one another and work as equals (Allport, 1954). Group work also creates
conditions conducive for making friends: contact, perceived similarity, and engagement
in pleasant activities (Lott & Lott, 1965). When facing daunting obstacles, members can
provide emotional support for one another to continue working.
However, group processes are not always smooth. Salomon & Globerson (1989)
showed that members may loaf, resentfully withdraw (in response to other's loafing) or
dominate group interactions. Members may also be overly aggressive/hostile (Dodge,
Asher & Parkhurst, 1989) or passive/acquiescent (Chiu, 1997b).
In addition to unproductive individual behaviors, some group processes can also
hinder effective group work. For example, group members often do not reveal important
information and fail to evaluate alternatives appropriately.
Difficulties with providing information
Group members often do not share valuable information due to unequal opportunities
to participate and concern over harm to their public self-image, or face.
Groups rarely discuss their discussion procedures to ensure equitable participation
rates (Hackman & Morris, 1975). So, each group's talk often showed a speaker hierarchy
(Bales, 1953; Stephan & Mishler, 1952). The most frequent speaker often talked much
more often than the second most frequent speaker. This difference between adjacent
ranks becomes decreasingly smaller at lower ranks (Bales, 1953; Stephan & Mishler,
1952). Differences in members' status (Fisek, Berger & Norman, 1991), perception of
Ming Ming Chiu
4
own task-related knowledge (Kerr & Bruun, 1983; Williams & Karau, 1991) and
confidence in own knowledge (Hastie, 1986; Hinsz, 1990; Sniezek, 1992) help create this
speaker hierarchy. In addition, the current speaker tends to invite recent speakers to
respond (Parker, 1988). The current speaker can designate the next speaker in several
ways, including subtle eye-contact (Burke, 1974) or an overt invitation "Nina, what do
you think?" (Barnes & Todd, 1977).
Gersick (1988) noted that groups in his study established interaction patterns quickly
at the beginning of the discussion. Without an established hierarchy, group members
engaged in status struggles to create one (Bales, 1951). Regardless of the origin of the
hierarchy, early and frequent contributors typically have more influence by winning early
converts & shaping shared knowledge (Hoffman, 1979; Kerr, 1981; Stasser & Taylor,
1991). As a result, group members lower on the hierarchy talk less and are less
influential (Bales 1951; Chiu, 2000; E. Cohen 1984; Dembo & McAuliffe 1987)
Even given the opportunity to speak, group members may fear loss of face and
withhold important information (Goffman, 1959). Someone might prove that their ideas
are wrong. As a result, they would be embarrassed. To avoid that possibility, they may
withhold new information. New ideas can also identify different positions. The different
positions encourage group members to view the members of the different positions as
ideologically different groups with corresponding negative images (Papastamou, 1986).
So, lower status members could face social retribution from higher status members for
their different positions (Chiu, 2000).
Group members with more task experience and higher status are less vulnerable to
loss of face (Brown & Levinson, 1987). So, they are more likely to share and repeat new
ideas (Wittenbaum & Stasser, 1996). Moreover, high status members, especially leaders,
can socially validate new information (Hollander, 1958, 1964). Even though new ideas
can increase personal influence (Burstein & Vinokur, 1977) through idiosyncrasy credit
(Hollander, 1958, 1964), lower status members may decide the risk is too high.
Rather than providing new information, members tend to repeat information shared
by one another (Stasser & Titus, 1985, 1987; Stewart & Stasser, 1995). First, members
have a psychological verification bias toward supporting information (Anderson, 1985).
Second, non-verbal interaction studies show that members encourage agree for one
another by spontaneously reciprocating positive affective displays, such as eye-contact
(Burgoon, Dillman & Stern, 1993). As a result, members often repeated shared
information to create common ground and solidarity (Clark & Brennan, 1991).
Discussions that focus on shared information typically lead to a consensus decision,
raising members' confidence and commitment to the group's decision (Sniezek, 1992).
This phenomenon occurs more often in new and ad-hoc groups and less often in regular,
stable groups with experienced members (Wittenbaum & Stasser, 1996).
As members favor shared rather than new information, they often fail to recognize
superior alternatives. Consider the following situation. Each group member has part of a
superior alternative, a.k.a. "a hidden profile" (Stasser & Titus, 1985). To recognize the
superior alternative, each member must share his or her part. Studies have shown that
many group members do not, so the group fails to recognize the superior alternative
(Stasser & Stewart, 1992; Stasser & Titus, 1985).
Analyzing Group Work Processes:… 5
Difficulties with coordinating different views
If group members reveal all their information, the groups often choose the optimal
solution (if there is one –"truth wins" [Laughlin, 1999]). However, they do not always do
so. Correct member can have difficulty persuading others of the correct solution. Or,
groups can use inappropriate methods for choosing among alternatives.
Laughlin and Hollingshead (1995) identified 4 conditions for demonstrating a correct
idea. They are (a) group consensus on a conceptual system, (b) sufficient information, (c)
other members' ability to recognize a correct idea and (d) sufficient correct member
ability, motivation and time to persuade other members that the answer is correct.
Laughlin and Ellis (1986) further argued that the number of group members necessary
and sufficient for a collective decision is inversely proportional to the demonstrability of
the proposed solution. One person is enough on eureka/insight problems (Shaw, 1932),
remote verbal associations and most math problems. Two people ("truth-supported")
suffice on world knowledge such as vocabulary, analogies and general information
(Hastie, 1986). However, a majority or more are needed for choice dilemmas, evaluative
attitudinal judgments, preferences for bets/gambles and mock jury decisions.
Faced with several alternative, groups do not always try to determine the correct one.
Laughlin and Hollingshead (1995) also identified three alternatives for resolving conflicts
in addition to "create new alternative," "truth wins," and "truth-supported wins." They are
voting, turn-taking and random selection among alternatives. As a majority vote can be
the final arbitrator, group members may strategically adapt their talk. They tend to
support majority positions and avoid support for minority positions (Kerr & Watts, 1982).
The influence of the majority depends on several factors. These include majority and
minority sizes, the extremity of the majority position, the minority response mode
(private vs. public) and the type of decision (see review by Levine & Thompson, 1996).
CLASSIFICATION SCHEMES FOR GROUP PROCESSES
Past researchers focusing on group members' behaviors have classified them in
several ways. These include discussion phases, individual roles and strategies. Earlier
researchers used classification systems based on discussion phases (Bales & Strodtbeck,
1951; Hirokawa, 1983). Examples of phases include (a) discuss problem, (b) discuss
criteria, (c) propose solutions and (d) evaluate proposals. However, groups do not
proceed through phases in a regular manner (Hirokawa, 1983; Poole, 1981). Other
researchers have used role classifications (E. Cohen, 1994b; Kagan, 1992). Roles
include proposer, supporter, critic and facilitator. Other researchers focus on specific
strategies (Barnes & Todd, 1977; Cazden, 1988; Forman & Cazden, 1984; Slavin, 1990).
Examples of strategies include proposing new ideas, justifying, identifying weaknesses,
inviting participation, etc. During each discussion phase, group members play different
roles and use particular strategies. During the proposal phase, a proposer suggests new
ideas. During the evaluation phase, supporters and critics evaluate it, seeking advantages
Ming Ming Chiu
6
and disadvantages. A supporter tries to justify the claim and elaborate it. In contrast, a
critic challenges the original claim and identifies weaknesses. Meanwhile, a facilitator
invites participation, monitors the group's progress, etc.
With a single action however, a person can perform many functions to satisfy several
goals simultaneously. Consider, for example, the following conversation segment:
Jose: Six times two is ten.
Eva: Isn't six times two equal to twelve?
Eva performs many roles and uses several strategies. Simultaneously a critic, a proposer
and a facilitator, she criticized the previous action ("isn't") by contributing an alternate
proposal ("six times two equal to twelve") in the form of a question (?) to soften the
criticism and invite evaluation. Thus, neither roles nor strategies form a mutually
exclusive and exhaustive classification system. Likewise, multi-function actions also
render single function phase schemes unworkable. A systematic analysis of individual
behaviors during group processes must explain the simultaneous multiple functions of a
single action.
A FRAMEWORK FOR INDIVIDUAL ACTIONS
As discussed earlier, "isn't six times two equal to twelve?" includes an evaluation
(criticism), knowledge content (a new contribution), and an invitation for others to
participate (question). It also includes politeness and validity dimensions. In this section,
I explicate these five dimensions and show how they display interactive relationships
among speakers.
Dimensions of Individual Actions
Building on the research discussed above, I propose that all individual actions include
the following dimensions: (a) evaluation of the previous action, (b) politeness, (c)
knowledge content, (d) validity and (e) invitational form. In this article, an individual
action is a sequence of one person's words, motions, and/or drawings bracketed by pauses
or falling intonations (in the case of words). Three examples of actions follow: (a) "what
do we do next?" (b) shrugs his shoulders and (c) writes "3 x 5 = 15" on a sheet of paper.
Evaluations
Unlike most interactions previously studied in fine-grained detail such as narratives
(Schegloff, 1997) or initiation-reply-evaluation (Mehan, 1979), group problem solving
often involves mutually-contested information that highlight the importance of
Analyzing Group Work Processes:… 7
evaluations. Because every problem solving action can be challenged, group members
evaluate, at least implicitly, every speaker turn during group problem solving. The
evaluation of the previous action dimension characterizes how the current speaker
assesses the previous action and the current problem solving trajectory (Goodwin &
Goodwin, 1987; Pomerantz, 1984) in one of three ways: agree, disagree, and ignore.
After a person proposes an idea (for example, “two hours times six miles per hour is
ten"), one can agree it entirely (+), reject at least part of it (-), or ignore it (0).
Agreements (+) include acknowledgments ("yep"), justifications ("cause it only
moves for two of the four hours"), criticisms of alternatives ("times four hours assumes
it's always moving"), etc. Agreements tend to reinforce the direction of the current
problem solving approach (Sacks, 1987). Moreover, they promote friendly social
relationships through positive social face (Brown & Levinson, 1987), especially if the
participants invest themselves in their ideas.
Disagreement (-) identify errors ("twelve, not ten"), suggest related alternatives
("how about four hours times six?") or challenge the previous proposal ("why two
hours?"). Disagreements tend to alter the problem solving trajectory by identifying flaws
and developing alternatives. In addition, cognitive rejection of the idea can threaten
psychological rejection of the person, especially without accompanying face-saving
measures (Brown & Levinson, 1987).
Ignoring or Unresponsive (0) actions do not evaluate the proposal at all and initiate
new topics ("do we have a quiz tomorrow?"). Unresponsive actions draw the
conversation away from the previous speaker's solution approach and may threaten social
relationships. Unlike disagreements, unresponsive actions do not acknowledge the
previous speaker, which in some contexts suggest that his or her proposal was unworthy
of comment. So, if group members frequently respond to one person's unresponsive
actions (to initiate new topics), their behaviors show that person's greater authority and
control over the group.
Some actions seem both responsive and neutral. For example, "let me think about
that for a moment" and "finish your proposal first" seem like neutral evaluations because
they postpone evaluation. When Chiu's (2000) high school students worked together
however, they typically responded to seemingly neutral evaluations in the same way they
responded to disagreements; they tried to persuade the neutral person. Neutral
evaluations do not support the previous speaker's proposal. So, other members treated
neutral evaluations as disagreements. Unlike disciplined members of structured decision-
making processes, these members tended to agree or disagree quickly rather than
listening to a variety of proposals before judging the merits of each. For skilled
collaborators, an additional "neutral" category may be appropriate.
Politeness
Conversation participants seek to maintain a desirable public self-image or "face"
(Goffman, 1959) and use an appropriate level of politeness to do so (Brown & Levinson,
1987). The politeness dimension characterizes the speaker's attempt to affect the face of
Ming Ming Chiu
8
others. It ranges from face-promoting to neutral to face-threatening. Face-promoting
(☺) actions improve the public self-image of others, "yes, two times six is right, giving us
twelve," (a face-promoting disagreement). So, group members may use face-promoting
actions to show respect, build friendship and minimize interpersonal conflicts. In
contrast, face-threatening ( ) actions are impolite, "can't you even multiply two and six
correctly to get twelve?" Unless the speakers are close friends, face-threatening acts
signal psychological rejection of the person. So, listeners are tempted to reciprocate. If
they do, a spiral of face-threatening actions can tear the social fabric and end the
collaboration. Lastly, face-neutral ( ) actions do not strongly affect others' faces, "two
hours times six miles per hour is twelve miles."
Several factors affect the level of politeness used. These factors include relative
power, social distance and degree of imposition (Brown & Levinson, 1987). A speaker
typically addresses a more powerful listener politely; for example, secretaries usually
speak politely to their bosses. So, speaker's level of politeness may reflect the existing
status hierarchy or help create it during a status struggle (Bales, 1951). In the absence of
a clear status hierarchy, speakers may use impolite behavior to stake a claim to higher
status. Also, socially distant people, such as strangers, tend to speak in polite formalities.
In contrast, close friends are less likely to be so polite (Schiffrin, 1984). They may even
use face-threatening acts playfully (e.g., ritualistic insults [Goodwin, 1990]). Lastly,
speakers often use polite language when imposing on the listener in some way, for
example, asking for a favor.
Knowledge
The knowledge content dimension characterizes the problem knowledge displayed
during the interaction and includes at least three possibilities: contribution, repetition, and
null content. Contributions (C) are new problem solving ideas or actions introduced into
the collaboration. They can be wrong and hence indicate moments of potential problem
solving progress. Contributions include new goals, proposals, justifications,
consequences, critiques, alternatives, etc. Tracing the contributions provides a map of the
group's problem solving route. Meanwhile, repetitions (R) repeat the knowledge content
of previous actions, not necessarily the immediately preceding action (Schegloff, 1996).
Repetitions can indicate the speaker's level of understanding and degree of agreement.
Finally, null content actions (N) do not include any problem content. They include
acknowledgments ("mm-hmm"), simple evaluations ("no"), and general questions
("what?"). Because null actions are often brief, they can serve as back channel actions
that provide feedback without interrupting the current speaker. (Null actions can be
repeated, but they remain null actions, as repetitions repeat problem solving information.)
The continuum of problem knowledge content runs through non-overlapping
contributions, overlapping contributions, synonymous repetitions, partial repetitions,
exact repetitions, and null actions. Consider each type of knowledge content in response
to the phrase "two hours times six miles per hour." A non-overlapping contribution
provides problem information without repeating any part of any previous action, for
Analyzing Group Work Processes:… 9
example, “distance." In contrast, an overlapping contribution combines new information
with information from a previous action, "so the train moves twelve miles in two hours."
Repetitions include substantial reiteration of a previous action. Synonymous repetitions
restate previous actions, "two hours multiplied by six miles per hour." Meanwhile, partial
and exact repetitions repeat part or all of a previous action precisely, "two times six"
(partial) and "two hours times six miles per hour" (exact). Null actions contain no
problem content ("uh-huh").
Validity
The validity dimension identifies an action as correct, wrong, or off-task. To the
extent that a task is intellectual rather than judgmental, external observers can identify a
group member's action as right or wrong. This identification process is much simpler for
mathematical problems. All actions that include some part of the problem and are
consistent with both the problem situation and with formal mathematics are coded as
correct (√). Groups that solve the problem correctly should have a substantial portion of
correct actions. All actions that are inconsistent with either the problem situation or with
formal mathematics are coded as wrong (X). Finally, actions that are unrelated to the
problem situation are coded as off-task (OT). This dimension identifies the relative
accuracy of particular groups, individuals or talk during particular time periods. This
dimension also helps distinguish between unsuccessful groups that made critical errors
and those that were primarily off-task.
Invitation to participate
The invitational form dimension encourages participation from the audience to
different degrees and also includes at least three possibilities: statements, questions, and
commands. Statements (_.) declare information unintrusively without eliciting
participation from others, “five times seven is thirty-four." In contrast, questions (?) invite
audience participation somewhat intrusively by articulating an action/information gap for
hem to fill, thereby requesting an action, problem information and/or an evaluation.
Finally, commands (!) demand audience participation. Typical commands begin with
verbs (with the audience as the implicit subject), "multiply two times six!"
These three forms invite varying degrees of interaction within each property as well.
Statements (_.) vary from low to high interactivity in the following ways: definitive vs.
uncertain and summary vs. goal. Definitive statements discourage further discussion of
what the speaker perceives to be a known truth ("two times six is twelve") while
uncertain statements encourage input on the validity of the statement ("two times six
seems like twelve"). Likewise, summary statements tend to close interactions by
articulating what the group has already accepted ("so we got twelve miles by multiplying
two hours and six miles per hour") whereas goal statements encourage interaction by
presenting a target towards which the group can work ("we need to find the distance"). In
Ming Ming Chiu
10
short, definitive summaries, definitive goals, uncertain summaries, and uncertain goals
are all statements, but invite increasing audience participation.
Rhetorical, tag, choice, open, and directive questions (?) also invite different degrees
of interaction. Although the form of a rhetorical question invites responses ("can't you do
anything right?"), the speaker knows the answer and does not expect a response. Tag
questions follow statements and anticipate simple acknowledgments, "two times six is
twelve, right?" Meanwhile, choice questions offer multiple possibilities from which the
audience can select, "should we add or multiply?" When speakers ask open questions,
they do not restrict the answers and invite a greater variety of responses, "what should we
do next?" Finally, directive questions expect audience implementation of a proposal, "can
you compute the speed?" Rhetorical, tag, choice, open, and directive questions invite
successively greater degrees of interaction.
Finally, people can invite different degrees of participation using open, closed or halt
commands (!). Open commands request general input from the audience, "give me your
opinion," whereas closed commands specify particular actions, "measure the length of the
box." Although most commands demand audience action, halt commands demand
audience inaction, for example, “wait!" As a result, halt commands are less invitational
than statements as they discourage participation. Halt commands disagree (-) and have
null knowledge content (N) that distinguish them from other commands (!). So, they can
be analyzed as a separate unit (-N!). Open and detailed commands demand audience
participation, but halt commands demand audience inaction.
Collaborators invite audience participation in increasing degrees from halt commands
to statements to questions to non-halt commands.
Interactive Properties of Individual Actions
The evaluation, politeness, knowledge content, and invitational form dimensions
capture interactive properties. Because evaluations look backward into the past at the
previous utterance, they help glue together individual actions to form a coherent
conversation. Collaborations in which participants are highly responsive toward one
another have more evaluations (supportive [+] or critical[-]). Meanwhile, speakers often
reciprocate politeness levels to reflect their social relationships. While contributions help
trace the group's problem solving paths, repetitions of other speakers display areas of
perceived-shared understanding (Halliday & Hasan, 1976). The invitational form
dimension mirrors the evaluation dimension and projects forward into the future by
inviting audience participation to different degrees. Together, evaluations, politeness
levels, repetitions and invitational forms link adjacent actions to help create coherent
interactions and allow quantitative tests of collaboration quality.
2.4 Relating roles, strategies and individual actions
This classification captures the simultaneous multiple effects of an individual action
that theoretical constructs such as roles and strategies can not. To explicate the
relationship between individual actions, roles and strategies (see Table 1), recall my
Analyzing Group Work Processes:… 11
earlier discussion in the
Table 1. Relationships between collaboration roles, strategies, and individual actions. Each role includes
particular strategies that collaborators can implement through specific actions.
Role Strategy Individual Action
Proposal New Idea Contribution (C)
Supporter Show Benefits Supportive Contribution (+C)
Elaborate Idea Supportive Contribution (+C)
Critic Show Flaws Critical Contribution (-C)
Alternative Idea Critical Contribution (-C)
Facilitator Invite participation Question (?)
Command (!)
Monitor progress Agree (+)
Disagree (-)
Softening criticism Disagreeing politely (-☺), disagreeing via a question
(-?), or both (-☺?)
Balance support and
criticism
Adjacent Agreements (+) and Disagreements (-)
introduction. Roles include proposer, supporter, critic and facilitator. A proposer can
suggest new ideas through contributions (C). In response, supporters can show their
benefits and elaborate them with supportive contributions (+C). Critics can show flaws
and provide alternatives with critical contributions (-C). A facilitator can invite
participation through questions (?) and commands (!) and monitor group progress
through supportive (+) and critical (-) evaluations. To promote group harmony,
facilitators can balance adjacent supportive and critical actions (+ and -) and soften a
disagreement by promoting face (-☺) or by asking it as a question (-?).
Application of Framework
This multi-dimensional framework organizes 243 (35
) mutually exclusive and
exhaustive categories. So, researchers can use it for standard statistical analyses. For
example, Chiu (2000) used parts of it to examine the effects of status at the group,
Ming Ming Chiu
12
individual and turn levels. At the group level, he estimated the effects of the group's
actions (along with status and other variables) on solution score. In particular, he showed
that average mathematics grade, face promoting criticisms (-☺, % of total criticisms) and
correct actions (%) predicted solution score. However, contributions (%) and repetitions
(%) did not.
At the individual level, Chiu (2000) estimated predictors of perceived leadership. He
showed that social status positively predicted perceived leadership. Meanwhile, the
individual ratio of face-promoting to total criticisms negatively predicted it. However,
correct actions (%), contributions (%), and repetitions (%) did not.
Lastly, he tested evaluation distortions using lagged variables to predict agreement (at
time T) of the previous speaker turn (at time T-1). He found that the previous turn's
correctness (at T-1) predicted agreement (at T). However, the previous speaker's
mathematical grade (at T-1) and social status (at T-1) both positively distorted the
evaluation. This turn level analysis had several shortcomings addressed by the new
methodology described below
A NEW STATISTICAL METHOD: DYNAMIC MULTILEVEL LOGIT
This section outlines a statistical method that addresses the problems that often occur
during analyses of group processes (see Chiu & Khoo [2000] for details). This method
combines multilevel analysis, a discrete outcome variable (Logit), break point estimation
and time-series analysis.
Difficulties During Analyses of Group Processes
Statistical models of group processes at the speaker turn/utterance level are
problematic in at least six ways.
1) Coding difficulties reduce both inter-coder reliability and the precision of
parameter estimates.
2) Data is often collected from different groups (group heterogeneity). So, each
group can show different effects (Goodman, Ravlin & Schminke, 1987).
3) Group members' behaviors at the beginning of a problem solving session can
differ from those at the end, a.k.a. time period heterogeneity (Dabbs & Ruback,
1987). Thus, each time period can show different effects (Goodman et al., 1987).
4) Deciding how to divide each session into different time periods is difficult. The
number and locations of "break points" in a session must be estimated.
5) The outcome variables (e.g., correctness, agreement) are often discrete rather
than continuous.
6) Time series data is often serially correlated − variables depend on values from
earlier turns. If not modeled properly, serial correlation in the errors can bias the
Analyzing Group Work Processes:… 13
model estimates.
Past Methods
Past studies have not addressed all of these difficulties. Those studies typically used
one of three methods: case studies, sequential analysis and/or ordinary least squares
(OLS) regressions. Each of these methods has significant problems and restrictions.
During exploratory pilot studies with a few groups, detailed case studies can provide
useful insights. However, case studies can not test the generality of hypotheses across
many groups. Some researchers have used sequential analyses of Markov chains
(Gottman & Roy, 1990; Pavitt & Johnson, 1999; Stasser & Davis, 1981). Standard
sequential analyses assume that the outcome variable be homogeneous across both
groups and time periods (Gottman & Roy, 1990). However, these assumptions are often
violated. Groups often differ. Effects can change over time. Other researchers simply
used OLS (e.g., Chiu, 2000), ignoring problems 2 to 6 and obtaining inefficient and
biased estimates.
This article briefly discusses coding before introducing a new statistical method that
addresses all of the above difficulties. Then, I re-analyze Chiu (2000)'s data for more
precise estimates of evaluation distortion.
Coding The Dimensions Of Group Processes
The usefulness of any statistical analysis depends on the quality of the coding
scheme. A coding framework for statistical analyses of group processes should have
mutually exclusive and exhaustive categories. These categories should both cover all the
relevant data and capture their complexity. However, the complexity of these coding
schemes often reduces inter-coder reliability and precision of parameter estimates. Multi-
dimensional coding schemes address these difficulties.
Complex coding scheme difficulties
A complex coding scheme with mutually exclusive and exhaustive categories often
includes many categories. The large number of categories can contribute to lower inter-
rater reliability. As the number of codes rises, training time, coding time and coding
conflicts also tend to rise. Coding conflicts reduce the inter-coder reliability.
Moreover, the large number of categories can also reduce statistical precision. Creating a
model with N categories of behaviors typically requires N-1 binary variables (for
explanatory variables). Models with more explanatory variables also have fewer
available degrees of freedom. Using a model with excessive variables can sharply reduce
the precision of the parameter estimates. Such models are also more likely to have multi-
collinearity, especially among variables for categories of rare behaviors. Both excessive
explanatory variables and multi-collinearity can reduce the precision of the estimates.
Ming Ming Chiu
14
Multi-dimensional coding
A coding scheme with many dimensions can capture the data's complexity. At the
same time, it can avoid sharp falls in inter-coder reliability and parameter estimate
precision. In the above framework, there are up to 243 actions (35
, 5 dimensions, each
with 3 categories). By coding one dimension at a time, a coder chooses among only 3
possible codes (instead of 243). Thus, training and coding time is shorter. Likewise,
inter-coder reliability likely improves.
Parameter estimates will likely be more precise as well. Instead of 242 binary
variables (243 - 1), only 10 binary variables are needed (3 - 1 or 2 per dimension,
2 × 5 = 10). Thus, the model will have fewer degrees of freedom. Moreover, specific
rare behaviors are now combinations of variable values. So, they are less likely to cause
multi-collinearity problems. As a result, this model with fewer explanatory variables and
likely less multi-collinearity probably has more precise parameter estimates.
In short, using multiple dimensions retains the categories’ complexity, helps check
for mutually exclusive codes, likely improves inter-coder reliability and improves the
precision of parameter estimates.
Multilevel Analysis
Multilevel analysis techniques (Goldstein, 1995) address group-specific and time
period-specific effects (heterogeneity). (This method is also called hierarchical linear
modeling or HLM [Bryk & Raudenbush, 1992]). A multilevel model estimates the
relationship between an outcome variable and sets of explanatory variables defined at
different units of analysis (or levels). For example, a person's turn of talk occurs within a
specific time period within a particular group. These different levels (turn of talk, time
period, group) are nested in a hierarchical structure.
Logit and Multilevel Models
We often use binary outcome variables to estimate the probability of observing or not
observing an event. For example, in our models of group processes we can estimate the
likelihood of agreeing with the previous speaker or not. The standard method for
modeling binary outcome variables is to use Logit models (see Greene [1997] for a
discussion of multinomial and ordered regressions)
Estimating Break Points to Identify Different Time Periods
Group processes occur over time. So, group process data are time series data. As
Analyzing Group Work Processes:… 15
group processes can change over time, modeling it accurately may require different
parameter estimates for each time period. For example, people might agree more often at
the end of a problem solving session than at the beginning of one. They might disagree
often until they find a correct method (a "break point" in the session). Afterwards, they
are likely to agree more often.
These time period differences can be addressed by dividing the data into different
time periods, and using multilevel analysis to model the time period differences.
However, we face the problem of identifying exactly how the sessions are divided into
different time periods. We must estimate the number and locations of the break points in
the time series data.
Maddala and Kim (1998) provide a comprehensive discussion of the estimation of
unknown break points. They view the estimation of an unknown number of break points
as a model selection problem. Assuming a finite number of break points, we create
models for different combinations of locations of break points. Choosing the model that
minimizes the Bayesian information criterion (BIC) identifies the appropriate break
points.
Serial Correlation of Residuals
In time series data, events are often very similar to recent events, a.k.a. serial
correlation of residuals. For example, in the application (in section 5 below), agreement
tends to occur in "clumps." Conversations move between topics where speakers tend to
concur and topics where they do not.
If time series effects are not modeled properly, serial correlation in the data can
seriously bias parameter estimates. When residuals are serially correlated, parameter
estimates are often not efficient, and estimates of the parameters' standard errors are
biased. Ljung-Box (1979) Q-statistics are used to test for serial correlation of the
residuals.
APPLICATION: PREDICT AGREEMENT
This application re-analyzes data transcribed from 20 group work sessions in Chiu
(2000). We examine which variables distort the evaluation of the previous speaker's idea.
Hypotheses
As noted earlier, properly evaluating one another's ideas is critical to reaching the
optimal group decision or solution. So, anything that distorts evaluations of ideas is
undesirable. In an ideal world, correctness should be the only predictor of agreement.
However, other factors such as status, politeness and recent agreements can also affect
Ming Ming Chiu
16
agreement. Controlling for the correctness of the previous speaker, his/her past
achievement in the same problem area (achievement status) can also affect other's
evaluations of the immediate idea. Thus, we expect past mathematics grade to distort
agreement when a group works on a mathematics problem. Additionally, rude comments
such as unresponsive behavior and rude disagreements threaten face. Thus, group
members are more likely to be defensive and hence less likely to agree with the rude
person. Finally, agreement in recent turns may also predict future agreement because
previous agreements are likely to build a common knowledge base for agreement in the
following turns.
Therefore, it is likely that the:
♦ Previous speaker’s correctness predicts agreement.
♦ Previous speaker’s achievement status predicts agreement.
♦ Previous speaker’s politeness predicts agreement.
♦ Agreement in recent turns predicts agreement.
Method
Data
The data consisted of 80 middle school students’ grades and transcribed videotapes.
These students worked in 20 groups of 4 on an algebra word problem. The lowest unit of
analysis is a speaker's turn in the group's conversation. The transcribed videotapes
included 3104 speaker turns of conversation.
Turn-level variables and individual-level variables predicted the outcome variable
AGREE. All turn-level explanatory variables occur before the turn of the outcome
variable. So, time constrains the direction of causality.
Each speaker turn was coded for the following: correctness, mathematics status, and
evaluation of the previous speaker. A speaker’s mathematics status was computed as his
or her mathematics grade minus his or her group’s mean mathematics grade. Evaluations
included agreement, impolite disagreement, polite disagreement, neutral actions and
ignoring the previous speaker. So, our model included the following variables: CORRECT,
MATH STATUS, RUDELY DISAGREE, IGNORE and AGREE. J. Cohen's (1960) kappa tested
inter-rater reliability. Restating the hypotheses in terms of these variables, we have the
following (lags in parentheses):
♦ CORRECT 1 to 4 turns earlier (-1, -2, -3, -4) positively predict AGREE in
the current turn (0).
♦ MATH STATUS (-1...-4) positively predict AGREE (0).
♦ AGREE (-1...-4) positively predict AGREE (0).
♦ RUDELY DISAGREE (-1...-4) negatively predict AGREE (0).
♦ IGNORE (-1...-4) negatively predict agreement. (0)
Analyzing Group Work Processes:… 17
Analysis
The analysis proceeded in the following order. First, we identified the time periods
and break points using the method outlined in Maddala & Kim (1998). Second, we tested
for heterogeneity across groups and across time periods with a variance components
model. Third, the multilevel Logit models were estimated using the software MLn.
Fourth, we tested for residual serial correlation with Q-statistics. (A lagged outcome
variable, agree[-1] was sufficient to eliminate the serial correlation.) Fifth, we estimated
the effect sizes for each explanatory variable with sequential (or hierarchical) regressions
(see J. Cohen & P. Cohen, 1983). Lastly, we tested for direct and indirect effects using
path analysis (see J. Cohen & P. Cohen, 1983).
Identify the different time periods. Conditions change over time. So, a model's
parameters might differ according to the time period. People might agree more often at
the end of a problem solving session than at the beginning of one. They might disagree
regularly until they find a correct method (a "break point" in the session). Afterwards,
they are likely to agree more often. So, for each group's data, we estimate the number
and locations of break points that divide the outcome variable AGREE into distinct time
periods.
Maddala & Kim (1998) outlines a method for identifying the number and locations of
break points in a time series. First, we identify an appropriate time series model for the
variable AGREE. Introducing explanatory variables into the model this early might raise
the difficulty of rejecting the null hyphothesis of no break points –even if they exist in the
full model (type II error). So, we used a time series model without any explanatory
variables to identify break points.
We identified the appropriate autoregressive model to use by minimizing the BIC.
This was done for all the groups. We found that most groups can best described by an
AR(1) model.
Yt = C + Yt-1 + ε
Next, we identified the break points. We assumed a maximum number of 5 break
points (or 6 time periods). (Assuming more would have been too computationally
intensive. Testing for an additional break point exponentially increases the computation
time.) We calculated the BIC for all possible locations of those break points in the time
series. This was done for all possible numbers of break points (0-5). The number and
locations of break points that minimized the BIC was chosen as the best estimate.
Heterogeneity of groups or time periods? Next, we used a variance components test
to check if the outcome variable, AGREE, significantly varied across groups or time
periods. If it does for both, both groups and time periods are heterogeneous. Then, a 3-
level model would be needed. In this 3-level model, speaker turns (level 1) are nested
within time periods (level 2) which are nested within each group (level 3).
Estimate model. We used multilevel Logit regressions to estimate a general time
series model. These regressions were run using the software MLn. The model included
Ming Ming Chiu
18
all explanatory variables and lagged variables up to order 4. If groups or time periods are
heterogeneous, explanatory variable effects on agreement can vary across groups or
across time periods. So, we estimated the variations of the explanatory variables’ effects
across groups and across time periods. We included significant group and time period
variations in the model.
Next, we tested the significance of the explanatory variables, both as sets and
individually. We removed the non-significant ones. For binary outcome variables, the
likelihood ratio test is not reliable. So, we used Wald tests instead (Goldstein, 1995).
Non-significant variables were removed in the following order: higher order lagged turn
variables first (-4, then -3, then -2, then -1), then speaker variables. This yielded the final
model.
Serial correlation of residuals? We used Ljung-Box (1979) Q-statistics to test for
serial correlation (up to order 4) in the residuals for all 20 groups. If the residuals are not
serially correlated, then the model is likely an adequate time-series model. Also, the
estimates would likely be unbiased.
Effect sizes. We estimated the effect sizes of each explanatory variable in the final
model with sequential, multilevel Logit regressions. Recent events are more likely than
earlier events to affect agreement in the current turn. So, we entered the explanatory
variables in reverse temporal order into the sequential, multilevel Logit regressions.
Direct and indirect effects. Lastly, we tested for direct and indirect explanatory
variable effects with a path analysis. Temporal order constrains causal relationships, so
the final model's explanatory variables were entered in temporal order into the path
analysis.
All results were significant at the .05 level.
Results and Discussion
Overall, 72% of the on-task turns were correct. Evaluations included 54%
agreements, 0.3% neutral, 16% ignore/unresponsive turns, 18% polite disagreements and
9% rude disagreements (Cohen's kappa = .93, z = 49.5, p < .001).
Identify different time periods
The estimation of break points yielded 1 to 4 breakpoints for each group. This
resulted in 2 to 5 time periods for each group.
Heterogeneity of groups or time periods?
The variance components model showed significant variation of AGREE at both the
group level (0.14 [standard error = 0.05]) and the time period level (0.06 [0.02]). So, the
Analyzing Group Work Processes:… 19
groups and the time periods are both heterogeneous with respect to AGREE. Thus, a 3-
level multilevel Logit model is needed (speaker turn, time period and group). Of the total
AGREE variance, 12% occurs at the group level, and 5% occurs at the time period level.
Estimate model
None of the variances of the explanatory variables’ coefficients were significant at
the either the group or time period level. This result suggests that the explanatory
variables’ effects on agreement are general across groups and across time periods.
After testing nested hypotheses of successive deletions of non-significant explanatory
variables (with χ2
log likelihood), the same significant explanatory variables remain (see
table 2).
The following properties of previous speakers positively predicted agreement (lags in
parentheses): CORRECT (-1), MATH STATUS (-1) and AGREE (-1). Meanwhile, IGNORE (-1)
and RUDELY DISAGREE (-1, -2, -3) negatively predicted agreement.
So, correctness predicts agreement. However, status, recent agreement and rudeness
also distorted agreement. Members' evaluations were distorted towards higher
mathematical status members. Their evaluations were also distorted toward those who
had agreed earlier. In contrast, their evaluations were distorted against those who
behaved rudely –those who ignored others or who disagreed rudely.
RUDELY DISAGREE showed the strongest and longest lasting effects. The coefficients
for RUDELY DISAGREE (-1) and (-3) were the largest, exceeding even CORRECT (-1).
Thus, RUDELY DISAGRE tended to trump CORRECT. RUDELY DISAGREE also affected the
likelihood of AGREE 3 turns later whereas the other effects only lasted 1 turn.
Serial correlation of residuals?
The Q-statistics of the final model showed no significant serial correlation of
residuals in any of the 20 groups. So, the model estimates are likely unbiased.
Effect sizes
The sequential multilevel Logit regressions showed that these explanatory variables
explained 62% of the group variation and 87% of the time period variation. CORRECT
(-1) explained surprisingly little of the variance. It explained at most 26% of the group
variance and 4% of the time period variance. Meanwhile prior evaluations accounted for
more of the group variance (at least 32%) and most of the time period variance (at least
79%).
Analyzing Group Work Processes:…
Table 2. Mutlilevel Logit regression predicting agreement
Regressions
Explanatory variable 1 2 3 4 5 6
Right(-1) 0.445 *** 0.438 *** 0.476 *** 0.426 *** 0.429 *** 0.429 ***
0.084 0.084 0.085 0.086 0.086 0.086
Relative Math Grade (-1) 0.011 * 0.011 * 0.010 * 0.009 * 0.009 *
0.005 0.005 0.005 0.005 0.005
Agree (-1) 0.619 *** 0.333 ** 0.313 ** 0.306 **
0.079 0.105 0.105 0.105
Responsive(-1) 0.313 * 0.315 * 0.304 *
0.132 0.132 0.132
Naked disagreement (-1) -0.819 *** -0.779 *** -0.757 ***
0.160 0.161 0.161
Naked disagreement (-2) -0.411 ** -0.345 *
0.136 0.138
Naked disagreement (-3) -0.568 ***
0.138
Log likelihood 4051 4034 3988 3954 3942 3920
Explained group variance 33% 35% 55% 51% 53% 55%
Explained time period variance 4% 7% 38% 39% 43% 49%
Note: Number of observations = 3104
*p < .05, **p < .01, ***p< .001
Analyzing Group Work Processes:… 21
Direct and indirect effects
Lastly, the path analyses showed that all of these explanatory variables showed both
total and direct effects (see figure 1). Rude disagreements and mathematical status also
showed indirect effects. Earlier rude disagreements (-2, -3) positively predicted later
rude disagreements (-1) and negatively predicted AGREE (-1). This reciprocation
increased the likelihood of a spiral of naked disagreements that could threaten the
collaboration. Meanwhile MATH STATUS (-1) positively predicted IGNORE (-1) and
negatively predicted RUDELY DISAGREE (-1).
To test if group members distorted their evaluations, Chiu (2000) used a simple Logit
to predict agreement at time T from the previous speaker's (T-1) correctness, mathematics
grade and social status. This re-analysis includes other variables and from earlier turns
while adjusting for heterogeneous group effects, heterogeneous time period effects and
serial correlation of the residuals. Mathematics status is now a significant predictor
whereas mathematics grade and social status are not. Furthermore, earlier rude
disagreements, agreements, and unresponsive (ignore) turns in addition to correctness
predict agreement.
CONCLUSION
To help consider why some groups solve problems successfully but others do not,
this article introduces a framework and a methodology for statistical analyses of many
group interactions both in fine detail and in their entirety. Organizing individual action
properties along dimensions allows for mutually exclusive categories without sacrificing
multiple functions. Furthermore, the dimensional simplicity increases the tractability of
coding for large sample-size statistical analyses both at and among the levels of (1)
action, (2) individual and (3) group activity. These dimensions also provide possible
quantitative measures of collaborative quality.
The new methodology, dynamic multilevel analysis, solves all six difficulties
associated with dynamic analyses of time series data. The multi-dimensional coding
framework simplifies coding, reduces errors and increases the precision of model
estimates. Break point identification specifies the number and locations of breakpoints
that divide the data into appropriate time periods. The multi-level component solves the
problems of potential group and time period heterogeneities. Logit allows for discrete
outcome variables. Lastly, time-series analysis tests for serial correlation of residuals and
if necessary, models them.
Ming Ming Chiu
22
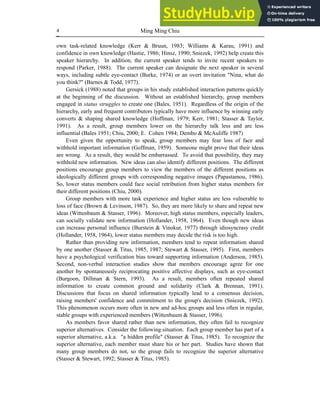
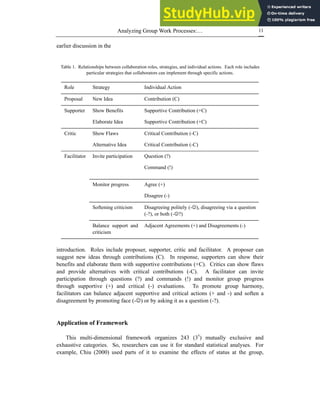
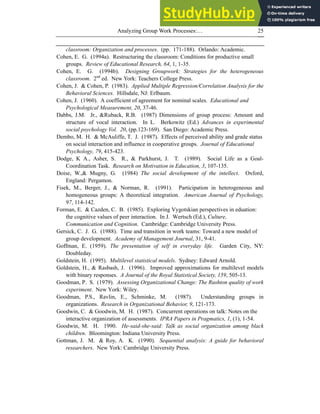
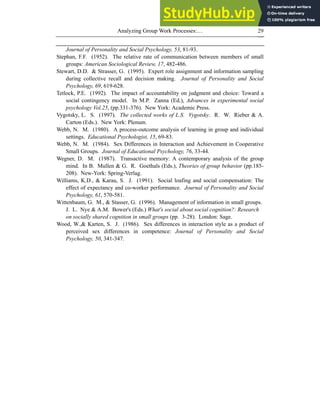
Figure 1. Multilevel Logit path analysis of predictors of agreement with the previous speaker
Limitations
This individual action framework does not capture fine gradations within each
category and omits the influence of many factors. For example, a simple addition such
“two plus one is three" and a novel representation that frames the solution to a problem
can both be contributions, but their impacts on the collaboration differ. This framework
omits the influence of many micro-level factors (such as prosody, rhythm and silence).
Adding micro-level elements can provide additional information for researchers to
improve their interpretation of interactional data. (See Auer & di Luzio [1992] and
Gumperz [1978] for discussions of prosody and rhythm and Schegloff [1995] for ways to
analyze silence.)
This macro-level factors (such as relationship histories, physical environments, and
societal/cultural expectations). Also, the shared history between people who know each
other provides common knowledge and psychological expectations that strangers lack.
Thus, a person may interpret and respond to a friend's action differently than to an
identical action by a stranger (Goodwin, 1990; Schiffrin, 1984). The physical
.01*
-
.56**
-.46***
.01*
-.57***
.31**
Math Status (-1)
Rudely
disagree (-3)
Rudely
disagree (-2)
Ignore (-1)
Rudely
disagree (-1)
Agree (-1)
Agree (0)
-.30*
-.76***
-.35*
-.01*
1.12***
.43***
Correct (-1)
1.12***
Analyzing Group Work Processes:… 23
environment can also influence collaborations through its resources and its history of
expectations (Hutchins, 1995). Using physical resources such as rulers or calculators for
instance, students can solve many more problems than they can without them.
Furthermore, collaborators are likely to behave differently based on their experience with
a particular location (Lave, 1983). For example, they may say and do things at their
friend's house that they would not do in class or in a library. Finally, societal and cultural
expectations may influence social interactions. As discussed above, societal expectations
in public places constrain our behavior. People can also conform to (or intentionally
violate) norms in other cultures when interacting with a person perceived to hold those
values and beliefs (Gumperz, 1978).
Future research
These classifications of individual actions and this new methodology enable testing
of several hypotheses. Do highly collaborative groups show more agreements,
disagreements, contributions, repetitions, or questions? Can one or more of the individual
action dimensions be used to create a quantitative operational definition of collaboration?
Do particular individual actions increase the likelihood of other individual actions? Do
particular patterns of individual actions predict successful problem solving?
Moreover, adding dimensions and elaborating existing ones can improve this
individual action framework. Other important dimensions may include properties of
voice, gestures, facial expressions, etc. Furthermore, we can expand existing dimensions.
For example, we can subdivide contributions (C) into specific types such as computation,
metaphor, synthesis, etc.
Research combining dynamic multilevel Logit (DML) and structural equation
modeling (SEM) may help extend DML to DML-SEM. DML-SEM would allow for
estimates of measurement errors through multiple measures. It would also allow
estimates of unobserved continuous variables.
By addressing these questions and improving their methods, researchers can help
group members understand and improve their group problem solving.
REFERENCES
Allport, G. (1954). The nature of prejudice. Cambridge, MA: Addison.
Anderson, J. R. (1985). Cognitive psychology and its implications New York: Freeman.
Asch, S.E. (1952). Social Psychology. Englewood Cliffs, NJ: Prentice Hall.
Auer, P, & di Luzio, A. (1992). The contextualization of language. Amsterdam: John
Benjamins.
Bales, R. F. (1951). Interaction process analysis. Cambridge, MA: Addison-Wesley.
Bales, R. F., & Strodtbeck, F. L. (1951). Phases in group problem-solving. Journal of
Abnormal and Social Psychology, 46, 485-495.
Ming Ming Chiu
24
Bales, R.F. (1953). The equilibrium problem in small groups. In T. Parsons, R.F.
Bales, & E.A. Shils (Eds.) Working papers in the theory of action (pp.444-476).
Glencoe, IL: the Free Press.
Barnes, D., & Todd, F. (1977). Communication and learning in small groups. Boston:
Routledge.
Berger, J., Cohen, B. P., & Zelditch, M. (1972). Status characteristics and social
interaction. American Sociological Review, 37, 3, 241-256.
Box, G. E. P., & Jenkins, G. M. (1976). Time series analysis: Forecasting and
control. 2nd
Edition. New York: Holden-Day.
Boyd, R. D. (1991). Personal transformation in small groups. Boston: Routledge.
Braun, H. I., Jones, D. H., Rubin, D. B., & Thayer, D. T. (1983). Empirical Bayesian
estimation of coefficients in the general linear model from data of deficient rank.
Psychometrika, 489, 2, 171-181.
Brown, P., & Levinson, S. (1987). Politeness: Some universals in language usage.
Cambridge: Cambridge University Press.
Bryk, A. S., & Raudenbush, S. W. (1992). Hierarchical linear models: Applications
and data analysis methods. Newbury Park: Sage.
Burgoon, J. K., Dillman, L., & Stern, L. (1993). Adaptation in dyadic interaction:
Defining and operationalizing patterns of reciprocity and compensation.
Communication Theory, 3, 295-316.
Burke,P. (1974). Participation and leadership in small groups. American Sociological
Review 39, 832-843
Burnstein, E., & Vinokur, A. (1977). Persuasive argumentation and social comparison
as determinants of attitude polarization. Journal of Experimental Social Psychology,
13, 315-332.
Cazden, C. B. (1988). Classroom discourse: The language of teaching and learning.
Portsmouth, NH : Heinneman.
Chiu, M. M. (1997a). Building mathematical understanding during collaboration:
Students learning functions and graphs in an urban, public high school. Dissertation
Abstracts International, 58-02a, 383. (University Microfilms No. AAI97-22908).
Chiu, M. M. (1997b). Building on diversity: A moment-to-moment analysis of students
collaboratively solving mathematics problems. Los Angeles: University of
California, Los Angeles. (ERIC Documentation Reproduction Service No. ED 410
325). Paper presented at the Annual Meeting of the American Educational Research
Association. New York, NY.
Chiu, M. M. (2000). Status effects on solutions, leadership, and evaluations during
group problem solving. Sociology of Education, 73, 3, 175-195.
Clark, H. H., & Brennan, S. E. (1991). Grounding in communication. In L. B.
Resnick, J. M. Levine, & S. D. Teasley (Eds.), Perspectives on socially shared
cognition (pp. 127-149). Washington, D.C.: American Psychological Association.
Cohen, E. G. (1982) Expectation States and Interracial Interaction in School Settings.
Annual Review of Sociology, 8, 109-235.
Cohen, E. G. (1984). Talking and working together: Status interaction and learning. In
P. Peterson, L. C. Wilkinson, & M. Hallinan (Eds.) Instructional groups in the
Analyzing Group Work Processes:… 25
classroom: Organization and processes. (pp. 171-188). Orlando: Academic.
Cohen, E. G. (1994a). Restructuring the classroom: Conditions for productive small
groups. Review of Educational Research, 64, 1, 1-35.
Cohen, E. G. (1994b). Designing Groupwork: Strategies for the heterogeneous
classroom. 2nd
ed. New York: Teachers College Press.
Cohen, J. & Cohen, P. (1983). Applied Multiple Regression/Correlation Analysis for the
Behavioral Sciences. Hillsdale, NJ: Erlbaum.
Cohen, J. (1960). A coefficient of agreement for nominal scales. Educational and
Psychological Measurement, 20, 37-46.
Dabbs, J.M. Jr., &Ruback, R.B. (1987) Dimensions of group process: Amount and
structure of vocal interaction. In L. Berkowitz (Ed.) Advances in experimental
social psychology Vol. 20, (pp.123-169). San Diego: Academic Press.
Dembo, M. H. & McAuliffe, T. J. (1987). Effects of perceived ability and grade status
on social interaction and influence in cooperative groups. Journal of Educational
Psychology, 79, 415-423.
Dodge, K A., Asher, S. R., & Parkhurst, J. T. (1989). Social Life as a Goal-
Coordination Task. Research on Motivation in Education, 3, 107-135.
Doise, W.,& Mugny, G. (1984) The social development of the intellect. Oxford,
England: Pergamon.
Fisek, M., Berger, J., & Norman, R. (1991). Participation in heterogeneous and
homogeneous groups: A theoretical integration. American Journal of Psychology,
97, 114-142.
Forman, E. & Cazden, C. B. (1985). Exploring Vygotskian perspectives in eduation:
the cognitive values of peer interaction. In J. Wertsch (Ed.), Culture,
Communication and Cognition. Cambridge: Cambridge University Press.
Gersick, C. J. G. (1988). Time and transition in work teams: Toward a new model of
group development. Academy of Management Journal, 31, 9-41.
Goffman, E. (1959). The presentation of self in everyday life. Garden City, NY:
Doubleday.
Goldstein, H. (1995). Multilevel statistical models. Sydney: Edward Arnold.
Goldstein, H., & Rasbash, J. (1996). Improved approximations for multilevel models
with binary responses. A Journal of the Royal Statistical Society, 159, 505-13.
Goodman, P. S. (1979). Assessing Organizational Change: The Rushton quality of work
experiment. New York: Wiley.
Goodman, P.S., Ravlin, E., Schminke, M. (1987). Understanding groups in
organizations. Research in Organizational Behavior, 9, 121-173.
Goodwin, C. & Goodwin, M. H. (1987). Concurrent operations on talk: Notes on the
interactive organization of assessments. IPRA Papers in Pragmatics, 1, (1), 1-54.
Goodwin, M. H. 1990. He-said-she-said: Talk as social organization among black
children. Bloomington: Indiana University Press.
Gottman, J. M. & Roy, A. K. (1990). Sequential analysis: A guide for behavioral
researchers. New York: Cambridge University Press.
Ming Ming Chiu
26
Grasa, A. A. (1989). Econometric model selection: A new approach. Dordrecht:
Kluwer.
Green, S. B. (1991). How many subjects does it take to do a regression analysis?
Multivariate Behavioral Research, 26, 499-510.
Greene, William H. (1997). Econometric analysis. 3rd edition. New York: Prentice-
Hall.
Gumperz, J. J. (1978). Dialect and conversational inference in urban communication.
Language in Society, 7, 3, 393-409.
Hackman, J. R., & Morris, C. G. (1975). Group tasks, group interaction process, and
group performance effectiveness: A review and proposed integration. In L.
Berkowitz (Ed.), Advances in experimental social psychology, Vol. 8, (pp. 45-99).
New York: Academic Press.
Halliday, M. A. K., & Hasan, R. (1976). Cohesion in English. London : Longman.
Hastie, R. (1986). Experimental evidence on group accuracy. In B. Grofman & G.
Owen (Eds.), Information pooling and group decision making (pp. 129-157).
Greenwich, CT: JAI.
Hinsz., V. B.(1990). Cognitive and consensus processes in group recognition and
memory performance. Journal of Personality and Social Psychology 59, 705-718.
Hirokawa, R. Y. (1983). Group communication and problem-solving effectiveness: An
investigation of group phases. Human Communication Research, 9, 291-305.
Hoffman, R.L. (Ed.). (1979). The group problem solving process: Studies of a valence
model. New York: Praeger.
Hollander, E. P. (1958). Conformity, status, and idiosyncrasy credit. Psychological
Review, 65, 117-127.
Hollander, E. P. (1964). Leaders, groups, and influence. New York: Oxford University
Press.
Hutchins, E. (1995). Cognition in the wild. Cambridge, MA: MIT press.
Johnston, Jack & DiNardo, John (1997), Econometric methods (4th
ed.). New York:
McGraw-Hill.
Kagan, S. (1992). Cooperative Learning. San Juan Capistrano, CA: Resources for
Teachers.
Kenney, D. A. (1994). Interpersonal perception: A social relations analysis. New
York: Guilford.
Kerr, N. L. (1981). Social transition schemes: Charting the road to agreement. Journal
of Personality and Social Psychology, 41, 684-702.
Kerr, N.L., & Watts, B.L. (1982). After division, before decision: Group faction size and
predeliberation thinking. Social Psychology Quarterly, 45, 198-205.
Kerr, N.L.,&Brunn, S.E.(1983). The dispensability of member effort and group
motivation losses: Free-rider effects. Journal of Personality and Social Psychology,
44, 78-89.
Kirchmeyer, C. (1993). Multicultural task groups: An account of the low contribution
level of minorities. Small Group Research, 24, 127-148.
Analyzing Group Work Processes:… 27
Larson, J. R., Jr., Foster-Fishman, P. G., & Keys, C. B. (1994). Discussion of shared
and unshared information in decision-making groups. Journal of Personality and
Social Psychology, 67, 446-461.
Laughlin, P. R. (1999). Collective Induction: Twelve Postulates. Organizational
Behavior and Human Decision Processes, 80, 1, 50-69.
Laughlin, P. R., & Hollingshead, A. B. (1995). A theory of collective induction.
Organizational Behavior and Human Decision Processes, 69, 265-275.
Laughlin, P. R., VanderStoep, S. W., & Hollingshead, A. B. (1991). Collective versus
individual induction: Recognition of truth, rejection of error, and collective
information processing. Journal of Personality and Social Psychology, 61, 50-67.
Laughlin, P.R., & Ellis, A.L. (1986) Demonstrability and social combination processes
on mathematical intellective tasks. Journal of Experimental Social Psychology, 22,
177-189.
Lave, J. (1983). Cognition in practice: Mind, mathematics, and culture in everyday life.
New York: Cambridge University Press.
Levine, J. M., & Thompson, L. (1996). Conflict in groups. In E. T. Higgins & A. W.
Kruglanski (Eds.), Social psychology: Handbook of basic principles (pp. 745-776).
New York: Guilford.
Levine, J. M.,& Thompson, L. (1996). Conflict in groups: In E.T. Higgins &A.W.
Kruglanski (Eds.), Social Psychology: Handbook of basic principles (pp.745-776)
New York: Guilford.
Liang, D. W., Moreland, R., & Argote, L. (1995). Group versus individual training and
group performance: The mediating role of transactive memory. Personality and
Social Psychology Bulletin, 21, 384-393.
Ljung, G. & Box, G. (1979). On a measure of lack of fit in time series models.
Biometrika, 66, 265–270.
Lott, A. J. & Lott, B. E. (1965). Group Cohesiveness and individual learning. Journal
of Educational Psychology, 75, 877-888.
Lütkepohl, H. (1985). Comparison of criteria for estimating the order of a vector
autoregressive process. Journal of Time Series Analysis, 6, 35-52.
Maddala, G. S. and Kim, I.M. (1998), Unit roots, cointegration and structural change.
New York: Cambridge University Press.
Mehan, H. (1979). Learning lessons: Social organization in the classroom. Cambridge,
MA: Harvard.
Papastamou, S.C. (1986). Psychologization and processes of minority and majority
influence. European Journal of Psychology 16, 165-180
Parker, K. (1988). Speaking turns in small group interaction: A context-sensitive event
sequence model. Journal of Personality and Social Psychology, 54, 965-971.
Pavitt, C., & Johnson, K. K. (1999). An examination of the coherence of group
discussions. Communication Research, 26, 3,303-32.
Pavitt, C., Whitchurch, G. G., Siple, H., & Petersen, N. (1997). Communication and
emergent group leadership: Does content count? Communication Research Reports,
14, 470-480.
Ming Ming Chiu
28
Perret-Clermont, A.N. (1980). Social interaction and cognitive development in children.
London: Academic.
Piaget, J. (1952). The child's conception of number. New York: Humanities Press.
Pomerantz, A. (1984). Agreeing and disagreeing with assessments: Some features of
preferred/dispreferred turn shapes. In J. M. Atkinson & J. Heritage (Eds.),
Structures of social action: Studies in conversation analysis. Cambridge: Cambridge,
pp. 57-101.
Poole, M. S. (1981). Decision development in small groups: A comparison of two
models. Communication Monographs, 48, 1-24.
Robinson, P. M. (1982). On the asymptotic properties of estimators with limited
dependent variables. Econometrica, 50, 27-42.
Sacks, H. (1987). On the preferences for agreement and contiguity in sequences in
conversation. In G. Button and J. R. E. Lee (Eds.) Talk and social organisation pp.
54-69. Philadelphia: Multilingual Matters.
Salomon, G., & Globerson, T. (1989). When teams do not function as they ought to.
International Journal of Educational Research, 13, 89-99.
Schegloff, E. A. (1995). Discourse as an interactional achievement III: The
omnirelevance of action. Research on Language and Social Interaction, 28, 3,185-
211.
Schegloff, E. A. (1996).Confirming allusions: Toward an empirical account of action.
American Journal of Sociology, 102, (1), 161-216.
Schegloff, E. A. (1997). "Narrative Analysis" Thirty Years Later. Journal of Narrative
and Life History, 7, 1, 97-106.
Schiffrin, D. (1984). Jewish argument as sociability. Language in Society, 13, 3, 311-
335.
Shaw, M. E. (1932). Comparison of individuals and small groups in the rational
solution of common problems. American Journal of Psychology, 44, 491-504.
Slavin, R. E. (1990). Cooperative learning: Theory, research & practice. Boston:
Allyn & Bacon.
Sniezek, J.A. (1992). Groups under uncertainty: An examination of confidence in group
decision making. Organizational Behavior and Human Decision Processes, 52, 124-
155.
Stasser, G. (1992). Pooling of unshared information during group discussion. In S.
Worchel, W. Wood, & J. Simpson (Eds.), Groups process and productivity (pp. 48-
57). Newbury Park, CA: Sage.
Stasser, G., & Davis, J. H. (1981). Group decision making and social influence: A
social interaction sequence model. Psychological Review, 88, 6, 523-551.
Stasser, G.,& Taylor, L. (1991). Speaking turns in face-to-face discussions. Journal of
Personality and Social Psychology, 60, 675-684.
Stasser, G.,& Titus, W. (1985). Pooling of unshared information in group decision
making: Biased information sampling during discussion. Journal of Personality and
Social Psychology, 53, 81-93.
Stasser, G.,& Titus, W. (1987). Effects of information load and percentage of shared
information on the dissemination of unshared information during group decision,
Analyzing Group Work Processes:… 29
Journal of Personality and Social Psychology, 53, 81-93.
Stephan, F.F. (1952). The relative rate of communication between members of small
groups: American Sociological Review, 17, 482-486.
Stewart, D.D. & Strasser, G. (1995). Expert role assignment and information sampling
during collective recall and decision making. Journal of Personality and Social
Psychology, 69, 619-628.
Tetlock, P.E. (1992). The impact of accountability on judgment and choice: Toward a
social contingency model. In M.P. Zanna (Ed.), Advances in experimental social
psychology Vol.25, (pp.331-376). New York: Academic Press.
Vygotsky, L. S. (1997). The collected works of L.S. Vygotsky. R. W. Rieber & A.
Carton (Eds.). New York: Plenum.
Webb, N. M. (1980). A process-outcome analysis of learning in group and individual
settings. Educational Psychologist, 15, 69-83.
Webb, N. M. (1984). Sex Differences in Interaction and Achievement in Cooperative
Small Groups. Journal of Educational Psychology, 76, 33-44.
Wegner, D. M. (1987). Transactive memory: A contemporary analysis of the group
mind. In B. Mullen & G. R. Goethals (Eds.), Theories of group behavior (pp.185-
208). New-York: Spring-Verlag.
Williams, K.D., & Karau, S. J. (1991). Social loafing and social compensation: The
effect of expectancy and co-worker performance. Journal of Personality and Social
Psychology, 61, 570-581.
Wittenbaum, G. M., & Stasser, G. (1996). Management of information in small groups.
J. L. Nye & A.M. Bower's (Eds.) What's social about social cognition?: Research
on socially shared cognition in small groups (pp. 3-28). London: Sage.
Wood, W.,& Karten, S. J. (1986). Sex differences in interaction style as a product of
perceived sex differences in competence: Journal of Personality and Social
Psychology, 50, 341-347.

Analyzing Group Work Processes Towards A Conceptual Framework And Systematic Statistical Analyses

  • 1.
    Chapter 1 ANALYZING GROUPWORK PROCESSES: TOWARDS A CONCEPTUAL FRAMEWORK AND SYSTEMATIC STATISTICAL ANALYSES Ming Ming Chiu mingming@cuhk.edu.hk ABSTRACT Each action during group work has many effects, and their effects can vary over time. Thus, a systematic analysis of group processes requires a multi-dimensional conceptual framework and dynamic statistical tools. Past research on group work has typically focused on either cognitive or socio-emotional aspects using coarse levels of analyses. In contrast, this chapter presents a new framework of individual actions that combines cognitive and socio-emotional aspects. This framework organizes each action along five dimensions. These are evaluation (agree, disagree, ignore), knowledge (contribution, repetition, null), validity (right, wrong, unrelated) invitation (command, question, statement), and politeness (give face, neutral, threaten face). In particular, evaluations, repetitions, invitations and politeness link actions together to create coherent interactions. As a result, they help measure how well a group works together. Dynamic analysis of group processes faces at least six difficulties. First, coding difficulties reduce inter-coder reliability and the precision of parameter estimates. Second, effects can differ for each group. Third, effects can change over time. Fourth, we must identify time periods with stable effects. Fifth, the outcome variables can be discrete rather than continuous. Lastly, serial correlation of the residuals can occur. This chapter presents a new method that addresses all of these issues: multilevel Logit with time series analyses. A study shows how group processes are modeled using this framework and this method. INTRODUCTION Research as early as Shaw (1932) has shown that groups often perform better than individuals. However, groups do not always perform better (e.g., Laughlin, VanderStoep & Hollingshead, 1991). Why are some groups more successful than others? Earlier
  • 2.
    Ming Ming Chiu 2 researchin psychology, education, organizational behavior and sociology focused on group structures and group member traits to explain different group outcomes. Significant group structures include group size (Goodman, 1979; Levine & Thompson, 1996), reward structure (Slavin, 1990), problem type (E. Cohen, 1994a; Laughlin & Hollingshead, 1995), time (Larson, Foster-Fishman, & Keys, 1994), group history (Pavitt, Whitchurch, Siple, & Petersen, 1997) and outside constituencies (Tetlock, 1992). Likewise significant group member traits include past achievement (Webb, 1980), perceived ability (Liang, Moreland & Argote, 1995), personality (Boyd, 1991), peer status (Berger et al., 1972; E. Cohen, 1984), gender (Webb, 1984; Wood & Karten, 1986) and ethnicity (E. Cohen, 1982; Kirchmeyer, 1993). However, these studies typically compared a priori group differences with group outcomes. They did not examine the processes by which the a priori differences affected the outcomes. Groups often have emergent properties that can not be reduced to their inputs (Asch, 1952). Without examining the group processes, they can not explain how groups with similar a priori properties produce different outcomes. This chapter reviews past research on group processes from communication, linguistics, psychology, education, organizational behavior, and sociology. Then, I present a framework for analyzing group processes in detail. Lastly, I introduce a new methodology for modeling group processes. RESEARCH ON GROUP PROCESSES This section discusses past research on group processes' cognitive aspects, socio- emotional aspects and classification schemes. Cognitive Aspects of Group Processes A group can often solve problems that its members cannot solve alone because it can capitalize on its members' different perspectives (Hastie, 1986; Stasser, 1992) and distribute cognitive processing among them (Hutchins, 1995; Vygotsky, 1997). Using its diverse sources of knowledge, a group creates more varied proposals for solutions, increasing the likelihood that one of them is successful. With their different perspectives, members can also use each other's ideas to spark new proposals, creatively misinterpret them and combine them (Chiu, 1997a). Comments by one member, even the use of a particular word, can spark a proposal from another. A person can also misinterpret another's wrong proposal to create a correct solution serendipitously. Group members can also create partial solutions individually and then put them together for a full solution, an "assembly effect" (Hastie, 1986; Stasser, 1992). When people discuss conflicting views, they can also create socio-cognitive conflicts for one another (Asch, 1952; Doise & Mugny, 1984; Perret-Clermont, 1980; Piaget, 1952). Often, the conflicts help individuals recognize the limitations in their point of
  • 3.
    Analyzing Group WorkProcesses:… 3 view. By coordinating these views, they can resolve their conflict to construct deeper understanding (Piaget's [1952] equilibration). Consider two children, Ana and Sean. They agree that two tall glasses have the same amount of grape juice. Ana pours all the juice from one glass into a short, wide bowl. She then says that the wider bowl has more juice. Sean disagrees. He argues that the taller glass has more. By pointing out the height and width differences to one another, they can help each other understand that these differences offset one another. Eventually, they recognize that each container has the same amount of juice. Through cognitive conflict, Ana and Sean develop a new idea. Groups can also distribute their cognitive processing among its members for both efficiency and error reduction. Wegner (1987) showed that groups rely on subsets of members to remember information related to their area of expertise, "transactive memory." This distributed memory allows group members to use their limited memory efficiently. Likewise, the multiple perspectives of different group members allow the group as a whole to recognize errors more easily (Vygotsky 1997). Socio-emotional Aspect of Group Processes Group work promotes friendship and emotional support even among very different people. Group work provides opportunities to work together for common goals, to get to know one another and work as equals (Allport, 1954). Group work also creates conditions conducive for making friends: contact, perceived similarity, and engagement in pleasant activities (Lott & Lott, 1965). When facing daunting obstacles, members can provide emotional support for one another to continue working. However, group processes are not always smooth. Salomon & Globerson (1989) showed that members may loaf, resentfully withdraw (in response to other's loafing) or dominate group interactions. Members may also be overly aggressive/hostile (Dodge, Asher & Parkhurst, 1989) or passive/acquiescent (Chiu, 1997b). In addition to unproductive individual behaviors, some group processes can also hinder effective group work. For example, group members often do not reveal important information and fail to evaluate alternatives appropriately. Difficulties with providing information Group members often do not share valuable information due to unequal opportunities to participate and concern over harm to their public self-image, or face. Groups rarely discuss their discussion procedures to ensure equitable participation rates (Hackman & Morris, 1975). So, each group's talk often showed a speaker hierarchy (Bales, 1953; Stephan & Mishler, 1952). The most frequent speaker often talked much more often than the second most frequent speaker. This difference between adjacent ranks becomes decreasingly smaller at lower ranks (Bales, 1953; Stephan & Mishler, 1952). Differences in members' status (Fisek, Berger & Norman, 1991), perception of
  • 4.
    Ming Ming Chiu 4 owntask-related knowledge (Kerr & Bruun, 1983; Williams & Karau, 1991) and confidence in own knowledge (Hastie, 1986; Hinsz, 1990; Sniezek, 1992) help create this speaker hierarchy. In addition, the current speaker tends to invite recent speakers to respond (Parker, 1988). The current speaker can designate the next speaker in several ways, including subtle eye-contact (Burke, 1974) or an overt invitation "Nina, what do you think?" (Barnes & Todd, 1977). Gersick (1988) noted that groups in his study established interaction patterns quickly at the beginning of the discussion. Without an established hierarchy, group members engaged in status struggles to create one (Bales, 1951). Regardless of the origin of the hierarchy, early and frequent contributors typically have more influence by winning early converts & shaping shared knowledge (Hoffman, 1979; Kerr, 1981; Stasser & Taylor, 1991). As a result, group members lower on the hierarchy talk less and are less influential (Bales 1951; Chiu, 2000; E. Cohen 1984; Dembo & McAuliffe 1987) Even given the opportunity to speak, group members may fear loss of face and withhold important information (Goffman, 1959). Someone might prove that their ideas are wrong. As a result, they would be embarrassed. To avoid that possibility, they may withhold new information. New ideas can also identify different positions. The different positions encourage group members to view the members of the different positions as ideologically different groups with corresponding negative images (Papastamou, 1986). So, lower status members could face social retribution from higher status members for their different positions (Chiu, 2000). Group members with more task experience and higher status are less vulnerable to loss of face (Brown & Levinson, 1987). So, they are more likely to share and repeat new ideas (Wittenbaum & Stasser, 1996). Moreover, high status members, especially leaders, can socially validate new information (Hollander, 1958, 1964). Even though new ideas can increase personal influence (Burstein & Vinokur, 1977) through idiosyncrasy credit (Hollander, 1958, 1964), lower status members may decide the risk is too high. Rather than providing new information, members tend to repeat information shared by one another (Stasser & Titus, 1985, 1987; Stewart & Stasser, 1995). First, members have a psychological verification bias toward supporting information (Anderson, 1985). Second, non-verbal interaction studies show that members encourage agree for one another by spontaneously reciprocating positive affective displays, such as eye-contact (Burgoon, Dillman & Stern, 1993). As a result, members often repeated shared information to create common ground and solidarity (Clark & Brennan, 1991). Discussions that focus on shared information typically lead to a consensus decision, raising members' confidence and commitment to the group's decision (Sniezek, 1992). This phenomenon occurs more often in new and ad-hoc groups and less often in regular, stable groups with experienced members (Wittenbaum & Stasser, 1996). As members favor shared rather than new information, they often fail to recognize superior alternatives. Consider the following situation. Each group member has part of a superior alternative, a.k.a. "a hidden profile" (Stasser & Titus, 1985). To recognize the superior alternative, each member must share his or her part. Studies have shown that many group members do not, so the group fails to recognize the superior alternative (Stasser & Stewart, 1992; Stasser & Titus, 1985).
  • 5.
    Analyzing Group WorkProcesses:… 5 Difficulties with coordinating different views If group members reveal all their information, the groups often choose the optimal solution (if there is one –"truth wins" [Laughlin, 1999]). However, they do not always do so. Correct member can have difficulty persuading others of the correct solution. Or, groups can use inappropriate methods for choosing among alternatives. Laughlin and Hollingshead (1995) identified 4 conditions for demonstrating a correct idea. They are (a) group consensus on a conceptual system, (b) sufficient information, (c) other members' ability to recognize a correct idea and (d) sufficient correct member ability, motivation and time to persuade other members that the answer is correct. Laughlin and Ellis (1986) further argued that the number of group members necessary and sufficient for a collective decision is inversely proportional to the demonstrability of the proposed solution. One person is enough on eureka/insight problems (Shaw, 1932), remote verbal associations and most math problems. Two people ("truth-supported") suffice on world knowledge such as vocabulary, analogies and general information (Hastie, 1986). However, a majority or more are needed for choice dilemmas, evaluative attitudinal judgments, preferences for bets/gambles and mock jury decisions. Faced with several alternative, groups do not always try to determine the correct one. Laughlin and Hollingshead (1995) also identified three alternatives for resolving conflicts in addition to "create new alternative," "truth wins," and "truth-supported wins." They are voting, turn-taking and random selection among alternatives. As a majority vote can be the final arbitrator, group members may strategically adapt their talk. They tend to support majority positions and avoid support for minority positions (Kerr & Watts, 1982). The influence of the majority depends on several factors. These include majority and minority sizes, the extremity of the majority position, the minority response mode (private vs. public) and the type of decision (see review by Levine & Thompson, 1996). CLASSIFICATION SCHEMES FOR GROUP PROCESSES Past researchers focusing on group members' behaviors have classified them in several ways. These include discussion phases, individual roles and strategies. Earlier researchers used classification systems based on discussion phases (Bales & Strodtbeck, 1951; Hirokawa, 1983). Examples of phases include (a) discuss problem, (b) discuss criteria, (c) propose solutions and (d) evaluate proposals. However, groups do not proceed through phases in a regular manner (Hirokawa, 1983; Poole, 1981). Other researchers have used role classifications (E. Cohen, 1994b; Kagan, 1992). Roles include proposer, supporter, critic and facilitator. Other researchers focus on specific strategies (Barnes & Todd, 1977; Cazden, 1988; Forman & Cazden, 1984; Slavin, 1990). Examples of strategies include proposing new ideas, justifying, identifying weaknesses, inviting participation, etc. During each discussion phase, group members play different roles and use particular strategies. During the proposal phase, a proposer suggests new ideas. During the evaluation phase, supporters and critics evaluate it, seeking advantages
  • 6.
    Ming Ming Chiu 6 anddisadvantages. A supporter tries to justify the claim and elaborate it. In contrast, a critic challenges the original claim and identifies weaknesses. Meanwhile, a facilitator invites participation, monitors the group's progress, etc. With a single action however, a person can perform many functions to satisfy several goals simultaneously. Consider, for example, the following conversation segment: Jose: Six times two is ten. Eva: Isn't six times two equal to twelve? Eva performs many roles and uses several strategies. Simultaneously a critic, a proposer and a facilitator, she criticized the previous action ("isn't") by contributing an alternate proposal ("six times two equal to twelve") in the form of a question (?) to soften the criticism and invite evaluation. Thus, neither roles nor strategies form a mutually exclusive and exhaustive classification system. Likewise, multi-function actions also render single function phase schemes unworkable. A systematic analysis of individual behaviors during group processes must explain the simultaneous multiple functions of a single action. A FRAMEWORK FOR INDIVIDUAL ACTIONS As discussed earlier, "isn't six times two equal to twelve?" includes an evaluation (criticism), knowledge content (a new contribution), and an invitation for others to participate (question). It also includes politeness and validity dimensions. In this section, I explicate these five dimensions and show how they display interactive relationships among speakers. Dimensions of Individual Actions Building on the research discussed above, I propose that all individual actions include the following dimensions: (a) evaluation of the previous action, (b) politeness, (c) knowledge content, (d) validity and (e) invitational form. In this article, an individual action is a sequence of one person's words, motions, and/or drawings bracketed by pauses or falling intonations (in the case of words). Three examples of actions follow: (a) "what do we do next?" (b) shrugs his shoulders and (c) writes "3 x 5 = 15" on a sheet of paper. Evaluations Unlike most interactions previously studied in fine-grained detail such as narratives (Schegloff, 1997) or initiation-reply-evaluation (Mehan, 1979), group problem solving often involves mutually-contested information that highlight the importance of
  • 7.
    Analyzing Group WorkProcesses:… 7 evaluations. Because every problem solving action can be challenged, group members evaluate, at least implicitly, every speaker turn during group problem solving. The evaluation of the previous action dimension characterizes how the current speaker assesses the previous action and the current problem solving trajectory (Goodwin & Goodwin, 1987; Pomerantz, 1984) in one of three ways: agree, disagree, and ignore. After a person proposes an idea (for example, “two hours times six miles per hour is ten"), one can agree it entirely (+), reject at least part of it (-), or ignore it (0). Agreements (+) include acknowledgments ("yep"), justifications ("cause it only moves for two of the four hours"), criticisms of alternatives ("times four hours assumes it's always moving"), etc. Agreements tend to reinforce the direction of the current problem solving approach (Sacks, 1987). Moreover, they promote friendly social relationships through positive social face (Brown & Levinson, 1987), especially if the participants invest themselves in their ideas. Disagreement (-) identify errors ("twelve, not ten"), suggest related alternatives ("how about four hours times six?") or challenge the previous proposal ("why two hours?"). Disagreements tend to alter the problem solving trajectory by identifying flaws and developing alternatives. In addition, cognitive rejection of the idea can threaten psychological rejection of the person, especially without accompanying face-saving measures (Brown & Levinson, 1987). Ignoring or Unresponsive (0) actions do not evaluate the proposal at all and initiate new topics ("do we have a quiz tomorrow?"). Unresponsive actions draw the conversation away from the previous speaker's solution approach and may threaten social relationships. Unlike disagreements, unresponsive actions do not acknowledge the previous speaker, which in some contexts suggest that his or her proposal was unworthy of comment. So, if group members frequently respond to one person's unresponsive actions (to initiate new topics), their behaviors show that person's greater authority and control over the group. Some actions seem both responsive and neutral. For example, "let me think about that for a moment" and "finish your proposal first" seem like neutral evaluations because they postpone evaluation. When Chiu's (2000) high school students worked together however, they typically responded to seemingly neutral evaluations in the same way they responded to disagreements; they tried to persuade the neutral person. Neutral evaluations do not support the previous speaker's proposal. So, other members treated neutral evaluations as disagreements. Unlike disciplined members of structured decision- making processes, these members tended to agree or disagree quickly rather than listening to a variety of proposals before judging the merits of each. For skilled collaborators, an additional "neutral" category may be appropriate. Politeness Conversation participants seek to maintain a desirable public self-image or "face" (Goffman, 1959) and use an appropriate level of politeness to do so (Brown & Levinson, 1987). The politeness dimension characterizes the speaker's attempt to affect the face of
  • 8.
    Ming Ming Chiu 8 others.It ranges from face-promoting to neutral to face-threatening. Face-promoting (☺) actions improve the public self-image of others, "yes, two times six is right, giving us twelve," (a face-promoting disagreement). So, group members may use face-promoting actions to show respect, build friendship and minimize interpersonal conflicts. In contrast, face-threatening ( ) actions are impolite, "can't you even multiply two and six correctly to get twelve?" Unless the speakers are close friends, face-threatening acts signal psychological rejection of the person. So, listeners are tempted to reciprocate. If they do, a spiral of face-threatening actions can tear the social fabric and end the collaboration. Lastly, face-neutral ( ) actions do not strongly affect others' faces, "two hours times six miles per hour is twelve miles." Several factors affect the level of politeness used. These factors include relative power, social distance and degree of imposition (Brown & Levinson, 1987). A speaker typically addresses a more powerful listener politely; for example, secretaries usually speak politely to their bosses. So, speaker's level of politeness may reflect the existing status hierarchy or help create it during a status struggle (Bales, 1951). In the absence of a clear status hierarchy, speakers may use impolite behavior to stake a claim to higher status. Also, socially distant people, such as strangers, tend to speak in polite formalities. In contrast, close friends are less likely to be so polite (Schiffrin, 1984). They may even use face-threatening acts playfully (e.g., ritualistic insults [Goodwin, 1990]). Lastly, speakers often use polite language when imposing on the listener in some way, for example, asking for a favor. Knowledge The knowledge content dimension characterizes the problem knowledge displayed during the interaction and includes at least three possibilities: contribution, repetition, and null content. Contributions (C) are new problem solving ideas or actions introduced into the collaboration. They can be wrong and hence indicate moments of potential problem solving progress. Contributions include new goals, proposals, justifications, consequences, critiques, alternatives, etc. Tracing the contributions provides a map of the group's problem solving route. Meanwhile, repetitions (R) repeat the knowledge content of previous actions, not necessarily the immediately preceding action (Schegloff, 1996). Repetitions can indicate the speaker's level of understanding and degree of agreement. Finally, null content actions (N) do not include any problem content. They include acknowledgments ("mm-hmm"), simple evaluations ("no"), and general questions ("what?"). Because null actions are often brief, they can serve as back channel actions that provide feedback without interrupting the current speaker. (Null actions can be repeated, but they remain null actions, as repetitions repeat problem solving information.) The continuum of problem knowledge content runs through non-overlapping contributions, overlapping contributions, synonymous repetitions, partial repetitions, exact repetitions, and null actions. Consider each type of knowledge content in response to the phrase "two hours times six miles per hour." A non-overlapping contribution provides problem information without repeating any part of any previous action, for
  • 9.
    Analyzing Group WorkProcesses:… 9 example, “distance." In contrast, an overlapping contribution combines new information with information from a previous action, "so the train moves twelve miles in two hours." Repetitions include substantial reiteration of a previous action. Synonymous repetitions restate previous actions, "two hours multiplied by six miles per hour." Meanwhile, partial and exact repetitions repeat part or all of a previous action precisely, "two times six" (partial) and "two hours times six miles per hour" (exact). Null actions contain no problem content ("uh-huh"). Validity The validity dimension identifies an action as correct, wrong, or off-task. To the extent that a task is intellectual rather than judgmental, external observers can identify a group member's action as right or wrong. This identification process is much simpler for mathematical problems. All actions that include some part of the problem and are consistent with both the problem situation and with formal mathematics are coded as correct (√). Groups that solve the problem correctly should have a substantial portion of correct actions. All actions that are inconsistent with either the problem situation or with formal mathematics are coded as wrong (X). Finally, actions that are unrelated to the problem situation are coded as off-task (OT). This dimension identifies the relative accuracy of particular groups, individuals or talk during particular time periods. This dimension also helps distinguish between unsuccessful groups that made critical errors and those that were primarily off-task. Invitation to participate The invitational form dimension encourages participation from the audience to different degrees and also includes at least three possibilities: statements, questions, and commands. Statements (_.) declare information unintrusively without eliciting participation from others, “five times seven is thirty-four." In contrast, questions (?) invite audience participation somewhat intrusively by articulating an action/information gap for hem to fill, thereby requesting an action, problem information and/or an evaluation. Finally, commands (!) demand audience participation. Typical commands begin with verbs (with the audience as the implicit subject), "multiply two times six!" These three forms invite varying degrees of interaction within each property as well. Statements (_.) vary from low to high interactivity in the following ways: definitive vs. uncertain and summary vs. goal. Definitive statements discourage further discussion of what the speaker perceives to be a known truth ("two times six is twelve") while uncertain statements encourage input on the validity of the statement ("two times six seems like twelve"). Likewise, summary statements tend to close interactions by articulating what the group has already accepted ("so we got twelve miles by multiplying two hours and six miles per hour") whereas goal statements encourage interaction by presenting a target towards which the group can work ("we need to find the distance"). In
  • 10.
    Ming Ming Chiu 10 short,definitive summaries, definitive goals, uncertain summaries, and uncertain goals are all statements, but invite increasing audience participation. Rhetorical, tag, choice, open, and directive questions (?) also invite different degrees of interaction. Although the form of a rhetorical question invites responses ("can't you do anything right?"), the speaker knows the answer and does not expect a response. Tag questions follow statements and anticipate simple acknowledgments, "two times six is twelve, right?" Meanwhile, choice questions offer multiple possibilities from which the audience can select, "should we add or multiply?" When speakers ask open questions, they do not restrict the answers and invite a greater variety of responses, "what should we do next?" Finally, directive questions expect audience implementation of a proposal, "can you compute the speed?" Rhetorical, tag, choice, open, and directive questions invite successively greater degrees of interaction. Finally, people can invite different degrees of participation using open, closed or halt commands (!). Open commands request general input from the audience, "give me your opinion," whereas closed commands specify particular actions, "measure the length of the box." Although most commands demand audience action, halt commands demand audience inaction, for example, “wait!" As a result, halt commands are less invitational than statements as they discourage participation. Halt commands disagree (-) and have null knowledge content (N) that distinguish them from other commands (!). So, they can be analyzed as a separate unit (-N!). Open and detailed commands demand audience participation, but halt commands demand audience inaction. Collaborators invite audience participation in increasing degrees from halt commands to statements to questions to non-halt commands. Interactive Properties of Individual Actions The evaluation, politeness, knowledge content, and invitational form dimensions capture interactive properties. Because evaluations look backward into the past at the previous utterance, they help glue together individual actions to form a coherent conversation. Collaborations in which participants are highly responsive toward one another have more evaluations (supportive [+] or critical[-]). Meanwhile, speakers often reciprocate politeness levels to reflect their social relationships. While contributions help trace the group's problem solving paths, repetitions of other speakers display areas of perceived-shared understanding (Halliday & Hasan, 1976). The invitational form dimension mirrors the evaluation dimension and projects forward into the future by inviting audience participation to different degrees. Together, evaluations, politeness levels, repetitions and invitational forms link adjacent actions to help create coherent interactions and allow quantitative tests of collaboration quality. 2.4 Relating roles, strategies and individual actions This classification captures the simultaneous multiple effects of an individual action that theoretical constructs such as roles and strategies can not. To explicate the relationship between individual actions, roles and strategies (see Table 1), recall my
  • 11.
    Analyzing Group WorkProcesses:… 11 earlier discussion in the Table 1. Relationships between collaboration roles, strategies, and individual actions. Each role includes particular strategies that collaborators can implement through specific actions. Role Strategy Individual Action Proposal New Idea Contribution (C) Supporter Show Benefits Supportive Contribution (+C) Elaborate Idea Supportive Contribution (+C) Critic Show Flaws Critical Contribution (-C) Alternative Idea Critical Contribution (-C) Facilitator Invite participation Question (?) Command (!) Monitor progress Agree (+) Disagree (-) Softening criticism Disagreeing politely (-☺), disagreeing via a question (-?), or both (-☺?) Balance support and criticism Adjacent Agreements (+) and Disagreements (-) introduction. Roles include proposer, supporter, critic and facilitator. A proposer can suggest new ideas through contributions (C). In response, supporters can show their benefits and elaborate them with supportive contributions (+C). Critics can show flaws and provide alternatives with critical contributions (-C). A facilitator can invite participation through questions (?) and commands (!) and monitor group progress through supportive (+) and critical (-) evaluations. To promote group harmony, facilitators can balance adjacent supportive and critical actions (+ and -) and soften a disagreement by promoting face (-☺) or by asking it as a question (-?). Application of Framework This multi-dimensional framework organizes 243 (35 ) mutually exclusive and exhaustive categories. So, researchers can use it for standard statistical analyses. For example, Chiu (2000) used parts of it to examine the effects of status at the group,
  • 12.
    Ming Ming Chiu 12 individualand turn levels. At the group level, he estimated the effects of the group's actions (along with status and other variables) on solution score. In particular, he showed that average mathematics grade, face promoting criticisms (-☺, % of total criticisms) and correct actions (%) predicted solution score. However, contributions (%) and repetitions (%) did not. At the individual level, Chiu (2000) estimated predictors of perceived leadership. He showed that social status positively predicted perceived leadership. Meanwhile, the individual ratio of face-promoting to total criticisms negatively predicted it. However, correct actions (%), contributions (%), and repetitions (%) did not. Lastly, he tested evaluation distortions using lagged variables to predict agreement (at time T) of the previous speaker turn (at time T-1). He found that the previous turn's correctness (at T-1) predicted agreement (at T). However, the previous speaker's mathematical grade (at T-1) and social status (at T-1) both positively distorted the evaluation. This turn level analysis had several shortcomings addressed by the new methodology described below A NEW STATISTICAL METHOD: DYNAMIC MULTILEVEL LOGIT This section outlines a statistical method that addresses the problems that often occur during analyses of group processes (see Chiu & Khoo [2000] for details). This method combines multilevel analysis, a discrete outcome variable (Logit), break point estimation and time-series analysis. Difficulties During Analyses of Group Processes Statistical models of group processes at the speaker turn/utterance level are problematic in at least six ways. 1) Coding difficulties reduce both inter-coder reliability and the precision of parameter estimates. 2) Data is often collected from different groups (group heterogeneity). So, each group can show different effects (Goodman, Ravlin & Schminke, 1987). 3) Group members' behaviors at the beginning of a problem solving session can differ from those at the end, a.k.a. time period heterogeneity (Dabbs & Ruback, 1987). Thus, each time period can show different effects (Goodman et al., 1987). 4) Deciding how to divide each session into different time periods is difficult. The number and locations of "break points" in a session must be estimated. 5) The outcome variables (e.g., correctness, agreement) are often discrete rather than continuous. 6) Time series data is often serially correlated − variables depend on values from earlier turns. If not modeled properly, serial correlation in the errors can bias the
  • 13.
    Analyzing Group WorkProcesses:… 13 model estimates. Past Methods Past studies have not addressed all of these difficulties. Those studies typically used one of three methods: case studies, sequential analysis and/or ordinary least squares (OLS) regressions. Each of these methods has significant problems and restrictions. During exploratory pilot studies with a few groups, detailed case studies can provide useful insights. However, case studies can not test the generality of hypotheses across many groups. Some researchers have used sequential analyses of Markov chains (Gottman & Roy, 1990; Pavitt & Johnson, 1999; Stasser & Davis, 1981). Standard sequential analyses assume that the outcome variable be homogeneous across both groups and time periods (Gottman & Roy, 1990). However, these assumptions are often violated. Groups often differ. Effects can change over time. Other researchers simply used OLS (e.g., Chiu, 2000), ignoring problems 2 to 6 and obtaining inefficient and biased estimates. This article briefly discusses coding before introducing a new statistical method that addresses all of the above difficulties. Then, I re-analyze Chiu (2000)'s data for more precise estimates of evaluation distortion. Coding The Dimensions Of Group Processes The usefulness of any statistical analysis depends on the quality of the coding scheme. A coding framework for statistical analyses of group processes should have mutually exclusive and exhaustive categories. These categories should both cover all the relevant data and capture their complexity. However, the complexity of these coding schemes often reduces inter-coder reliability and precision of parameter estimates. Multi- dimensional coding schemes address these difficulties. Complex coding scheme difficulties A complex coding scheme with mutually exclusive and exhaustive categories often includes many categories. The large number of categories can contribute to lower inter- rater reliability. As the number of codes rises, training time, coding time and coding conflicts also tend to rise. Coding conflicts reduce the inter-coder reliability. Moreover, the large number of categories can also reduce statistical precision. Creating a model with N categories of behaviors typically requires N-1 binary variables (for explanatory variables). Models with more explanatory variables also have fewer available degrees of freedom. Using a model with excessive variables can sharply reduce the precision of the parameter estimates. Such models are also more likely to have multi- collinearity, especially among variables for categories of rare behaviors. Both excessive explanatory variables and multi-collinearity can reduce the precision of the estimates.
  • 14.
    Ming Ming Chiu 14 Multi-dimensionalcoding A coding scheme with many dimensions can capture the data's complexity. At the same time, it can avoid sharp falls in inter-coder reliability and parameter estimate precision. In the above framework, there are up to 243 actions (35 , 5 dimensions, each with 3 categories). By coding one dimension at a time, a coder chooses among only 3 possible codes (instead of 243). Thus, training and coding time is shorter. Likewise, inter-coder reliability likely improves. Parameter estimates will likely be more precise as well. Instead of 242 binary variables (243 - 1), only 10 binary variables are needed (3 - 1 or 2 per dimension, 2 × 5 = 10). Thus, the model will have fewer degrees of freedom. Moreover, specific rare behaviors are now combinations of variable values. So, they are less likely to cause multi-collinearity problems. As a result, this model with fewer explanatory variables and likely less multi-collinearity probably has more precise parameter estimates. In short, using multiple dimensions retains the categories’ complexity, helps check for mutually exclusive codes, likely improves inter-coder reliability and improves the precision of parameter estimates. Multilevel Analysis Multilevel analysis techniques (Goldstein, 1995) address group-specific and time period-specific effects (heterogeneity). (This method is also called hierarchical linear modeling or HLM [Bryk & Raudenbush, 1992]). A multilevel model estimates the relationship between an outcome variable and sets of explanatory variables defined at different units of analysis (or levels). For example, a person's turn of talk occurs within a specific time period within a particular group. These different levels (turn of talk, time period, group) are nested in a hierarchical structure. Logit and Multilevel Models We often use binary outcome variables to estimate the probability of observing or not observing an event. For example, in our models of group processes we can estimate the likelihood of agreeing with the previous speaker or not. The standard method for modeling binary outcome variables is to use Logit models (see Greene [1997] for a discussion of multinomial and ordered regressions) Estimating Break Points to Identify Different Time Periods Group processes occur over time. So, group process data are time series data. As
  • 15.
    Analyzing Group WorkProcesses:… 15 group processes can change over time, modeling it accurately may require different parameter estimates for each time period. For example, people might agree more often at the end of a problem solving session than at the beginning of one. They might disagree often until they find a correct method (a "break point" in the session). Afterwards, they are likely to agree more often. These time period differences can be addressed by dividing the data into different time periods, and using multilevel analysis to model the time period differences. However, we face the problem of identifying exactly how the sessions are divided into different time periods. We must estimate the number and locations of the break points in the time series data. Maddala and Kim (1998) provide a comprehensive discussion of the estimation of unknown break points. They view the estimation of an unknown number of break points as a model selection problem. Assuming a finite number of break points, we create models for different combinations of locations of break points. Choosing the model that minimizes the Bayesian information criterion (BIC) identifies the appropriate break points. Serial Correlation of Residuals In time series data, events are often very similar to recent events, a.k.a. serial correlation of residuals. For example, in the application (in section 5 below), agreement tends to occur in "clumps." Conversations move between topics where speakers tend to concur and topics where they do not. If time series effects are not modeled properly, serial correlation in the data can seriously bias parameter estimates. When residuals are serially correlated, parameter estimates are often not efficient, and estimates of the parameters' standard errors are biased. Ljung-Box (1979) Q-statistics are used to test for serial correlation of the residuals. APPLICATION: PREDICT AGREEMENT This application re-analyzes data transcribed from 20 group work sessions in Chiu (2000). We examine which variables distort the evaluation of the previous speaker's idea. Hypotheses As noted earlier, properly evaluating one another's ideas is critical to reaching the optimal group decision or solution. So, anything that distorts evaluations of ideas is undesirable. In an ideal world, correctness should be the only predictor of agreement. However, other factors such as status, politeness and recent agreements can also affect
  • 16.
    Ming Ming Chiu 16 agreement.Controlling for the correctness of the previous speaker, his/her past achievement in the same problem area (achievement status) can also affect other's evaluations of the immediate idea. Thus, we expect past mathematics grade to distort agreement when a group works on a mathematics problem. Additionally, rude comments such as unresponsive behavior and rude disagreements threaten face. Thus, group members are more likely to be defensive and hence less likely to agree with the rude person. Finally, agreement in recent turns may also predict future agreement because previous agreements are likely to build a common knowledge base for agreement in the following turns. Therefore, it is likely that the: ♦ Previous speaker’s correctness predicts agreement. ♦ Previous speaker’s achievement status predicts agreement. ♦ Previous speaker’s politeness predicts agreement. ♦ Agreement in recent turns predicts agreement. Method Data The data consisted of 80 middle school students’ grades and transcribed videotapes. These students worked in 20 groups of 4 on an algebra word problem. The lowest unit of analysis is a speaker's turn in the group's conversation. The transcribed videotapes included 3104 speaker turns of conversation. Turn-level variables and individual-level variables predicted the outcome variable AGREE. All turn-level explanatory variables occur before the turn of the outcome variable. So, time constrains the direction of causality. Each speaker turn was coded for the following: correctness, mathematics status, and evaluation of the previous speaker. A speaker’s mathematics status was computed as his or her mathematics grade minus his or her group’s mean mathematics grade. Evaluations included agreement, impolite disagreement, polite disagreement, neutral actions and ignoring the previous speaker. So, our model included the following variables: CORRECT, MATH STATUS, RUDELY DISAGREE, IGNORE and AGREE. J. Cohen's (1960) kappa tested inter-rater reliability. Restating the hypotheses in terms of these variables, we have the following (lags in parentheses): ♦ CORRECT 1 to 4 turns earlier (-1, -2, -3, -4) positively predict AGREE in the current turn (0). ♦ MATH STATUS (-1...-4) positively predict AGREE (0). ♦ AGREE (-1...-4) positively predict AGREE (0). ♦ RUDELY DISAGREE (-1...-4) negatively predict AGREE (0). ♦ IGNORE (-1...-4) negatively predict agreement. (0)
  • 17.
    Analyzing Group WorkProcesses:… 17 Analysis The analysis proceeded in the following order. First, we identified the time periods and break points using the method outlined in Maddala & Kim (1998). Second, we tested for heterogeneity across groups and across time periods with a variance components model. Third, the multilevel Logit models were estimated using the software MLn. Fourth, we tested for residual serial correlation with Q-statistics. (A lagged outcome variable, agree[-1] was sufficient to eliminate the serial correlation.) Fifth, we estimated the effect sizes for each explanatory variable with sequential (or hierarchical) regressions (see J. Cohen & P. Cohen, 1983). Lastly, we tested for direct and indirect effects using path analysis (see J. Cohen & P. Cohen, 1983). Identify the different time periods. Conditions change over time. So, a model's parameters might differ according to the time period. People might agree more often at the end of a problem solving session than at the beginning of one. They might disagree regularly until they find a correct method (a "break point" in the session). Afterwards, they are likely to agree more often. So, for each group's data, we estimate the number and locations of break points that divide the outcome variable AGREE into distinct time periods. Maddala & Kim (1998) outlines a method for identifying the number and locations of break points in a time series. First, we identify an appropriate time series model for the variable AGREE. Introducing explanatory variables into the model this early might raise the difficulty of rejecting the null hyphothesis of no break points –even if they exist in the full model (type II error). So, we used a time series model without any explanatory variables to identify break points. We identified the appropriate autoregressive model to use by minimizing the BIC. This was done for all the groups. We found that most groups can best described by an AR(1) model. Yt = C + Yt-1 + ε Next, we identified the break points. We assumed a maximum number of 5 break points (or 6 time periods). (Assuming more would have been too computationally intensive. Testing for an additional break point exponentially increases the computation time.) We calculated the BIC for all possible locations of those break points in the time series. This was done for all possible numbers of break points (0-5). The number and locations of break points that minimized the BIC was chosen as the best estimate. Heterogeneity of groups or time periods? Next, we used a variance components test to check if the outcome variable, AGREE, significantly varied across groups or time periods. If it does for both, both groups and time periods are heterogeneous. Then, a 3- level model would be needed. In this 3-level model, speaker turns (level 1) are nested within time periods (level 2) which are nested within each group (level 3). Estimate model. We used multilevel Logit regressions to estimate a general time series model. These regressions were run using the software MLn. The model included
  • 18.
    Ming Ming Chiu 18 allexplanatory variables and lagged variables up to order 4. If groups or time periods are heterogeneous, explanatory variable effects on agreement can vary across groups or across time periods. So, we estimated the variations of the explanatory variables’ effects across groups and across time periods. We included significant group and time period variations in the model. Next, we tested the significance of the explanatory variables, both as sets and individually. We removed the non-significant ones. For binary outcome variables, the likelihood ratio test is not reliable. So, we used Wald tests instead (Goldstein, 1995). Non-significant variables were removed in the following order: higher order lagged turn variables first (-4, then -3, then -2, then -1), then speaker variables. This yielded the final model. Serial correlation of residuals? We used Ljung-Box (1979) Q-statistics to test for serial correlation (up to order 4) in the residuals for all 20 groups. If the residuals are not serially correlated, then the model is likely an adequate time-series model. Also, the estimates would likely be unbiased. Effect sizes. We estimated the effect sizes of each explanatory variable in the final model with sequential, multilevel Logit regressions. Recent events are more likely than earlier events to affect agreement in the current turn. So, we entered the explanatory variables in reverse temporal order into the sequential, multilevel Logit regressions. Direct and indirect effects. Lastly, we tested for direct and indirect explanatory variable effects with a path analysis. Temporal order constrains causal relationships, so the final model's explanatory variables were entered in temporal order into the path analysis. All results were significant at the .05 level. Results and Discussion Overall, 72% of the on-task turns were correct. Evaluations included 54% agreements, 0.3% neutral, 16% ignore/unresponsive turns, 18% polite disagreements and 9% rude disagreements (Cohen's kappa = .93, z = 49.5, p < .001). Identify different time periods The estimation of break points yielded 1 to 4 breakpoints for each group. This resulted in 2 to 5 time periods for each group. Heterogeneity of groups or time periods? The variance components model showed significant variation of AGREE at both the group level (0.14 [standard error = 0.05]) and the time period level (0.06 [0.02]). So, the
  • 19.
    Analyzing Group WorkProcesses:… 19 groups and the time periods are both heterogeneous with respect to AGREE. Thus, a 3- level multilevel Logit model is needed (speaker turn, time period and group). Of the total AGREE variance, 12% occurs at the group level, and 5% occurs at the time period level. Estimate model None of the variances of the explanatory variables’ coefficients were significant at the either the group or time period level. This result suggests that the explanatory variables’ effects on agreement are general across groups and across time periods. After testing nested hypotheses of successive deletions of non-significant explanatory variables (with χ2 log likelihood), the same significant explanatory variables remain (see table 2). The following properties of previous speakers positively predicted agreement (lags in parentheses): CORRECT (-1), MATH STATUS (-1) and AGREE (-1). Meanwhile, IGNORE (-1) and RUDELY DISAGREE (-1, -2, -3) negatively predicted agreement. So, correctness predicts agreement. However, status, recent agreement and rudeness also distorted agreement. Members' evaluations were distorted towards higher mathematical status members. Their evaluations were also distorted toward those who had agreed earlier. In contrast, their evaluations were distorted against those who behaved rudely –those who ignored others or who disagreed rudely. RUDELY DISAGREE showed the strongest and longest lasting effects. The coefficients for RUDELY DISAGREE (-1) and (-3) were the largest, exceeding even CORRECT (-1). Thus, RUDELY DISAGRE tended to trump CORRECT. RUDELY DISAGREE also affected the likelihood of AGREE 3 turns later whereas the other effects only lasted 1 turn. Serial correlation of residuals? The Q-statistics of the final model showed no significant serial correlation of residuals in any of the 20 groups. So, the model estimates are likely unbiased. Effect sizes The sequential multilevel Logit regressions showed that these explanatory variables explained 62% of the group variation and 87% of the time period variation. CORRECT (-1) explained surprisingly little of the variance. It explained at most 26% of the group variance and 4% of the time period variance. Meanwhile prior evaluations accounted for more of the group variance (at least 32%) and most of the time period variance (at least 79%).
  • 20.
    Analyzing Group WorkProcesses:… Table 2. Mutlilevel Logit regression predicting agreement Regressions Explanatory variable 1 2 3 4 5 6 Right(-1) 0.445 *** 0.438 *** 0.476 *** 0.426 *** 0.429 *** 0.429 *** 0.084 0.084 0.085 0.086 0.086 0.086 Relative Math Grade (-1) 0.011 * 0.011 * 0.010 * 0.009 * 0.009 * 0.005 0.005 0.005 0.005 0.005 Agree (-1) 0.619 *** 0.333 ** 0.313 ** 0.306 ** 0.079 0.105 0.105 0.105 Responsive(-1) 0.313 * 0.315 * 0.304 * 0.132 0.132 0.132 Naked disagreement (-1) -0.819 *** -0.779 *** -0.757 *** 0.160 0.161 0.161 Naked disagreement (-2) -0.411 ** -0.345 * 0.136 0.138 Naked disagreement (-3) -0.568 *** 0.138 Log likelihood 4051 4034 3988 3954 3942 3920 Explained group variance 33% 35% 55% 51% 53% 55% Explained time period variance 4% 7% 38% 39% 43% 49% Note: Number of observations = 3104 *p < .05, **p < .01, ***p< .001
  • 21.
    Analyzing Group WorkProcesses:… 21 Direct and indirect effects Lastly, the path analyses showed that all of these explanatory variables showed both total and direct effects (see figure 1). Rude disagreements and mathematical status also showed indirect effects. Earlier rude disagreements (-2, -3) positively predicted later rude disagreements (-1) and negatively predicted AGREE (-1). This reciprocation increased the likelihood of a spiral of naked disagreements that could threaten the collaboration. Meanwhile MATH STATUS (-1) positively predicted IGNORE (-1) and negatively predicted RUDELY DISAGREE (-1). To test if group members distorted their evaluations, Chiu (2000) used a simple Logit to predict agreement at time T from the previous speaker's (T-1) correctness, mathematics grade and social status. This re-analysis includes other variables and from earlier turns while adjusting for heterogeneous group effects, heterogeneous time period effects and serial correlation of the residuals. Mathematics status is now a significant predictor whereas mathematics grade and social status are not. Furthermore, earlier rude disagreements, agreements, and unresponsive (ignore) turns in addition to correctness predict agreement. CONCLUSION To help consider why some groups solve problems successfully but others do not, this article introduces a framework and a methodology for statistical analyses of many group interactions both in fine detail and in their entirety. Organizing individual action properties along dimensions allows for mutually exclusive categories without sacrificing multiple functions. Furthermore, the dimensional simplicity increases the tractability of coding for large sample-size statistical analyses both at and among the levels of (1) action, (2) individual and (3) group activity. These dimensions also provide possible quantitative measures of collaborative quality. The new methodology, dynamic multilevel analysis, solves all six difficulties associated with dynamic analyses of time series data. The multi-dimensional coding framework simplifies coding, reduces errors and increases the precision of model estimates. Break point identification specifies the number and locations of breakpoints that divide the data into appropriate time periods. The multi-level component solves the problems of potential group and time period heterogeneities. Logit allows for discrete outcome variables. Lastly, time-series analysis tests for serial correlation of residuals and if necessary, models them.
  • 22.
    Ming Ming Chiu 22 Figure1. Multilevel Logit path analysis of predictors of agreement with the previous speaker Limitations This individual action framework does not capture fine gradations within each category and omits the influence of many factors. For example, a simple addition such “two plus one is three" and a novel representation that frames the solution to a problem can both be contributions, but their impacts on the collaboration differ. This framework omits the influence of many micro-level factors (such as prosody, rhythm and silence). Adding micro-level elements can provide additional information for researchers to improve their interpretation of interactional data. (See Auer & di Luzio [1992] and Gumperz [1978] for discussions of prosody and rhythm and Schegloff [1995] for ways to analyze silence.) This macro-level factors (such as relationship histories, physical environments, and societal/cultural expectations). Also, the shared history between people who know each other provides common knowledge and psychological expectations that strangers lack. Thus, a person may interpret and respond to a friend's action differently than to an identical action by a stranger (Goodwin, 1990; Schiffrin, 1984). The physical .01* - .56** -.46*** .01* -.57*** .31** Math Status (-1) Rudely disagree (-3) Rudely disagree (-2) Ignore (-1) Rudely disagree (-1) Agree (-1) Agree (0) -.30* -.76*** -.35* -.01* 1.12*** .43*** Correct (-1) 1.12***
  • 23.
    Analyzing Group WorkProcesses:… 23 environment can also influence collaborations through its resources and its history of expectations (Hutchins, 1995). Using physical resources such as rulers or calculators for instance, students can solve many more problems than they can without them. Furthermore, collaborators are likely to behave differently based on their experience with a particular location (Lave, 1983). For example, they may say and do things at their friend's house that they would not do in class or in a library. Finally, societal and cultural expectations may influence social interactions. As discussed above, societal expectations in public places constrain our behavior. People can also conform to (or intentionally violate) norms in other cultures when interacting with a person perceived to hold those values and beliefs (Gumperz, 1978). Future research These classifications of individual actions and this new methodology enable testing of several hypotheses. Do highly collaborative groups show more agreements, disagreements, contributions, repetitions, or questions? Can one or more of the individual action dimensions be used to create a quantitative operational definition of collaboration? Do particular individual actions increase the likelihood of other individual actions? Do particular patterns of individual actions predict successful problem solving? Moreover, adding dimensions and elaborating existing ones can improve this individual action framework. Other important dimensions may include properties of voice, gestures, facial expressions, etc. Furthermore, we can expand existing dimensions. For example, we can subdivide contributions (C) into specific types such as computation, metaphor, synthesis, etc. Research combining dynamic multilevel Logit (DML) and structural equation modeling (SEM) may help extend DML to DML-SEM. DML-SEM would allow for estimates of measurement errors through multiple measures. It would also allow estimates of unobserved continuous variables. By addressing these questions and improving their methods, researchers can help group members understand and improve their group problem solving. REFERENCES Allport, G. (1954). The nature of prejudice. Cambridge, MA: Addison. Anderson, J. R. (1985). Cognitive psychology and its implications New York: Freeman. Asch, S.E. (1952). Social Psychology. Englewood Cliffs, NJ: Prentice Hall. Auer, P, & di Luzio, A. (1992). The contextualization of language. Amsterdam: John Benjamins. Bales, R. F. (1951). Interaction process analysis. Cambridge, MA: Addison-Wesley. Bales, R. F., & Strodtbeck, F. L. (1951). Phases in group problem-solving. Journal of Abnormal and Social Psychology, 46, 485-495.
  • 24.
    Ming Ming Chiu 24 Bales,R.F. (1953). The equilibrium problem in small groups. In T. Parsons, R.F. Bales, & E.A. Shils (Eds.) Working papers in the theory of action (pp.444-476). Glencoe, IL: the Free Press. Barnes, D., & Todd, F. (1977). Communication and learning in small groups. Boston: Routledge. Berger, J., Cohen, B. P., & Zelditch, M. (1972). Status characteristics and social interaction. American Sociological Review, 37, 3, 241-256. Box, G. E. P., & Jenkins, G. M. (1976). Time series analysis: Forecasting and control. 2nd Edition. New York: Holden-Day. Boyd, R. D. (1991). Personal transformation in small groups. Boston: Routledge. Braun, H. I., Jones, D. H., Rubin, D. B., & Thayer, D. T. (1983). Empirical Bayesian estimation of coefficients in the general linear model from data of deficient rank. Psychometrika, 489, 2, 171-181. Brown, P., & Levinson, S. (1987). Politeness: Some universals in language usage. Cambridge: Cambridge University Press. Bryk, A. S., & Raudenbush, S. W. (1992). Hierarchical linear models: Applications and data analysis methods. Newbury Park: Sage. Burgoon, J. K., Dillman, L., & Stern, L. (1993). Adaptation in dyadic interaction: Defining and operationalizing patterns of reciprocity and compensation. Communication Theory, 3, 295-316. Burke,P. (1974). Participation and leadership in small groups. American Sociological Review 39, 832-843 Burnstein, E., & Vinokur, A. (1977). Persuasive argumentation and social comparison as determinants of attitude polarization. Journal of Experimental Social Psychology, 13, 315-332. Cazden, C. B. (1988). Classroom discourse: The language of teaching and learning. Portsmouth, NH : Heinneman. Chiu, M. M. (1997a). Building mathematical understanding during collaboration: Students learning functions and graphs in an urban, public high school. Dissertation Abstracts International, 58-02a, 383. (University Microfilms No. AAI97-22908). Chiu, M. M. (1997b). Building on diversity: A moment-to-moment analysis of students collaboratively solving mathematics problems. Los Angeles: University of California, Los Angeles. (ERIC Documentation Reproduction Service No. ED 410 325). Paper presented at the Annual Meeting of the American Educational Research Association. New York, NY. Chiu, M. M. (2000). Status effects on solutions, leadership, and evaluations during group problem solving. Sociology of Education, 73, 3, 175-195. Clark, H. H., & Brennan, S. E. (1991). Grounding in communication. In L. B. Resnick, J. M. Levine, & S. D. Teasley (Eds.), Perspectives on socially shared cognition (pp. 127-149). Washington, D.C.: American Psychological Association. Cohen, E. G. (1982) Expectation States and Interracial Interaction in School Settings. Annual Review of Sociology, 8, 109-235. Cohen, E. G. (1984). Talking and working together: Status interaction and learning. In P. Peterson, L. C. Wilkinson, & M. Hallinan (Eds.) Instructional groups in the
  • 25.
    Analyzing Group WorkProcesses:… 25 classroom: Organization and processes. (pp. 171-188). Orlando: Academic. Cohen, E. G. (1994a). Restructuring the classroom: Conditions for productive small groups. Review of Educational Research, 64, 1, 1-35. Cohen, E. G. (1994b). Designing Groupwork: Strategies for the heterogeneous classroom. 2nd ed. New York: Teachers College Press. Cohen, J. & Cohen, P. (1983). Applied Multiple Regression/Correlation Analysis for the Behavioral Sciences. Hillsdale, NJ: Erlbaum. Cohen, J. (1960). A coefficient of agreement for nominal scales. Educational and Psychological Measurement, 20, 37-46. Dabbs, J.M. Jr., &Ruback, R.B. (1987) Dimensions of group process: Amount and structure of vocal interaction. In L. Berkowitz (Ed.) Advances in experimental social psychology Vol. 20, (pp.123-169). San Diego: Academic Press. Dembo, M. H. & McAuliffe, T. J. (1987). Effects of perceived ability and grade status on social interaction and influence in cooperative groups. Journal of Educational Psychology, 79, 415-423. Dodge, K A., Asher, S. R., & Parkhurst, J. T. (1989). Social Life as a Goal- Coordination Task. Research on Motivation in Education, 3, 107-135. Doise, W.,& Mugny, G. (1984) The social development of the intellect. Oxford, England: Pergamon. Fisek, M., Berger, J., & Norman, R. (1991). Participation in heterogeneous and homogeneous groups: A theoretical integration. American Journal of Psychology, 97, 114-142. Forman, E. & Cazden, C. B. (1985). Exploring Vygotskian perspectives in eduation: the cognitive values of peer interaction. In J. Wertsch (Ed.), Culture, Communication and Cognition. Cambridge: Cambridge University Press. Gersick, C. J. G. (1988). Time and transition in work teams: Toward a new model of group development. Academy of Management Journal, 31, 9-41. Goffman, E. (1959). The presentation of self in everyday life. Garden City, NY: Doubleday. Goldstein, H. (1995). Multilevel statistical models. Sydney: Edward Arnold. Goldstein, H., & Rasbash, J. (1996). Improved approximations for multilevel models with binary responses. A Journal of the Royal Statistical Society, 159, 505-13. Goodman, P. S. (1979). Assessing Organizational Change: The Rushton quality of work experiment. New York: Wiley. Goodman, P.S., Ravlin, E., Schminke, M. (1987). Understanding groups in organizations. Research in Organizational Behavior, 9, 121-173. Goodwin, C. & Goodwin, M. H. (1987). Concurrent operations on talk: Notes on the interactive organization of assessments. IPRA Papers in Pragmatics, 1, (1), 1-54. Goodwin, M. H. 1990. He-said-she-said: Talk as social organization among black children. Bloomington: Indiana University Press. Gottman, J. M. & Roy, A. K. (1990). Sequential analysis: A guide for behavioral researchers. New York: Cambridge University Press.
  • 26.
    Ming Ming Chiu 26 Grasa,A. A. (1989). Econometric model selection: A new approach. Dordrecht: Kluwer. Green, S. B. (1991). How many subjects does it take to do a regression analysis? Multivariate Behavioral Research, 26, 499-510. Greene, William H. (1997). Econometric analysis. 3rd edition. New York: Prentice- Hall. Gumperz, J. J. (1978). Dialect and conversational inference in urban communication. Language in Society, 7, 3, 393-409. Hackman, J. R., & Morris, C. G. (1975). Group tasks, group interaction process, and group performance effectiveness: A review and proposed integration. In L. Berkowitz (Ed.), Advances in experimental social psychology, Vol. 8, (pp. 45-99). New York: Academic Press. Halliday, M. A. K., & Hasan, R. (1976). Cohesion in English. London : Longman. Hastie, R. (1986). Experimental evidence on group accuracy. In B. Grofman & G. Owen (Eds.), Information pooling and group decision making (pp. 129-157). Greenwich, CT: JAI. Hinsz., V. B.(1990). Cognitive and consensus processes in group recognition and memory performance. Journal of Personality and Social Psychology 59, 705-718. Hirokawa, R. Y. (1983). Group communication and problem-solving effectiveness: An investigation of group phases. Human Communication Research, 9, 291-305. Hoffman, R.L. (Ed.). (1979). The group problem solving process: Studies of a valence model. New York: Praeger. Hollander, E. P. (1958). Conformity, status, and idiosyncrasy credit. Psychological Review, 65, 117-127. Hollander, E. P. (1964). Leaders, groups, and influence. New York: Oxford University Press. Hutchins, E. (1995). Cognition in the wild. Cambridge, MA: MIT press. Johnston, Jack & DiNardo, John (1997), Econometric methods (4th ed.). New York: McGraw-Hill. Kagan, S. (1992). Cooperative Learning. San Juan Capistrano, CA: Resources for Teachers. Kenney, D. A. (1994). Interpersonal perception: A social relations analysis. New York: Guilford. Kerr, N. L. (1981). Social transition schemes: Charting the road to agreement. Journal of Personality and Social Psychology, 41, 684-702. Kerr, N.L., & Watts, B.L. (1982). After division, before decision: Group faction size and predeliberation thinking. Social Psychology Quarterly, 45, 198-205. Kerr, N.L.,&Brunn, S.E.(1983). The dispensability of member effort and group motivation losses: Free-rider effects. Journal of Personality and Social Psychology, 44, 78-89. Kirchmeyer, C. (1993). Multicultural task groups: An account of the low contribution level of minorities. Small Group Research, 24, 127-148.
  • 27.
    Analyzing Group WorkProcesses:… 27 Larson, J. R., Jr., Foster-Fishman, P. G., & Keys, C. B. (1994). Discussion of shared and unshared information in decision-making groups. Journal of Personality and Social Psychology, 67, 446-461. Laughlin, P. R. (1999). Collective Induction: Twelve Postulates. Organizational Behavior and Human Decision Processes, 80, 1, 50-69. Laughlin, P. R., & Hollingshead, A. B. (1995). A theory of collective induction. Organizational Behavior and Human Decision Processes, 69, 265-275. Laughlin, P. R., VanderStoep, S. W., & Hollingshead, A. B. (1991). Collective versus individual induction: Recognition of truth, rejection of error, and collective information processing. Journal of Personality and Social Psychology, 61, 50-67. Laughlin, P.R., & Ellis, A.L. (1986) Demonstrability and social combination processes on mathematical intellective tasks. Journal of Experimental Social Psychology, 22, 177-189. Lave, J. (1983). Cognition in practice: Mind, mathematics, and culture in everyday life. New York: Cambridge University Press. Levine, J. M., & Thompson, L. (1996). Conflict in groups. In E. T. Higgins & A. W. Kruglanski (Eds.), Social psychology: Handbook of basic principles (pp. 745-776). New York: Guilford. Levine, J. M.,& Thompson, L. (1996). Conflict in groups: In E.T. Higgins &A.W. Kruglanski (Eds.), Social Psychology: Handbook of basic principles (pp.745-776) New York: Guilford. Liang, D. W., Moreland, R., & Argote, L. (1995). Group versus individual training and group performance: The mediating role of transactive memory. Personality and Social Psychology Bulletin, 21, 384-393. Ljung, G. & Box, G. (1979). On a measure of lack of fit in time series models. Biometrika, 66, 265–270. Lott, A. J. & Lott, B. E. (1965). Group Cohesiveness and individual learning. Journal of Educational Psychology, 75, 877-888. Lütkepohl, H. (1985). Comparison of criteria for estimating the order of a vector autoregressive process. Journal of Time Series Analysis, 6, 35-52. Maddala, G. S. and Kim, I.M. (1998), Unit roots, cointegration and structural change. New York: Cambridge University Press. Mehan, H. (1979). Learning lessons: Social organization in the classroom. Cambridge, MA: Harvard. Papastamou, S.C. (1986). Psychologization and processes of minority and majority influence. European Journal of Psychology 16, 165-180 Parker, K. (1988). Speaking turns in small group interaction: A context-sensitive event sequence model. Journal of Personality and Social Psychology, 54, 965-971. Pavitt, C., & Johnson, K. K. (1999). An examination of the coherence of group discussions. Communication Research, 26, 3,303-32. Pavitt, C., Whitchurch, G. G., Siple, H., & Petersen, N. (1997). Communication and emergent group leadership: Does content count? Communication Research Reports, 14, 470-480.
  • 28.
    Ming Ming Chiu 28 Perret-Clermont,A.N. (1980). Social interaction and cognitive development in children. London: Academic. Piaget, J. (1952). The child's conception of number. New York: Humanities Press. Pomerantz, A. (1984). Agreeing and disagreeing with assessments: Some features of preferred/dispreferred turn shapes. In J. M. Atkinson & J. Heritage (Eds.), Structures of social action: Studies in conversation analysis. Cambridge: Cambridge, pp. 57-101. Poole, M. S. (1981). Decision development in small groups: A comparison of two models. Communication Monographs, 48, 1-24. Robinson, P. M. (1982). On the asymptotic properties of estimators with limited dependent variables. Econometrica, 50, 27-42. Sacks, H. (1987). On the preferences for agreement and contiguity in sequences in conversation. In G. Button and J. R. E. Lee (Eds.) Talk and social organisation pp. 54-69. Philadelphia: Multilingual Matters. Salomon, G., & Globerson, T. (1989). When teams do not function as they ought to. International Journal of Educational Research, 13, 89-99. Schegloff, E. A. (1995). Discourse as an interactional achievement III: The omnirelevance of action. Research on Language and Social Interaction, 28, 3,185- 211. Schegloff, E. A. (1996).Confirming allusions: Toward an empirical account of action. American Journal of Sociology, 102, (1), 161-216. Schegloff, E. A. (1997). "Narrative Analysis" Thirty Years Later. Journal of Narrative and Life History, 7, 1, 97-106. Schiffrin, D. (1984). Jewish argument as sociability. Language in Society, 13, 3, 311- 335. Shaw, M. E. (1932). Comparison of individuals and small groups in the rational solution of common problems. American Journal of Psychology, 44, 491-504. Slavin, R. E. (1990). Cooperative learning: Theory, research & practice. Boston: Allyn & Bacon. Sniezek, J.A. (1992). Groups under uncertainty: An examination of confidence in group decision making. Organizational Behavior and Human Decision Processes, 52, 124- 155. Stasser, G. (1992). Pooling of unshared information during group discussion. In S. Worchel, W. Wood, & J. Simpson (Eds.), Groups process and productivity (pp. 48- 57). Newbury Park, CA: Sage. Stasser, G., & Davis, J. H. (1981). Group decision making and social influence: A social interaction sequence model. Psychological Review, 88, 6, 523-551. Stasser, G.,& Taylor, L. (1991). Speaking turns in face-to-face discussions. Journal of Personality and Social Psychology, 60, 675-684. Stasser, G.,& Titus, W. (1985). Pooling of unshared information in group decision making: Biased information sampling during discussion. Journal of Personality and Social Psychology, 53, 81-93. Stasser, G.,& Titus, W. (1987). Effects of information load and percentage of shared information on the dissemination of unshared information during group decision,
  • 29.
    Analyzing Group WorkProcesses:… 29 Journal of Personality and Social Psychology, 53, 81-93. Stephan, F.F. (1952). The relative rate of communication between members of small groups: American Sociological Review, 17, 482-486. Stewart, D.D. & Strasser, G. (1995). Expert role assignment and information sampling during collective recall and decision making. Journal of Personality and Social Psychology, 69, 619-628. Tetlock, P.E. (1992). The impact of accountability on judgment and choice: Toward a social contingency model. In M.P. Zanna (Ed.), Advances in experimental social psychology Vol.25, (pp.331-376). New York: Academic Press. Vygotsky, L. S. (1997). The collected works of L.S. Vygotsky. R. W. Rieber & A. Carton (Eds.). New York: Plenum. Webb, N. M. (1980). A process-outcome analysis of learning in group and individual settings. Educational Psychologist, 15, 69-83. Webb, N. M. (1984). Sex Differences in Interaction and Achievement in Cooperative Small Groups. Journal of Educational Psychology, 76, 33-44. Wegner, D. M. (1987). Transactive memory: A contemporary analysis of the group mind. In B. Mullen & G. R. Goethals (Eds.), Theories of group behavior (pp.185- 208). New-York: Spring-Verlag. Williams, K.D., & Karau, S. J. (1991). Social loafing and social compensation: The effect of expectancy and co-worker performance. Journal of Personality and Social Psychology, 61, 570-581. Wittenbaum, G. M., & Stasser, G. (1996). Management of information in small groups. J. L. Nye & A.M. Bower's (Eds.) What's social about social cognition?: Research on socially shared cognition in small groups (pp. 3-28). London: Sage. Wood, W.,& Karten, S. J. (1986). Sex differences in interaction style as a product of perceived sex differences in competence: Journal of Personality and Social Psychology, 50, 341-347.