Download as PDF, PPTX


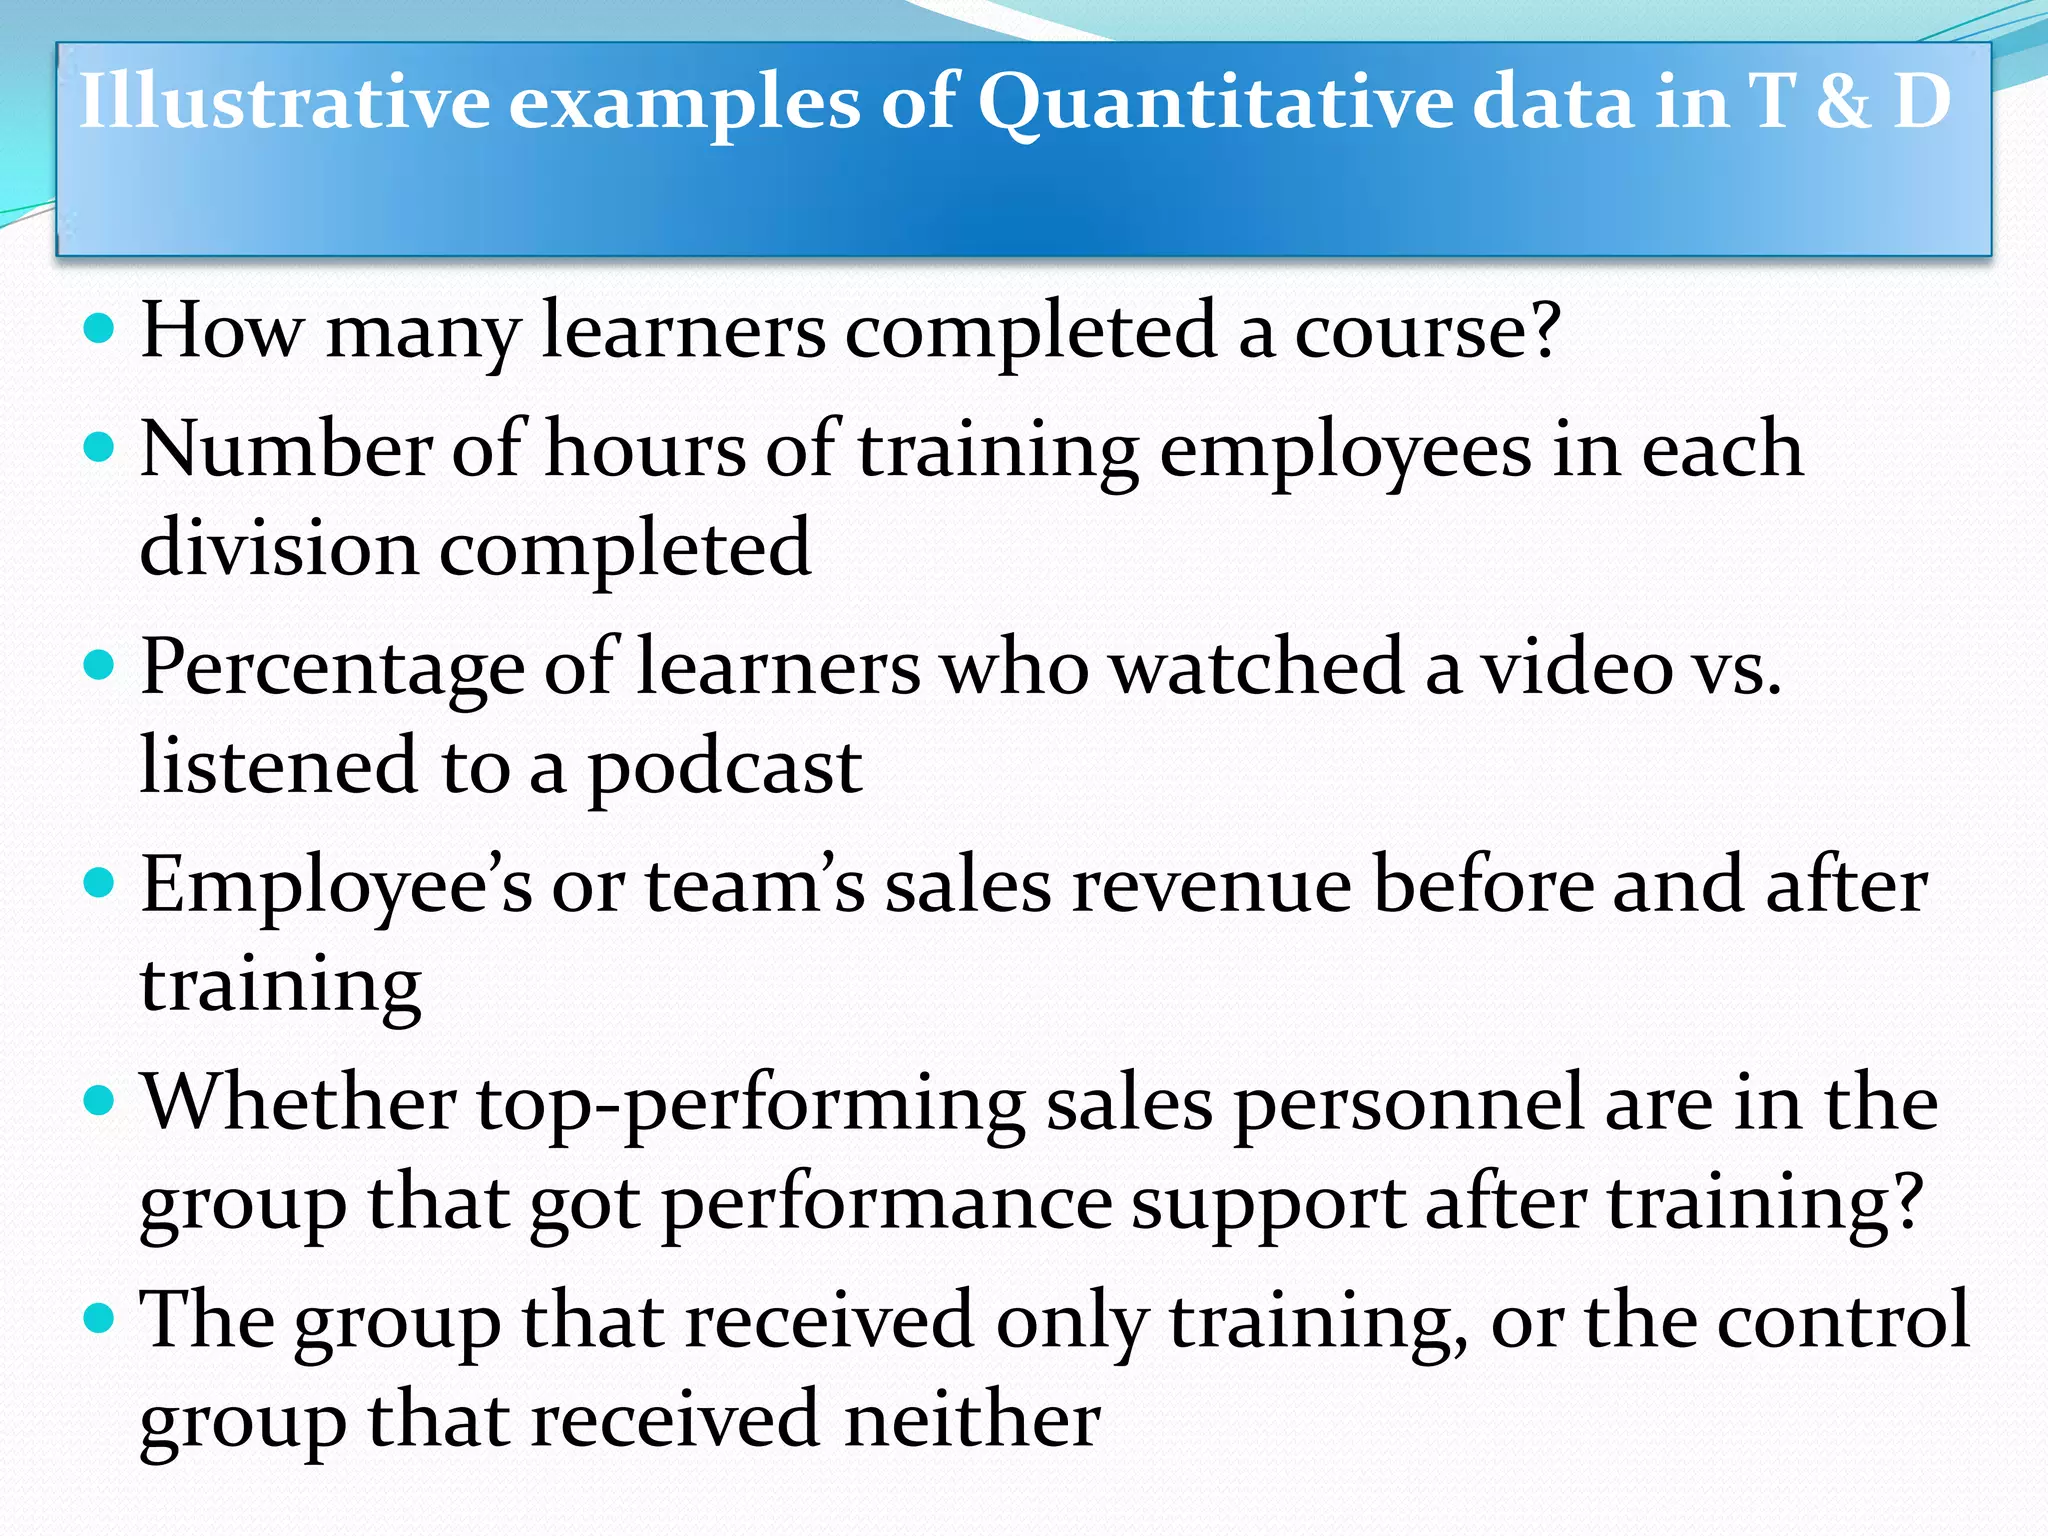

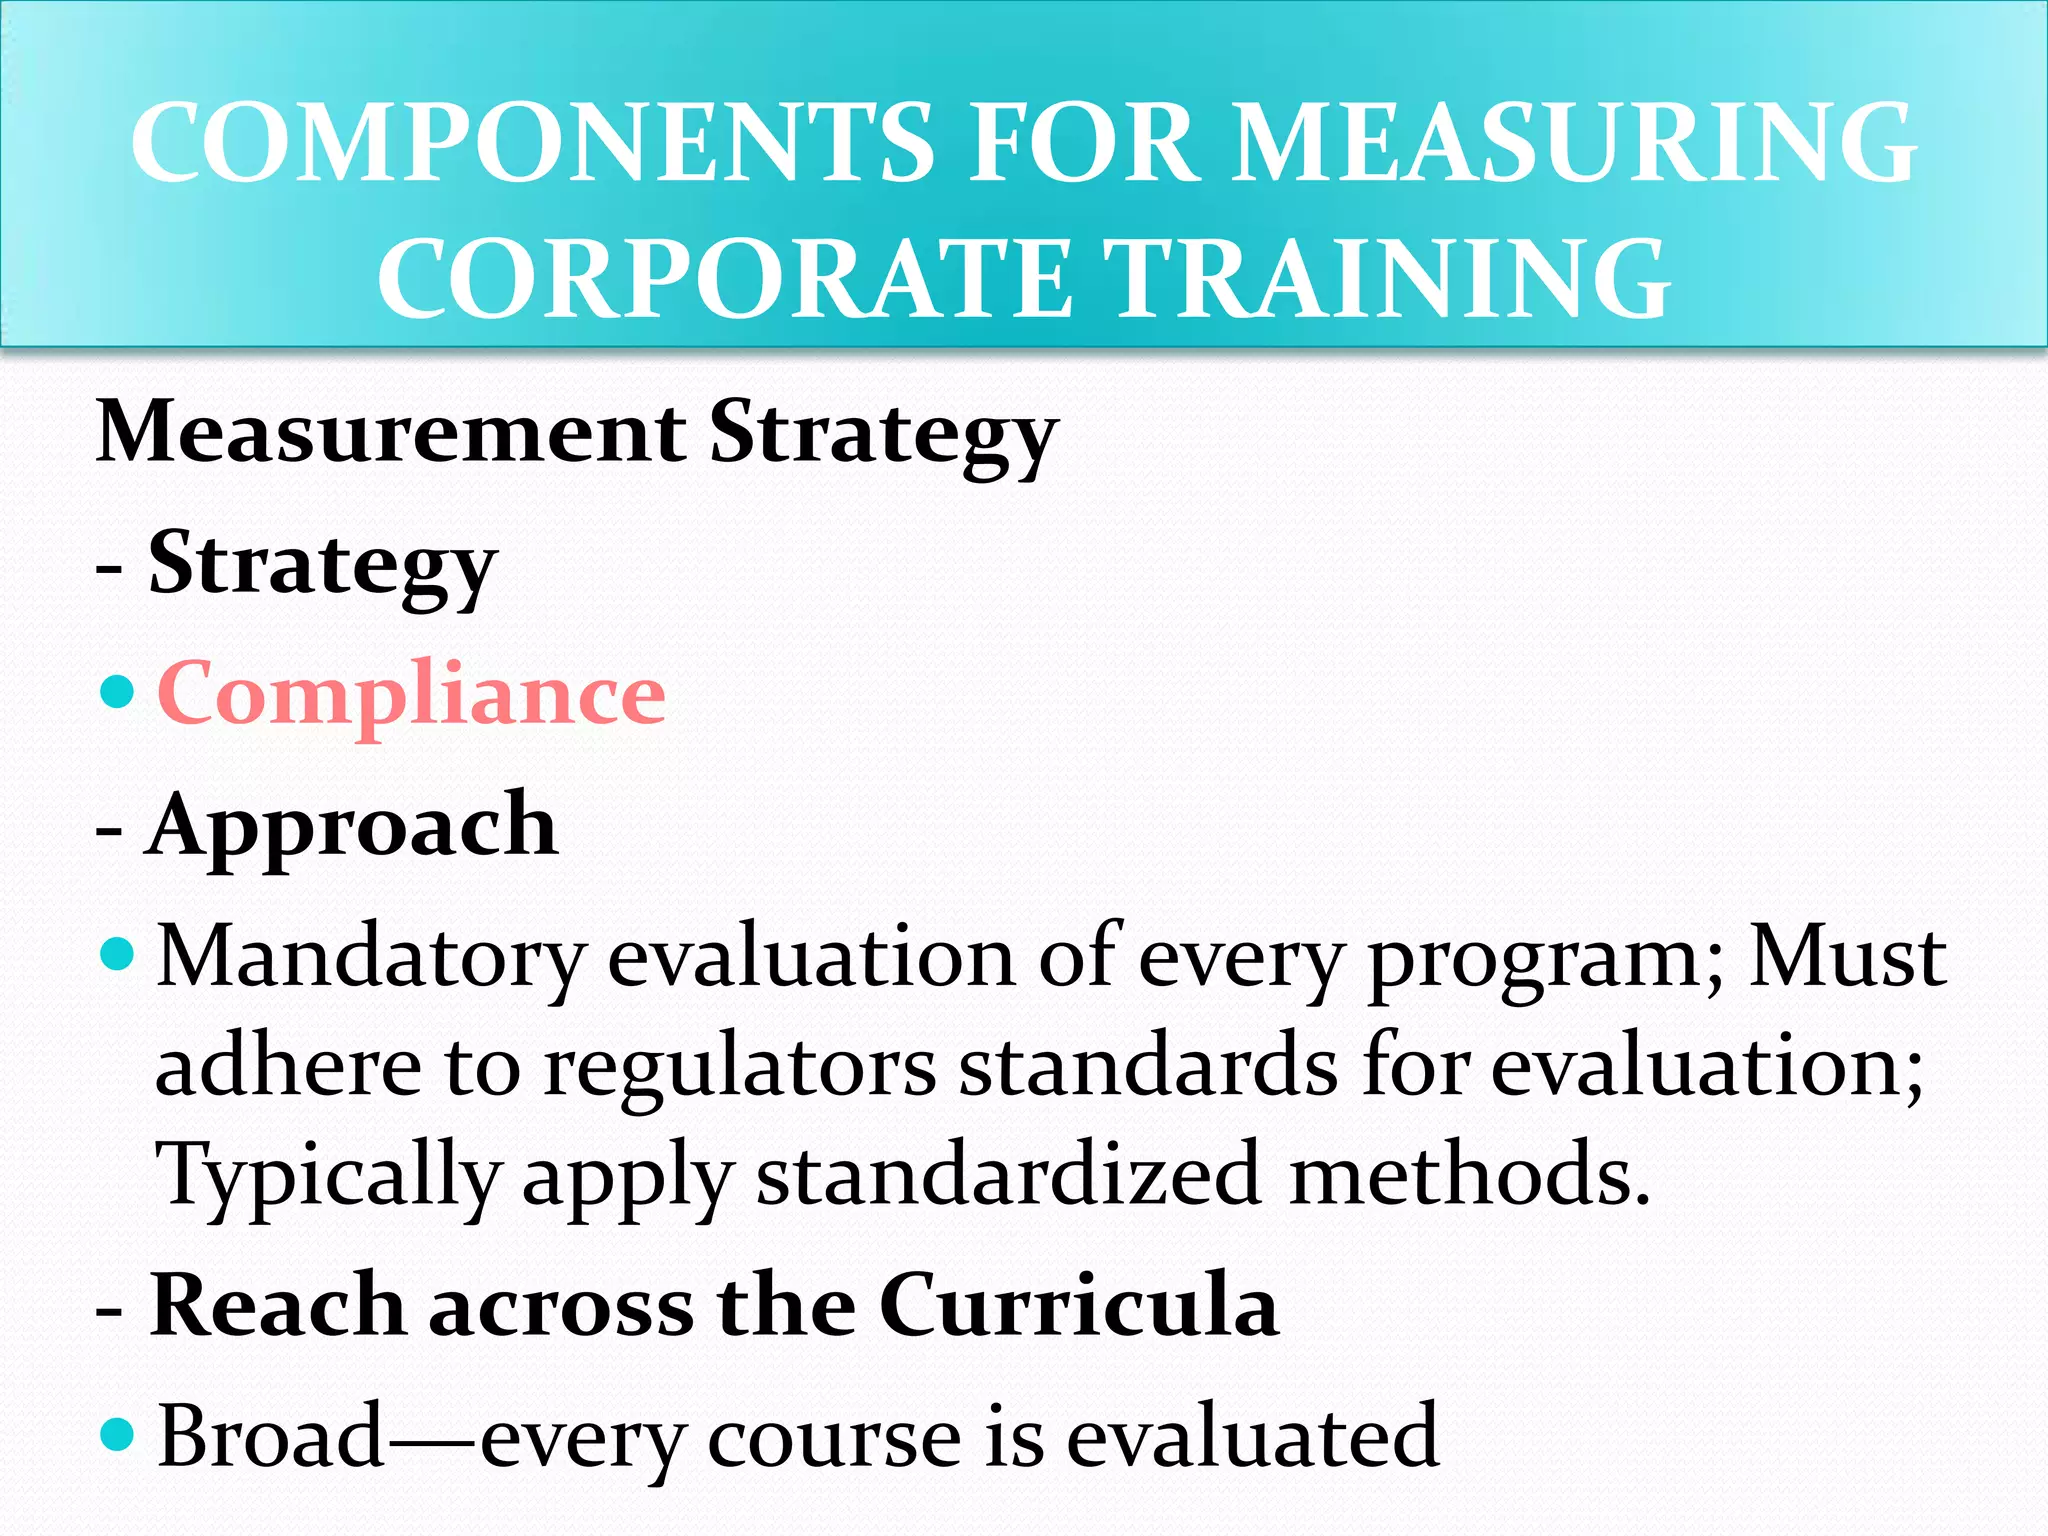
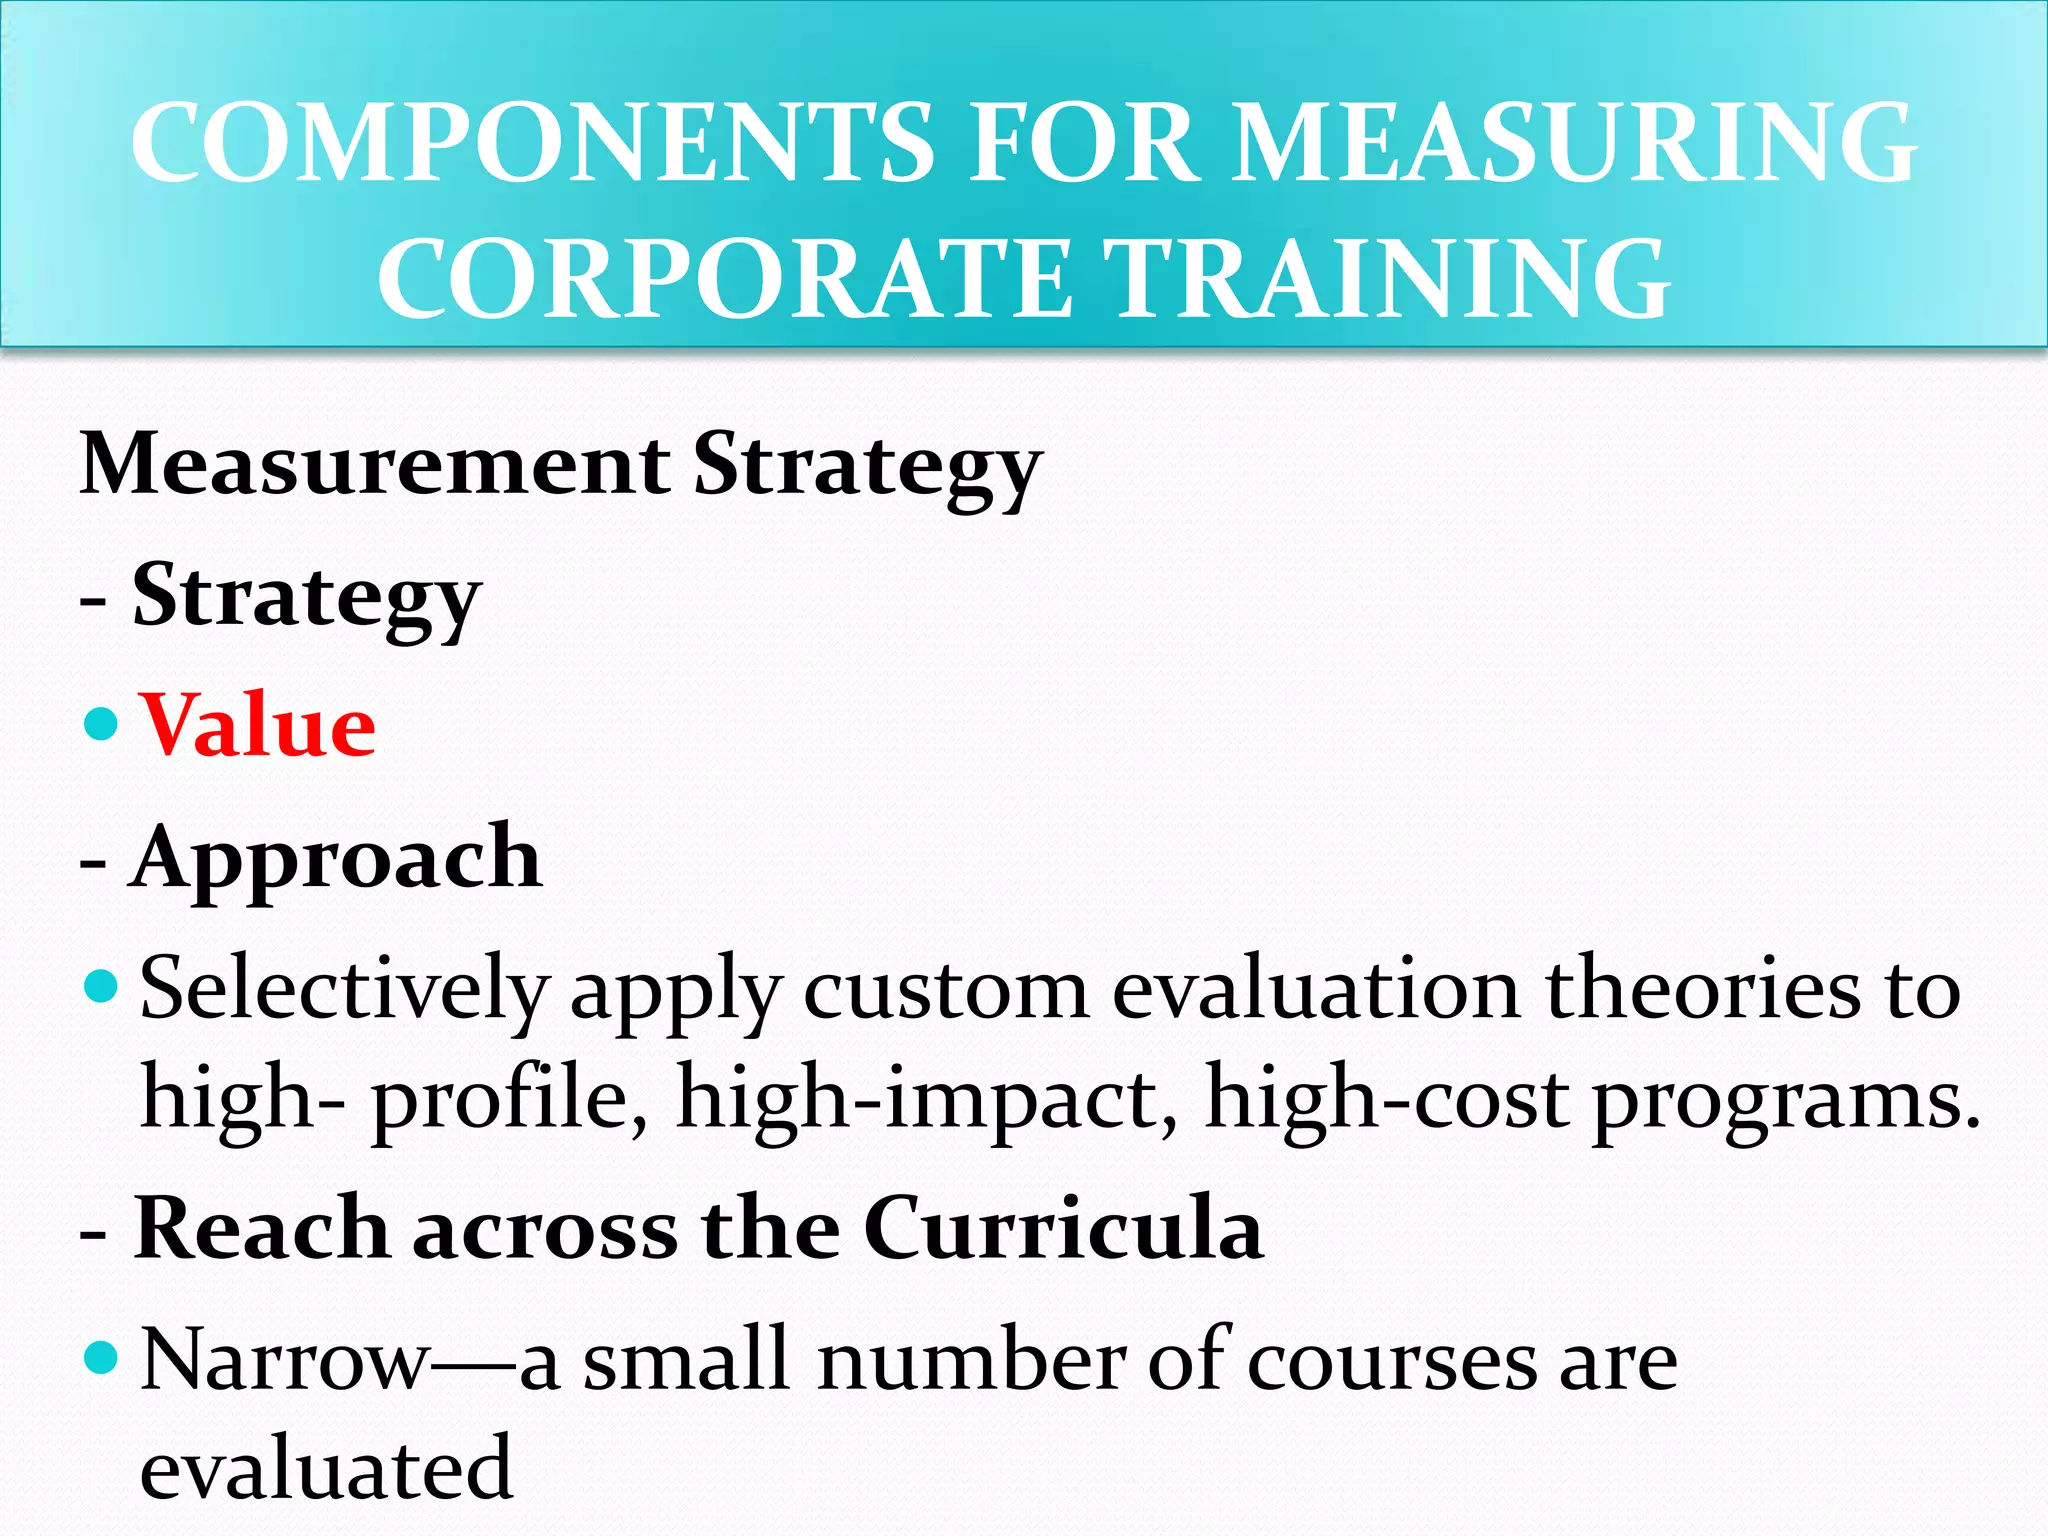
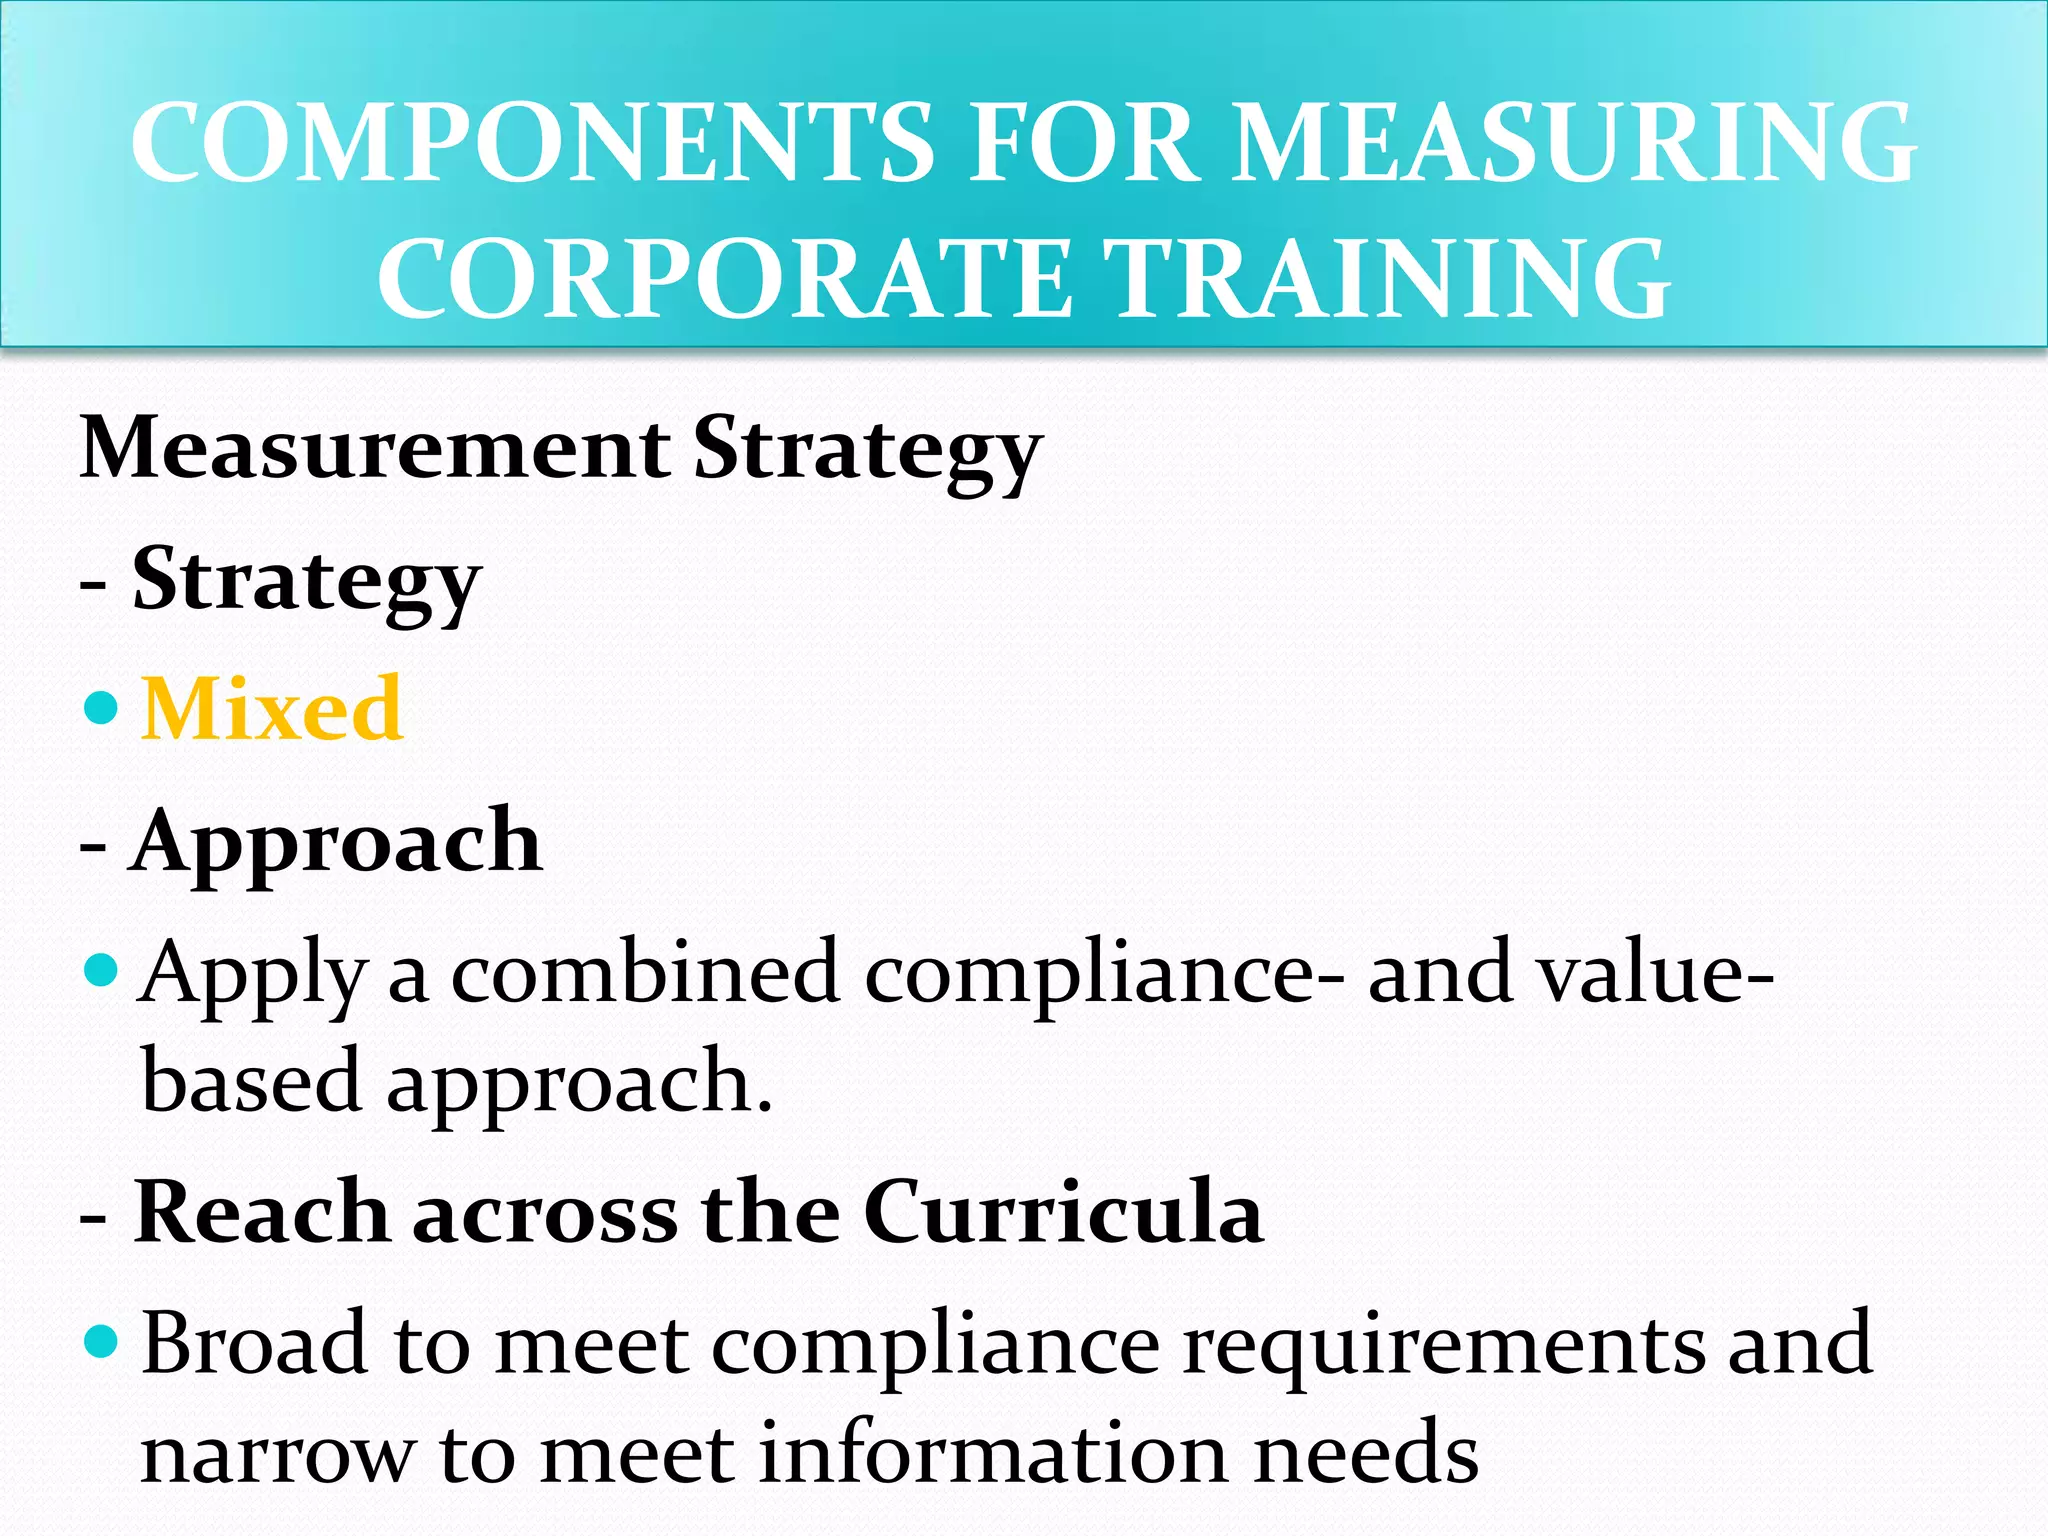


The document discusses using data analytics in training and development. It defines learning analytics and differentiates it from other types of analytics like web analytics. Learning analytics should be rooted in learning sciences and evaluate programs to improve the existing system. Data analytics can provide insights into skills gaps, areas for updating, and strengths. Visualizing data allows teams to understand information and its implications. The document also discusses measuring the effectiveness of training programs through metrics like retention, sales, efficiency, customer service, and ROI.