The document analyzes wavelet-based full reference image quality assessment (IQA) algorithms, comparing five selected methods using TID2008 image datasets. It finds that wavelet-based IQA algorithms generally outperform non-wavelet methods, with the Haar wavelet-based perceptual similarity index achieving the highest predictive accuracy. The study highlights the importance of image quality assessment in various applications and emphasizes the advantages of incorporating wavelet properties into IQA algorithms.
![Bulletin of Electrical Engineering and Informatics
Vol. 8, No. 2, June 2019, pp. 527~532
ISSN: 2302-9285, DOI: 10.11591/eei.v8i2.1404 527
Journal homepage: http://beei.org/index.php/EEI
Analysis of wavelet-based full reference image quality
assessment algorithm
Faizah Mokhtar1
, Ruzelita Ngadiran2
, Taha Basheer3
, Amir Nazren Abdul Rahim4
1,2,3
School of Computer and Communication Engineering, Universiti Malaysia Perlis, Malaysia
4
Faculty of Engineering Technology, Universiti Malaysia Perlis, Malaysia
Article Info ABSTRACT
Article history:
Received Oct 10, 2018
Revised Nov 27, 2018
Accepted Jan 15, 2019
Measurement of Image Quality plays an important role in numerous image
processing applications such as forensic science, image enhancement,
medical imaging, etc. In recent years, there is a growing interest among
researchers in creating objective Image Quality Assessment (IQA)
algorithms that can correlate well with perceived quality. A significant
progress has been made for full reference (FR) IQA problem in the past
decade. In this paper, we are comparing 5 selected FR IQA algorithms on
TID2008 image datasets. The performance and evaluation results are shown
in graphs and tables. The results of quantitative assessment showed
wavelet-based IQA algorithm outperformed over the non-wavelet based IQA
method except for WASH algorithm which the prediction value only
outperformed for certain distortion types since it takes into account the
essential structural data content of the image.
Keywords:
Full reference
HaarPSI
Image quality assessment
PSNR
SSIM
WASH
WSSI
Copyright © 2019 Institute of Advanced Engineering and Science.
All rights reserved.
Corresponding Author:
Faizah Mokhtar,
School of Computer and Communication Engineering,
Universiti Malaysia Perlis (UniMAP),
Pauh Putra Campus, 02600 Arau, Perlis, Malaysia.
Email: faizahmokhtar94@gmail.com
1. INTRODUCTION
Digital images often pass through several processing stages such as acquisition, processing, storage
and transmission before they reach to the observers [1]. These images are subjected to different kinds of
distortions during the stages such as transmission, processing, acquisition and compression. These stages may
resulting in degradation of visual quality of the images. For example, during the transmission stage, the
quality of the received image may decrease because of dropping of some data due to limited bandwidth
of the channels.
Consecutively, it is significant for image acquisition, communication, processing systems and
management to measure the quality of images at each stage. Hence, image quality assessment (IQA) is very
important in order to maintain and conserve the quality of the images. In general, measurement of image
quality usually can be classified into two categories, which are subjective and objective quality
measurements [2].
Human visual system (HVS) is well adapted for this purpose as the main function of human eye is to
extract structural information from the viewing field [3]. Therefore, the perfect method of quantifying image
quality is through subjective evaluation. To evaluate this type of measurement, a number of observers are
selected, tested for their visual capabilities, shown a series of test scenes and asked to score the quality of the
scenes [4]. Nevertheless, subjective evaluations are time-consuming and expensive which makes them
impractical for real-time applications [5].](https://image.slidesharecdn.com/221404-210630030643/85/Analysis-of-wavelet-based-full-reference-image-quality-assessment-algorithm-1-320.jpg)
![ ISSN: 2302-9285
Bulletin of Electr Eng and Inf, Vol. 8, No. 2, June 2019 : 527 – 532
528
To eliminate the need for expensive subjective studies, numerous efforts have been made to develop
objective measurement that can correlate with perceived quality. The goal of objective IQA is to design
algorithms that are able to predict the quality of an image automatically and accurately.
1.1. Image quality assessment
In general, measurement of image quality usually can be classified into two categories which are:
a. Subjective measurement: A number of observers are selected, tested for their visual capabilities, shown
a series of test scenes and asked to score the quality of the scenes [6]. It is the only “correct” method of
quantifying visual image quality. However, subjective evaluation is usually too inconvenient, time-
consuming and expensive.
b. Objective measurement: These are automatic algorithms for quality assessment that could analyze
images and report their quality without human involvement. Such methods could eliminate the need for
expensive subjective studies.
1.2. Objective image quality assessment
Objective image quality metrics can be classified according to the availability of an original
(distortion-free) image, with which the distorted image is to be compared. Most existing approaches are
known as:
a. Full-reference (FR): A complete reference image is available.
b. Reduced-reference (RR): The reference image is only partially available, in the form of a set of
extracted features as side information.
c. No-reference (NR): The reference image is not available.
1.2.1. Full reference method
The most popular objective quality metric for image processing applications are Peak Signal and
Noise Ratio (PSNR) and Structural Similarity (SSIM) [7]. Both method has been widely used by other
researchers. Measurement methods usually consider the human visual system (HVS) characteristics to
correlate with perceptual quality. PSNR is defined as
(1)
where MSE is the mean square error and L is the dynamic range of the pixel values. However this method
does not correlate well with human perception of quality as it is only calculate the pixel difference between
original and distorted image.
SSIM is proposed by Wang et. al [8] to improve the traditional methods. SSIM is a method that
measures the similarity between original and distorted image. Three image information is considered in this
method which is luminance, contrast and structure. The comparison measures were defined as;
( ) (2)
( ) , (3)
( ) , (4)
where x and y is two discrete non-negative signal, , and is the mean of x, the variance of x and the
covariance of x and y respectively. The resulting SSIM index equation is given by;
( )
( )( )
( )( )
(5)
where and are constants.
However, during recent decades, researchers have realize the advantage of wavelet properties to
image processing. Many studies of image quality assessment algorithm that is based on wavelet transform
has been proposed. Wavelet transform matches with the multi-channel model of the human visual system
(HVS) [9]. It able to separate frequency and spatial domain hence suitable for perceptual analysis of
HVS system.](https://image.slidesharecdn.com/221404-210630030643/85/Analysis-of-wavelet-based-full-reference-image-quality-assessment-algorithm-2-320.jpg)
![Bulletin of Electr Eng and Inf ISSN: 2302-9285
Analysis of wavelet-based full reference image quality assessment algorithm (Faizah Mokhtar)
529
In 2013, Reenu et. al proposed WAvelet-based SHarp features (WASH) that take into account the
sensitivity of human vision to the sharp features of the image, the sharpness and zero-crossing [10]. The
WASH metric can be calculated as
( )
(6)
where is the similarity in sharpness of the reference and distorted image while is the final ratio value
of the zero-crossing. The value of is assumed as 0.8, so that to provide the higher geometric weight
to sharpness.
Furthermore in 2009, Rezazadeh et. al proposed a novel approach for computing and pooling SSIM
in the discrete wavelet domain [11]. Similar to spatial SSIM metric, the proposed metric has the feature of
boundedness. To acquire the final similarity score, it computes an edge similarity map and an approximation
structural similarity map. It also introduce a contrast map in the wavelet domain for structural similarity maps
pooling. The overall quality measure equation between X and Y is;
( ) ( ) (7)
where and is the approximation and edge similarity scores respectively while is constant.
Besides, a relatively new metric named Haar wavelet-based Perceptual Similarity Index (HaarPSI)
has been proposed by Reisenhofer et. al [12]. This metric is based on the three stages coefficients of discrete
Haar wavelet transform. The local similarities between reference and distorted images is measured by these
coefficients. It uses six simple 2D Haar wavelet filters to detect vertical and horizontal edges. This metric can
be appraised as a simplified interpretation of Feature SIMilarity index (FSIM).
2. DATASET AND PERFORMANCE METRICS
The TID2008 database is downloaded to be implemented during the evaluation of the selected IQA
metrics. This database contains 1700 test images (25 reference images, 17 types of distortions for each
reference image) [13]. It had been subject to a wide range of distortions, including various types of noise,
transmission errors, blur, JPEG and JPEG 2000 compression as well as contrast and luminance changes.
TID2008 is intended for evaluation of FR IQA metrics. It allows estimating how a metric corresponds to
mean human perception. Three commonly applied performance metrics are used for calculating the
prediction monotonicity which are [14]:
a. Spearman rank- order correlation coefficient (SROCC)
b. Kendall rank-order correlation coefficient (KROCC)
c. Pearson linear correlation coefficient (PLCC)
For SROCC and KROCC, these two metrics can measure the prediction monotonicity of an IQA
metric [15]. It also operate only on the rank of the data points and disregard the relative distance between
data points. However, to compute PLCC, a regression analysis need to be utilized in order to provide a
nonlinear mapping between the objective scores and the subjective mean opinion scores (MOSs).
3. RESULTS AND ANALYSIS
A comparison has been done between the five IQA metrics by simulating them using MATLAB
software. The five FR IQA metrics are:
a. Peak Signal to Noise Ratio (PSNR)
b. Structurul Similarity Index (SSIM)
c. Wavelet-Based Sharp Features (WASH)
d. Wavelet Structural Similarity Index (WSSI)
e. Haar wavelet-based Perceptual Similarity Index (HaarPSI)
3.1. Discussions
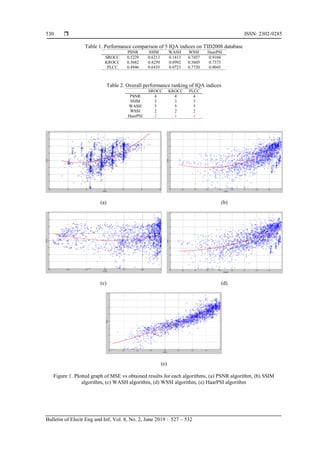
The scatter plots of MOS versus model predictions are shown in Figure 1, where each point
represents one test image, with its vertical and horizontal axes representing its MOS and the obtained quality
score, respectively. From Table 1 and 2, it can be concluded that WASH algorithm has the lowest prediction.
This is due to WASH metric only provides best results for JPEG, JPEG2000 and GBLUR, since it takes into
account the essential structural data content of the image.](https://image.slidesharecdn.com/221404-210630030643/85/Analysis-of-wavelet-based-full-reference-image-quality-assessment-algorithm-3-320.jpg)
![Bulletin of Electr Eng and Inf ISSN: 2302-9285
Analysis of wavelet-based full reference image quality assessment algorithm (Faizah Mokhtar)
531
Besides that, PSNR has relatively low prediction value. PNSR is a mathematical formula that
measure the image quality based on the pixel difference between reference and distorted image. Although
this metric is simple and easy to calculate, it ignores the features of human image perception and only
calculate the difference of pixel in image.
SSIM separates out the parameters in image which are luminance, contrast and structure.
Additionally, this metric is applied locally using sliding window that moves pixel by pixel over the entire
image. However, it is considered unstable measure and does not correlate well with subjective assessment as
it is unable to accurately represent foreign object in an image if the structural information is not affected.
WSSI has relatively high prediction value in this experiment. The reason is that most of the useful
image information is concentrated in the first-level approximation sub band making the assessment become
more accurate and precise. Haar wavelet is also used to reduce the complexity. However, this metric still
suffer from high complexity as it is used on top of existing measurement while including a new contrast map
function followed by approximation measurement that combine with edge quality measurement.
HaarPSI achieve the highest prediction value in this experiment. The performance is relatively low
when tested on image databases restricted to Gaussian blur. This limitation is due to this metric is entirely
depend on high frequency information making it may too sensitive for distortions based on low-pass filtering.
Nevertheless, it computed very efficiently and significantly faster than the other two metric. The used of Haar
wavelet is potentially the simplest and most efficient in computation. Along with its less complex
computational structure, this suggest HaarPSI can be applied in real optimization tasks.
4. CONCLUSION
Image quality assessment plays an important role in various image processing application. A
numerous effort has been made by researchers to develop objective IQA metrics. The results of quantitative
assessment showed wavelet-based IQA algorithm outperformed over the other two methods. Although
WASH algorithm has the lowest prediction among the all IQA, the prediction value for JPEG, JPEG2000 and
GBLUR distortion surpassed PSNR method. In this experiment, it can be proved that including wavelet in
image quality assessment process can improve the accuracy and complexity of an algorithm.
ACKNOWLEDGEMENTS
The author would like to acknowledge the support from the Fundamental Research Grant Scheme
(FRGS) under a grant number of FRGS/1/2017/ICT05/UNIMAP/02/2 from the Ministry of Higher Education
Malaysia. The author would like to express gratitude to the Ministry of Higher Education Malaysia and
University Malaysia Perlis for facilities provided in this work.
REFERENCES
[1] P. Mohammadi, A. Ebrahimi-Moghadam, and S. Shirani, “Subjective and Objective Quality Assessment of Image:
A Survey,” arXiv, no. June, pp. 1–50, 2014.
[2] A. George and A. Prabavathy, “A Survey On different approaches used in image quality assessment,” Ijcsns, vol. 3,
no. 2, 2014.
[3] M. Gulame, K. R. Joshi, and R. S. Kamthe, “A Full Reference Based Objective Image Quality Assessment,” Int. J.
Adv. Electr. Electron. Eng., vol. 2, no. 6, pp. 13–18, 2013.
[4] Y. Y. Al-najjar and D. C. Soong, “Comparison of Image Quality Assessment: PSNR, HVS, SSIM, UIQI,” Int. J.
Sci. Eng. Res., vol. 3, no. 8, pp. 1–5, 2012.
[5] A. Rehman and Z. Wang, "Reduced-Reference Image Quality Assessment by Structural Similarity Estimation,"
in IEEE Transactions on Image Processing, vol. 21, no. 8, pp. 3378-3389, Aug. 2012.
[6] C. S. Varnan, A. Jagan, J. Kaur, D. Jyoti, and D. S. Rao, “Image Quality Assessment Techniques in Spatial,” Int. J.
Comput. Sci. Technol., vol. 2, no. 3, pp. 177–184, 2011.
[7] Chun-Ling Yang, Wen-Rui Gao and Lai-Man Po, "Discrete wavelet transform-based structural similarity for image
quality assessment," 2008 15th IEEE International Conference on Image Processing, San Diego, CA, 2008,
pp. 377-380.
[8] Zhou Wang, A. C. Bovik, H. R. Sheikh and E. P. Simoncelli, "Image quality assessment: from error visibility to
structural similarity," in IEEE Transactions on Image Processing, vol. 13, no. 4, pp. 600-612, April 2004.
[9] Z. H. Wei, P. Qin and Y. Q. Fu, "Perceptual digital watermark of images using wavelet transform," in IEEE
Transactions on Consumer Electronics, vol. 44, no. 4, pp. 1267-1272, Nov. 1998.
[10] M. Reenu, D. David, S. S. A. Raj and M. S. Nair, "Wavelet Based Sharp Features (WASH): An Image Quality
Assessment Metric Based on HVS," 2013 2nd International Conference on Advanced Computing, Networking and
Security, Mangalore, 2013, pp. 79-83.](https://image.slidesharecdn.com/221404-210630030643/85/Analysis-of-wavelet-based-full-reference-image-quality-assessment-algorithm-5-320.jpg)
![ ISSN: 2302-9285
Bulletin of Electr Eng and Inf, Vol. 8, No. 2, June 2019 : 527 – 532
532
[11] S. Rezazadeh and S. Coulombe, "A novel approach for computing and pooling Structural SIMilarity index in the
discrete wavelet domain," 2009 16th IEEE International Conference on Image Processing (ICIP), Cairo, 2009,
pp. 2209-2212.
[12] R. Reisenhofer and S. Bosse, “A Haar Wavelet-Based Perceptual Similarity Index for Image Quality Assessment,”
arxiv. pp. 1–19, 2018.
[13] N. Ponomarenko et al., “TID2008-A database for evaluation of full-reference visual quality assessment metrics,”
Adv. Mod. …, vol. 10, no. January 2016, pp. 30–45, 2009.
[14] L. Zhang, L. Zhang and X. Mou, "RFSIM: A feature based image quality assessment metric using Riesz
transforms," 2010 IEEE International Conference on Image Processing, Hong Kong, 2010, pp. 321-324.
[15] A. V Abraham and S. Priya, “A Study on Different Types of FR IQA,” International Journal of Innovative
Research in Science, Engineering and Technology. vol. 6, no. 5, pp. 46–51, 2017.
BIOGRAPHIES OF AUTHORS
Faizah Mokhtar received the B.Eng. in Computer Network Engineering from University
Malaysia Perlis (UniMAP), Malaysia. She is currently completing the M.Sc. degree in Computer
Enginering at University Malaysia Perlis (UniMAP), Malaysia. Her research interest include
image processing.
Ruzelita Ngadiran received the M.Sc. degree in Science in engineering from Malaysia National
University (UKM), Malaysia and the Ph.D. degree in Engineering of Communications and
Signal Processing from the Newcastle University, Newcastle upon Tyne, UK. Currently she is a
senior lecturer with the School of Computer and Communication Engineering, University
Malaysia Perlis (UniMAP), Malaysia. Her research interest include image compression, signal
processing, digital watermarking and artificial intelligence.
Taha Basheer Taha received the B.Sc. in computer engineering form University of Mosul, Iraq,
and the master degree in computer engineering from Institute of agriculture, technology and
science, India. He was appointed as a lecturer at several universities and institutes in Iraq, and
worked as graduate assistant at University Malaysia Perlis (UniMAP), Malaysia. He is currently
completing the Ph.D. degree in computer engineering at University Malaysia Perlis. His research
interests include digital watermarking, perceptual mapping, image tamper detection, and FPGA
design and implementation
Amir Nazren Abdul Rahim received B.Eng (Hons) in Computer Engineering from University
Malaysia Perlis (UniMAP), Malaysia and Ph.D. degree in Computer Engineering from
University Malaysia Perlis (UniMAP), Malaysia.](https://image.slidesharecdn.com/221404-210630030643/85/Analysis-of-wavelet-based-full-reference-image-quality-assessment-algorithm-6-320.jpg)