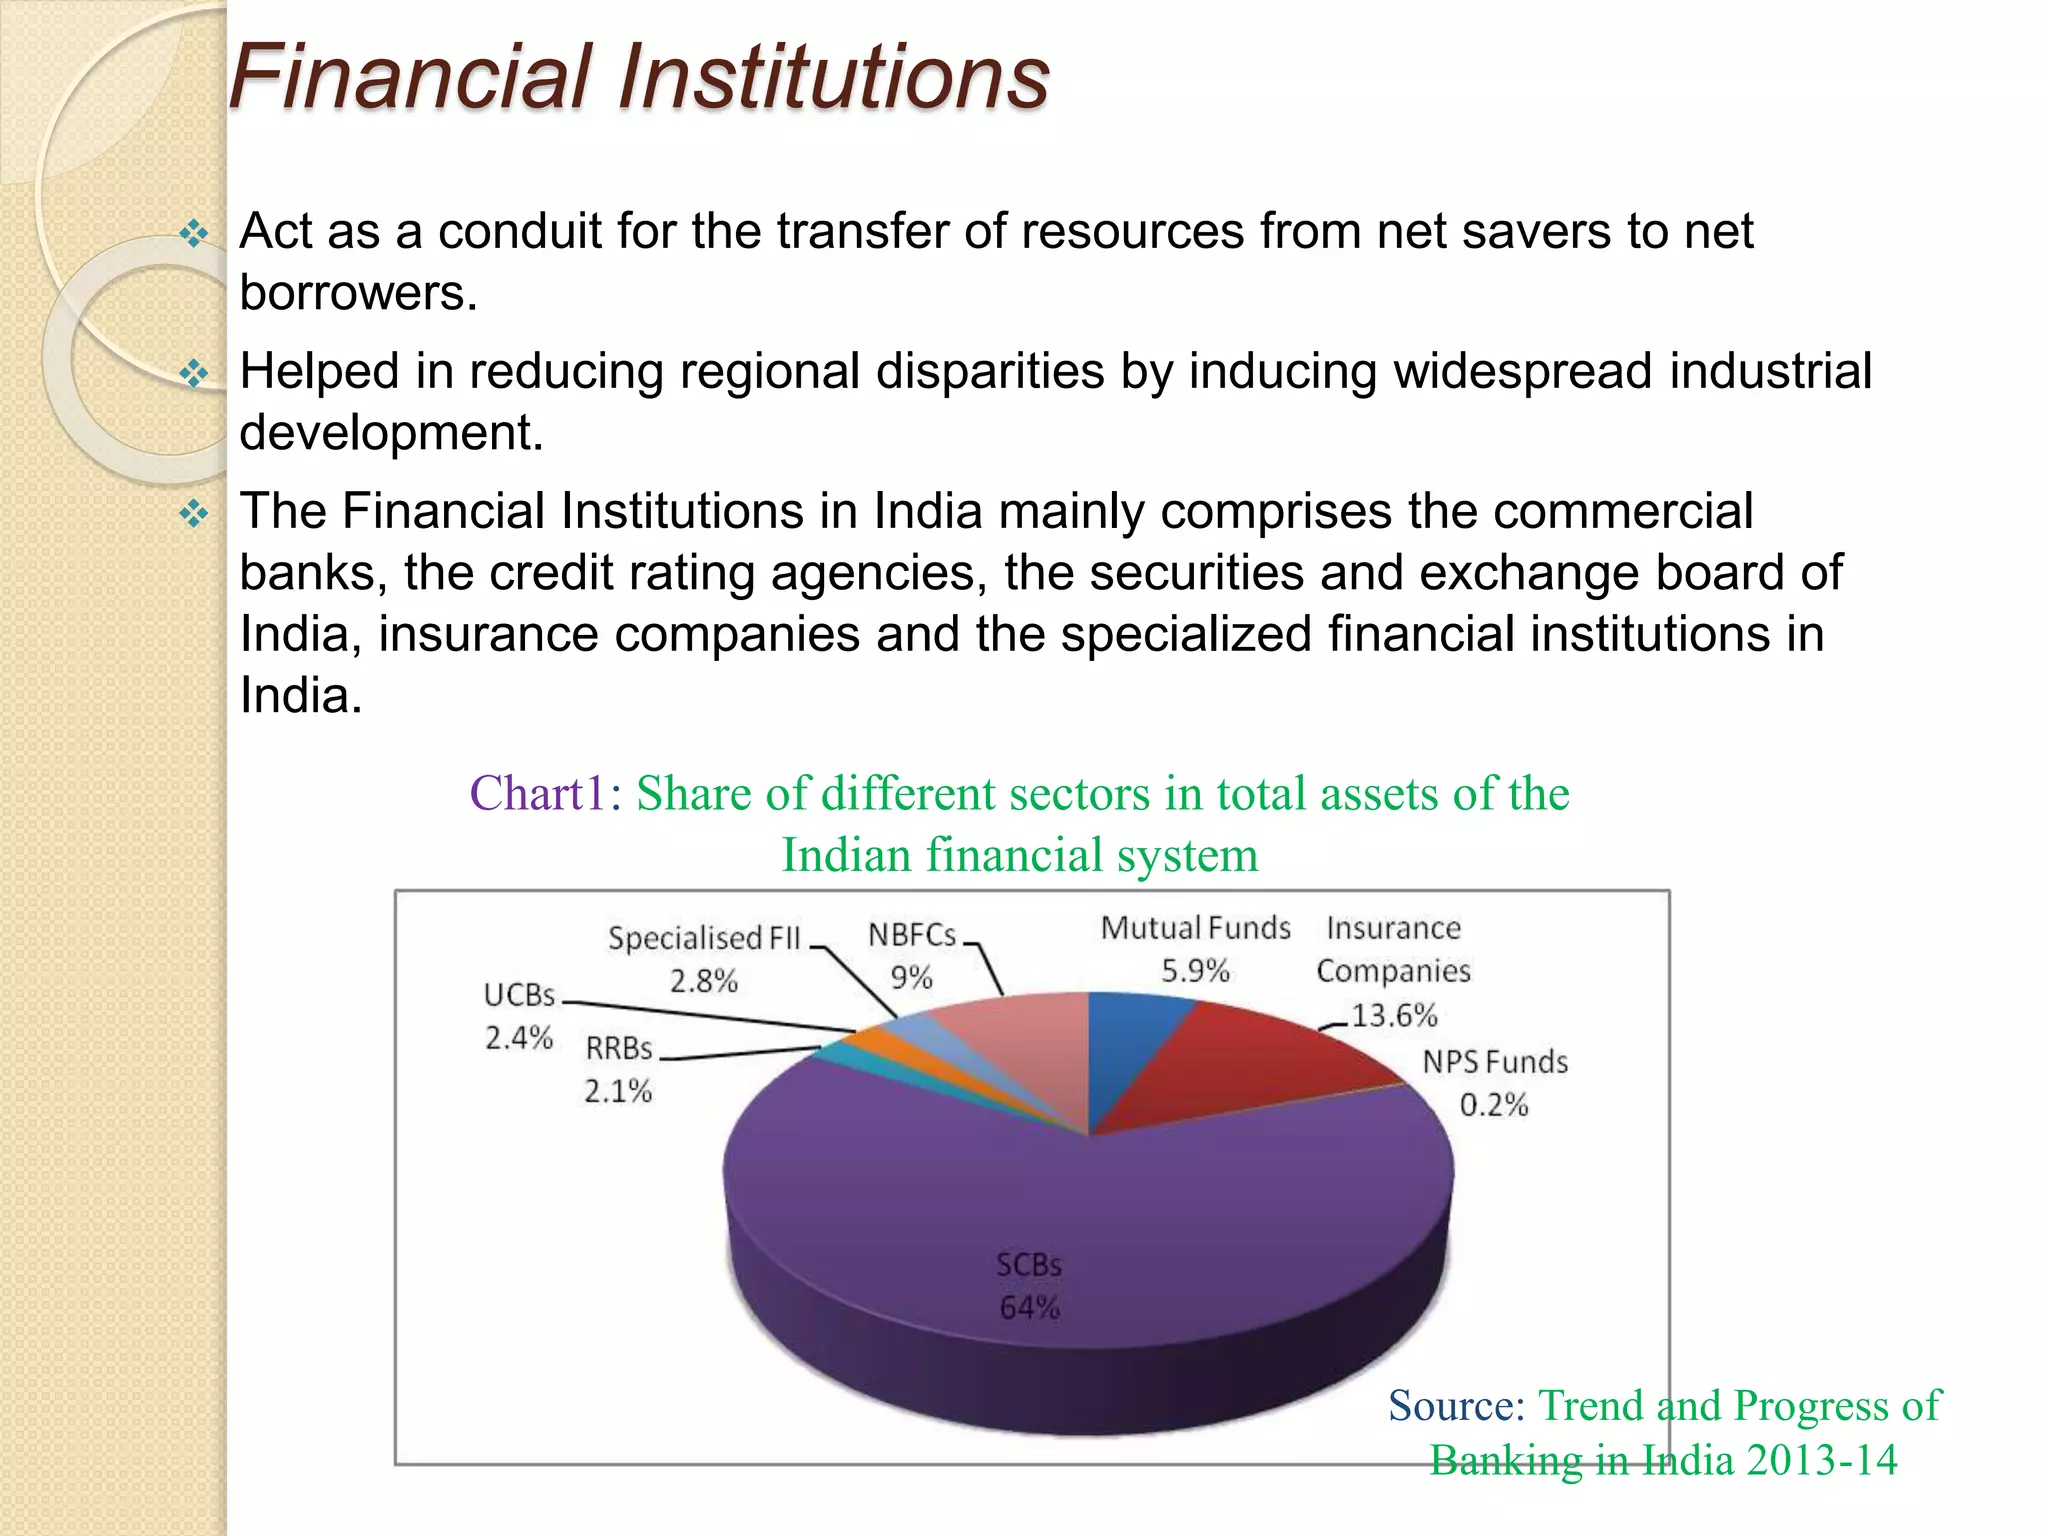
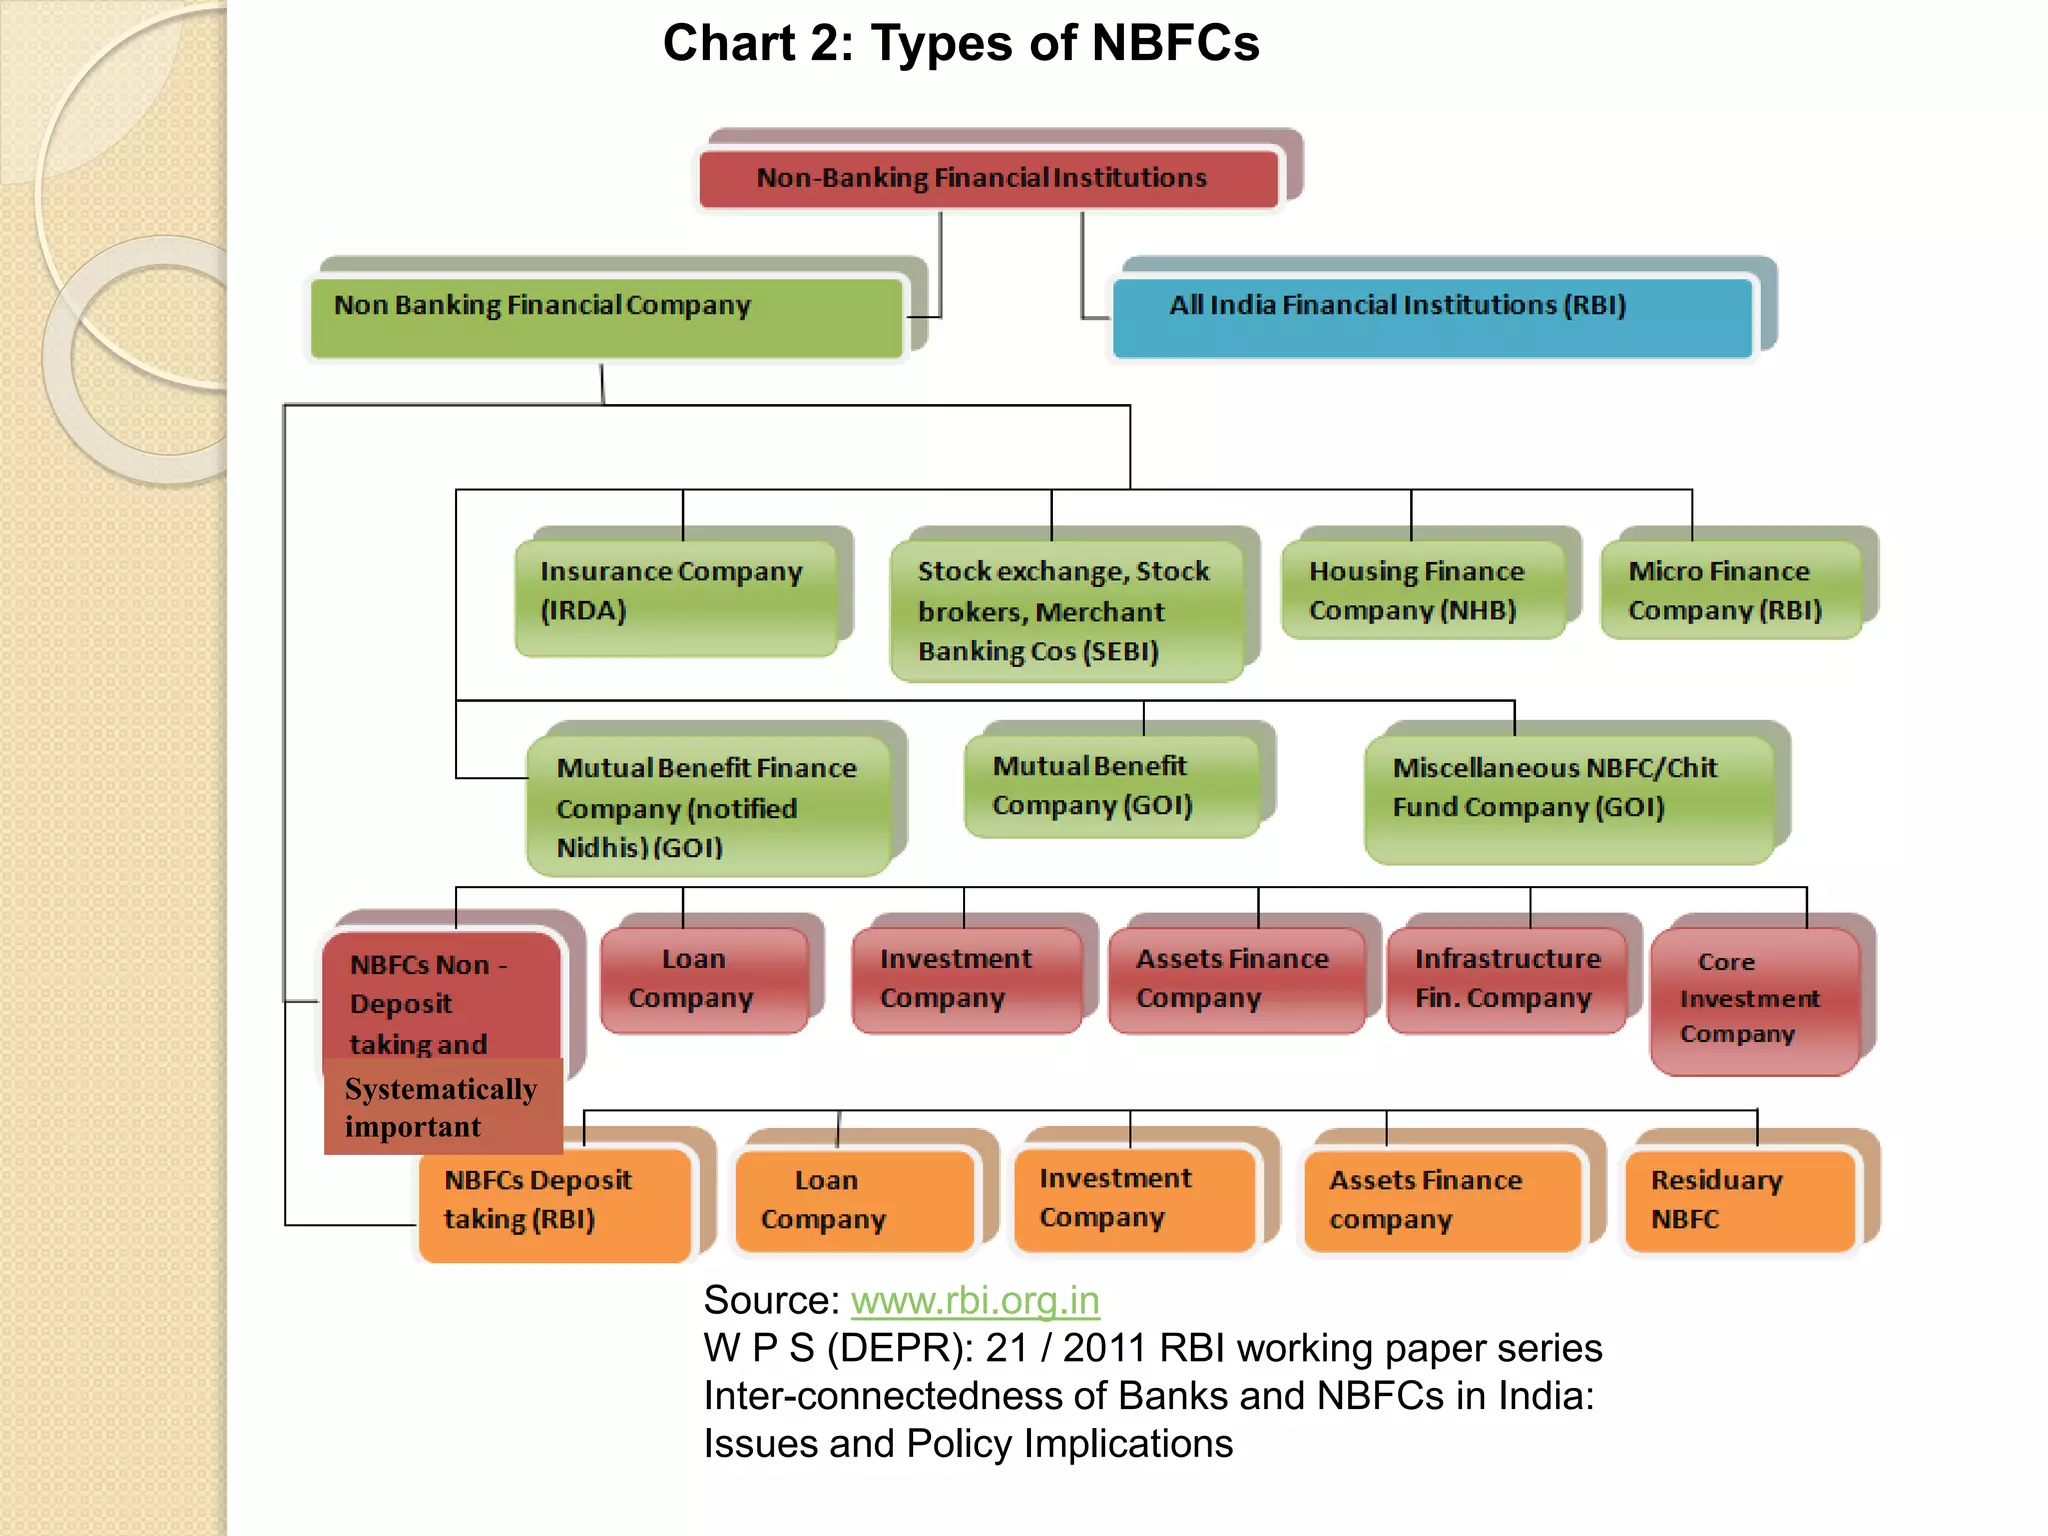
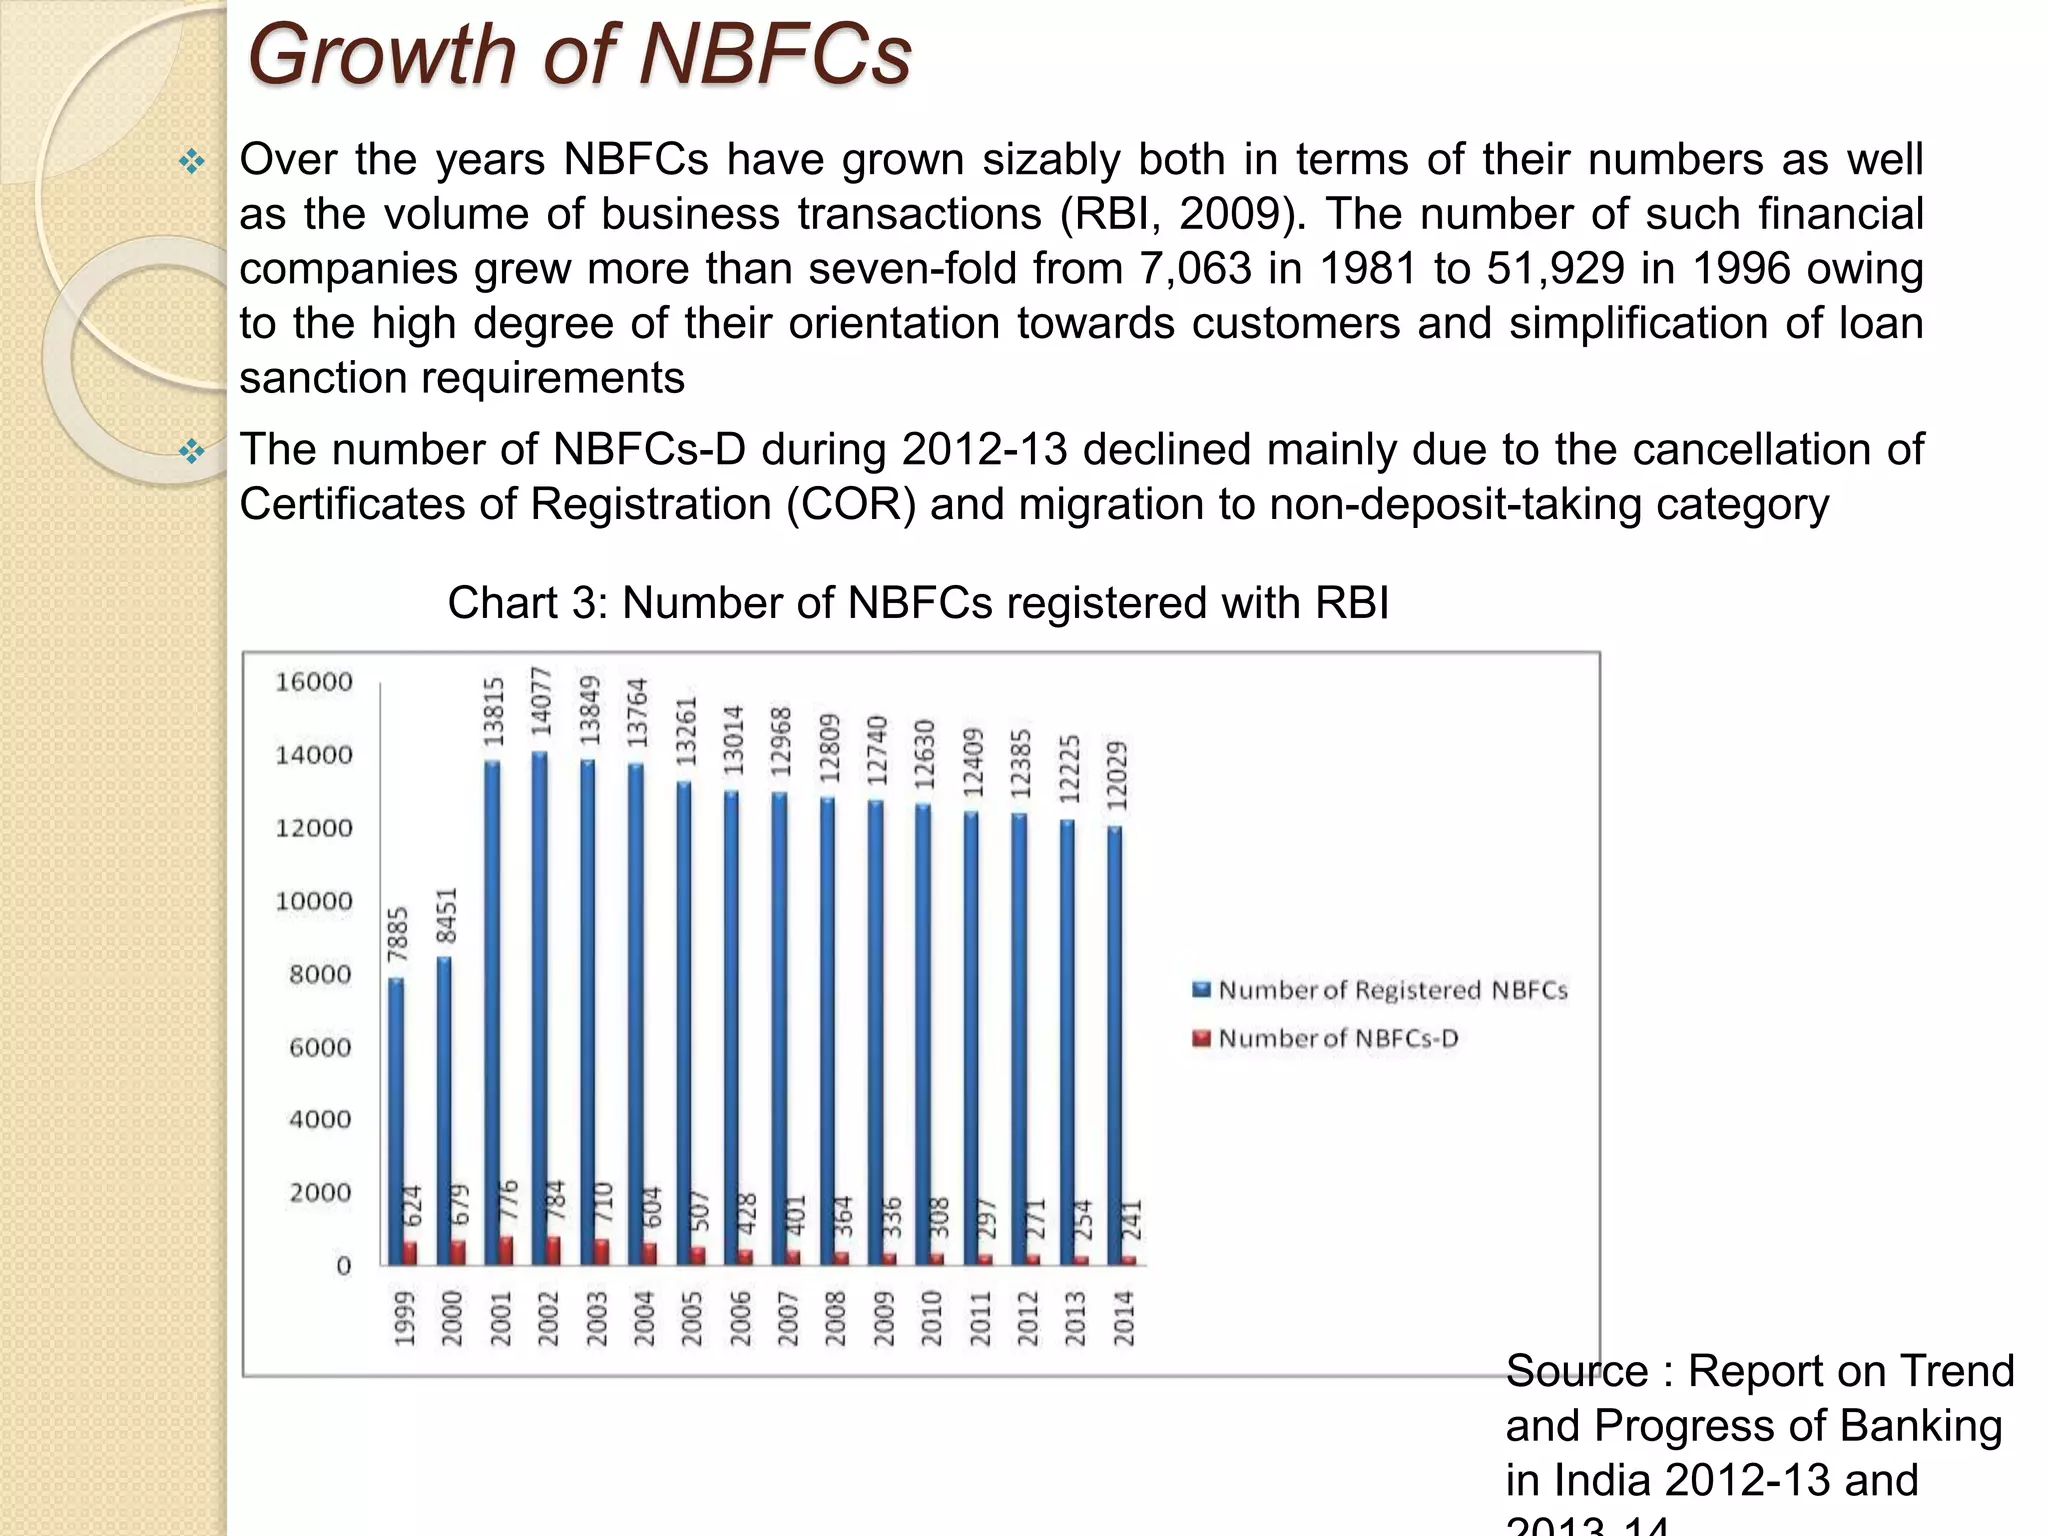
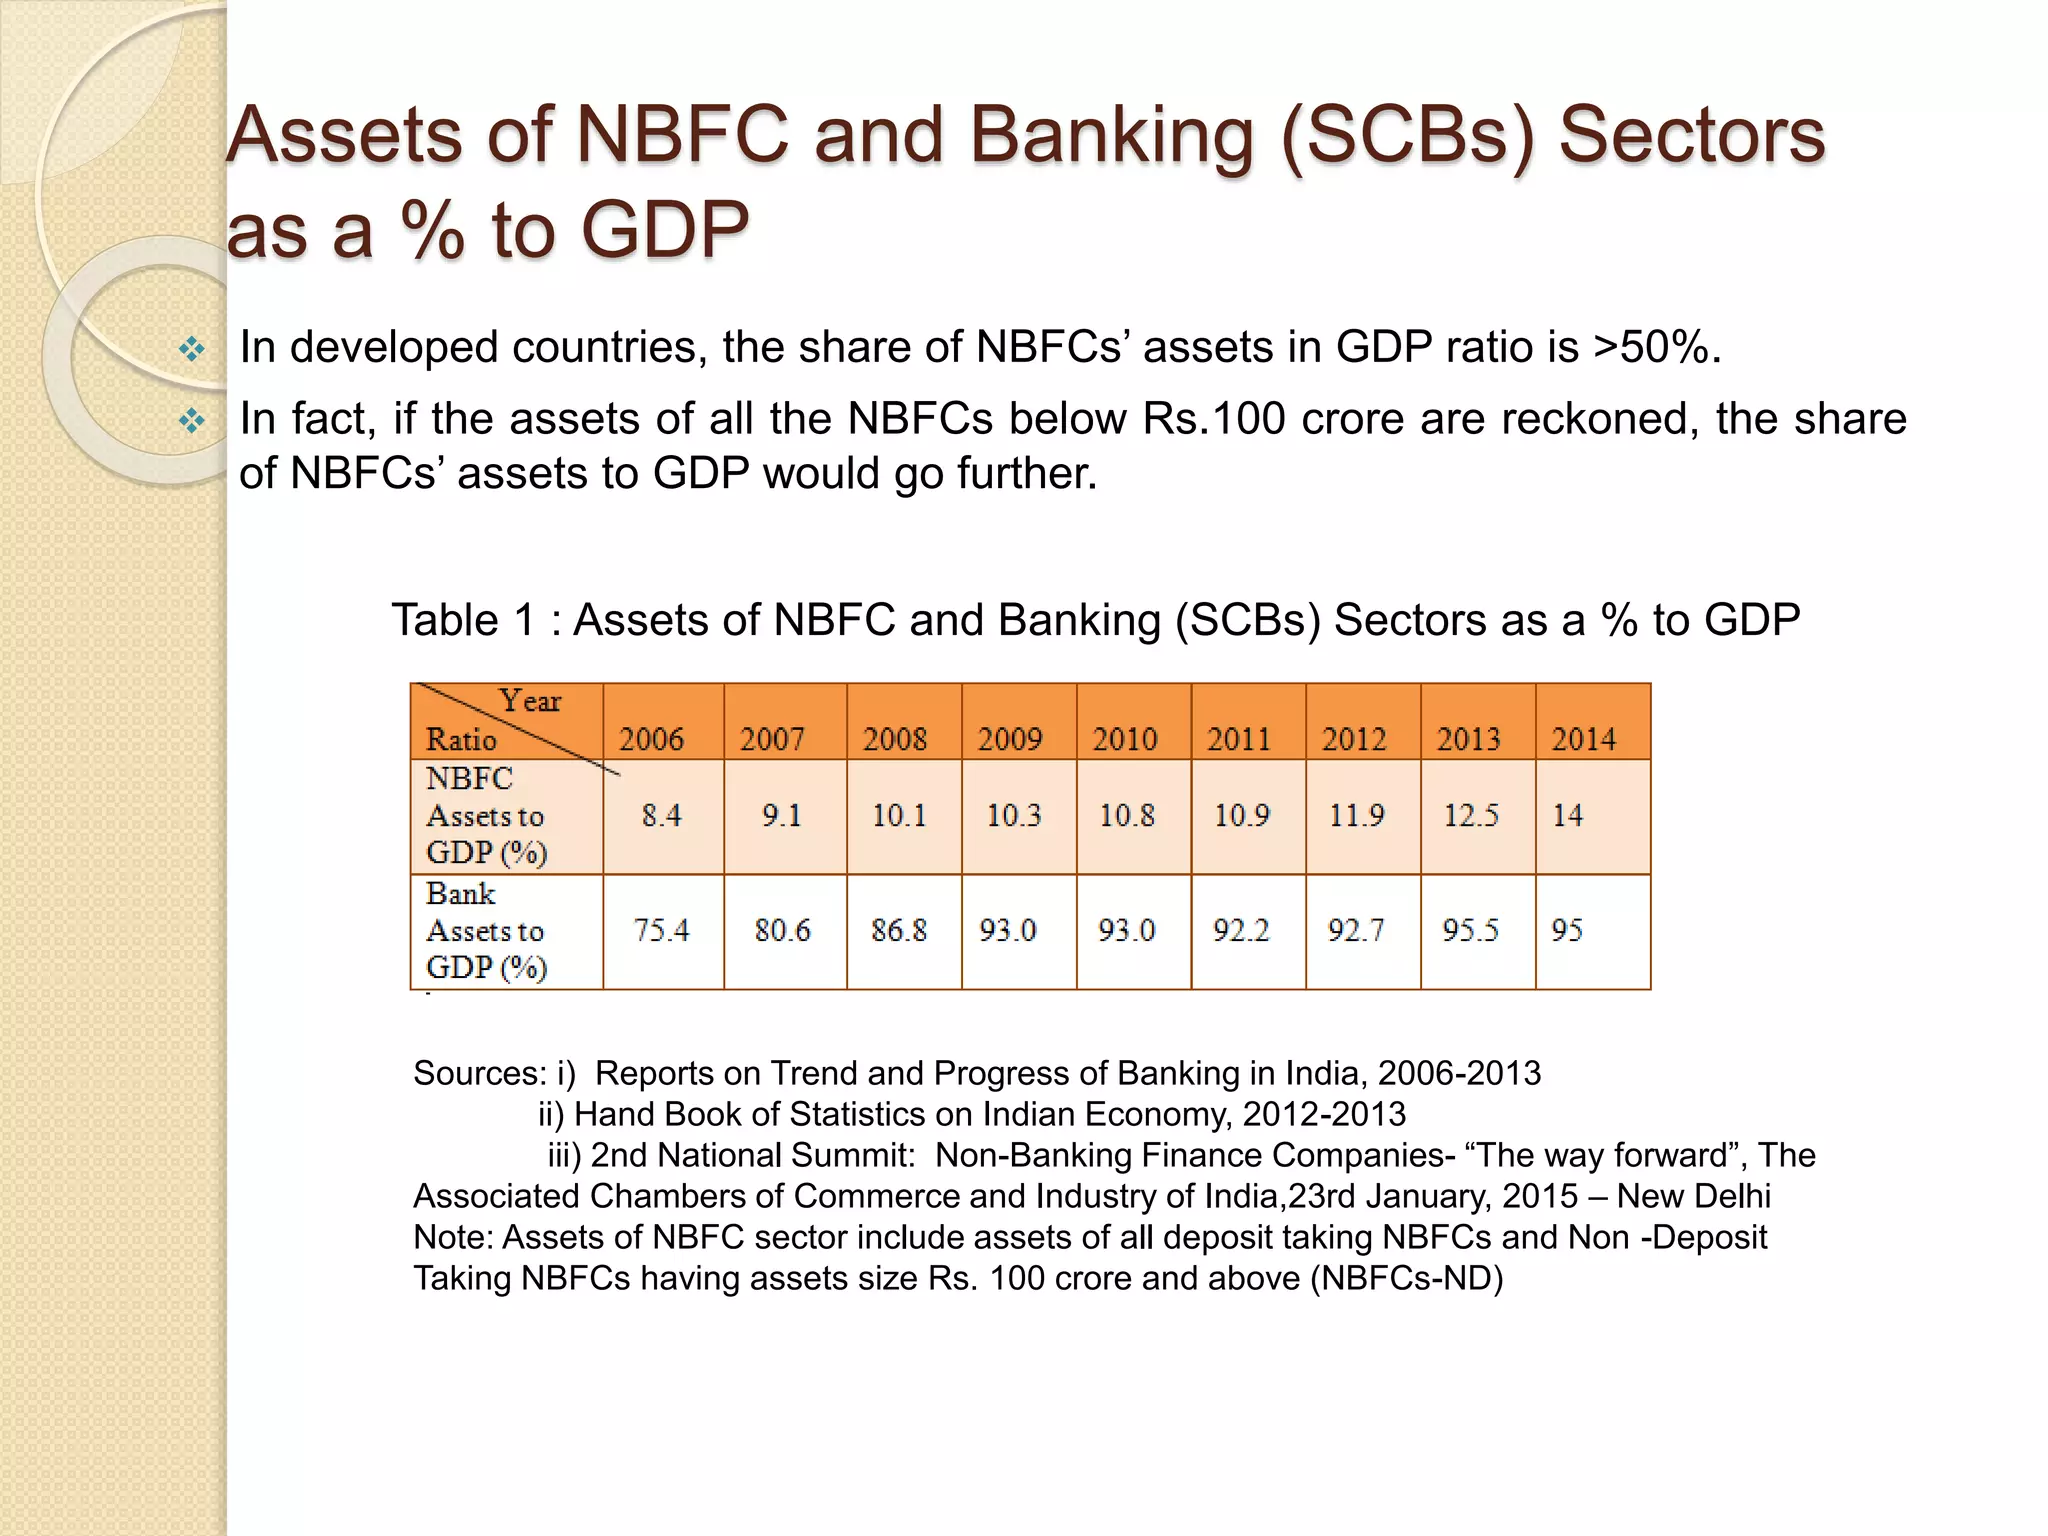
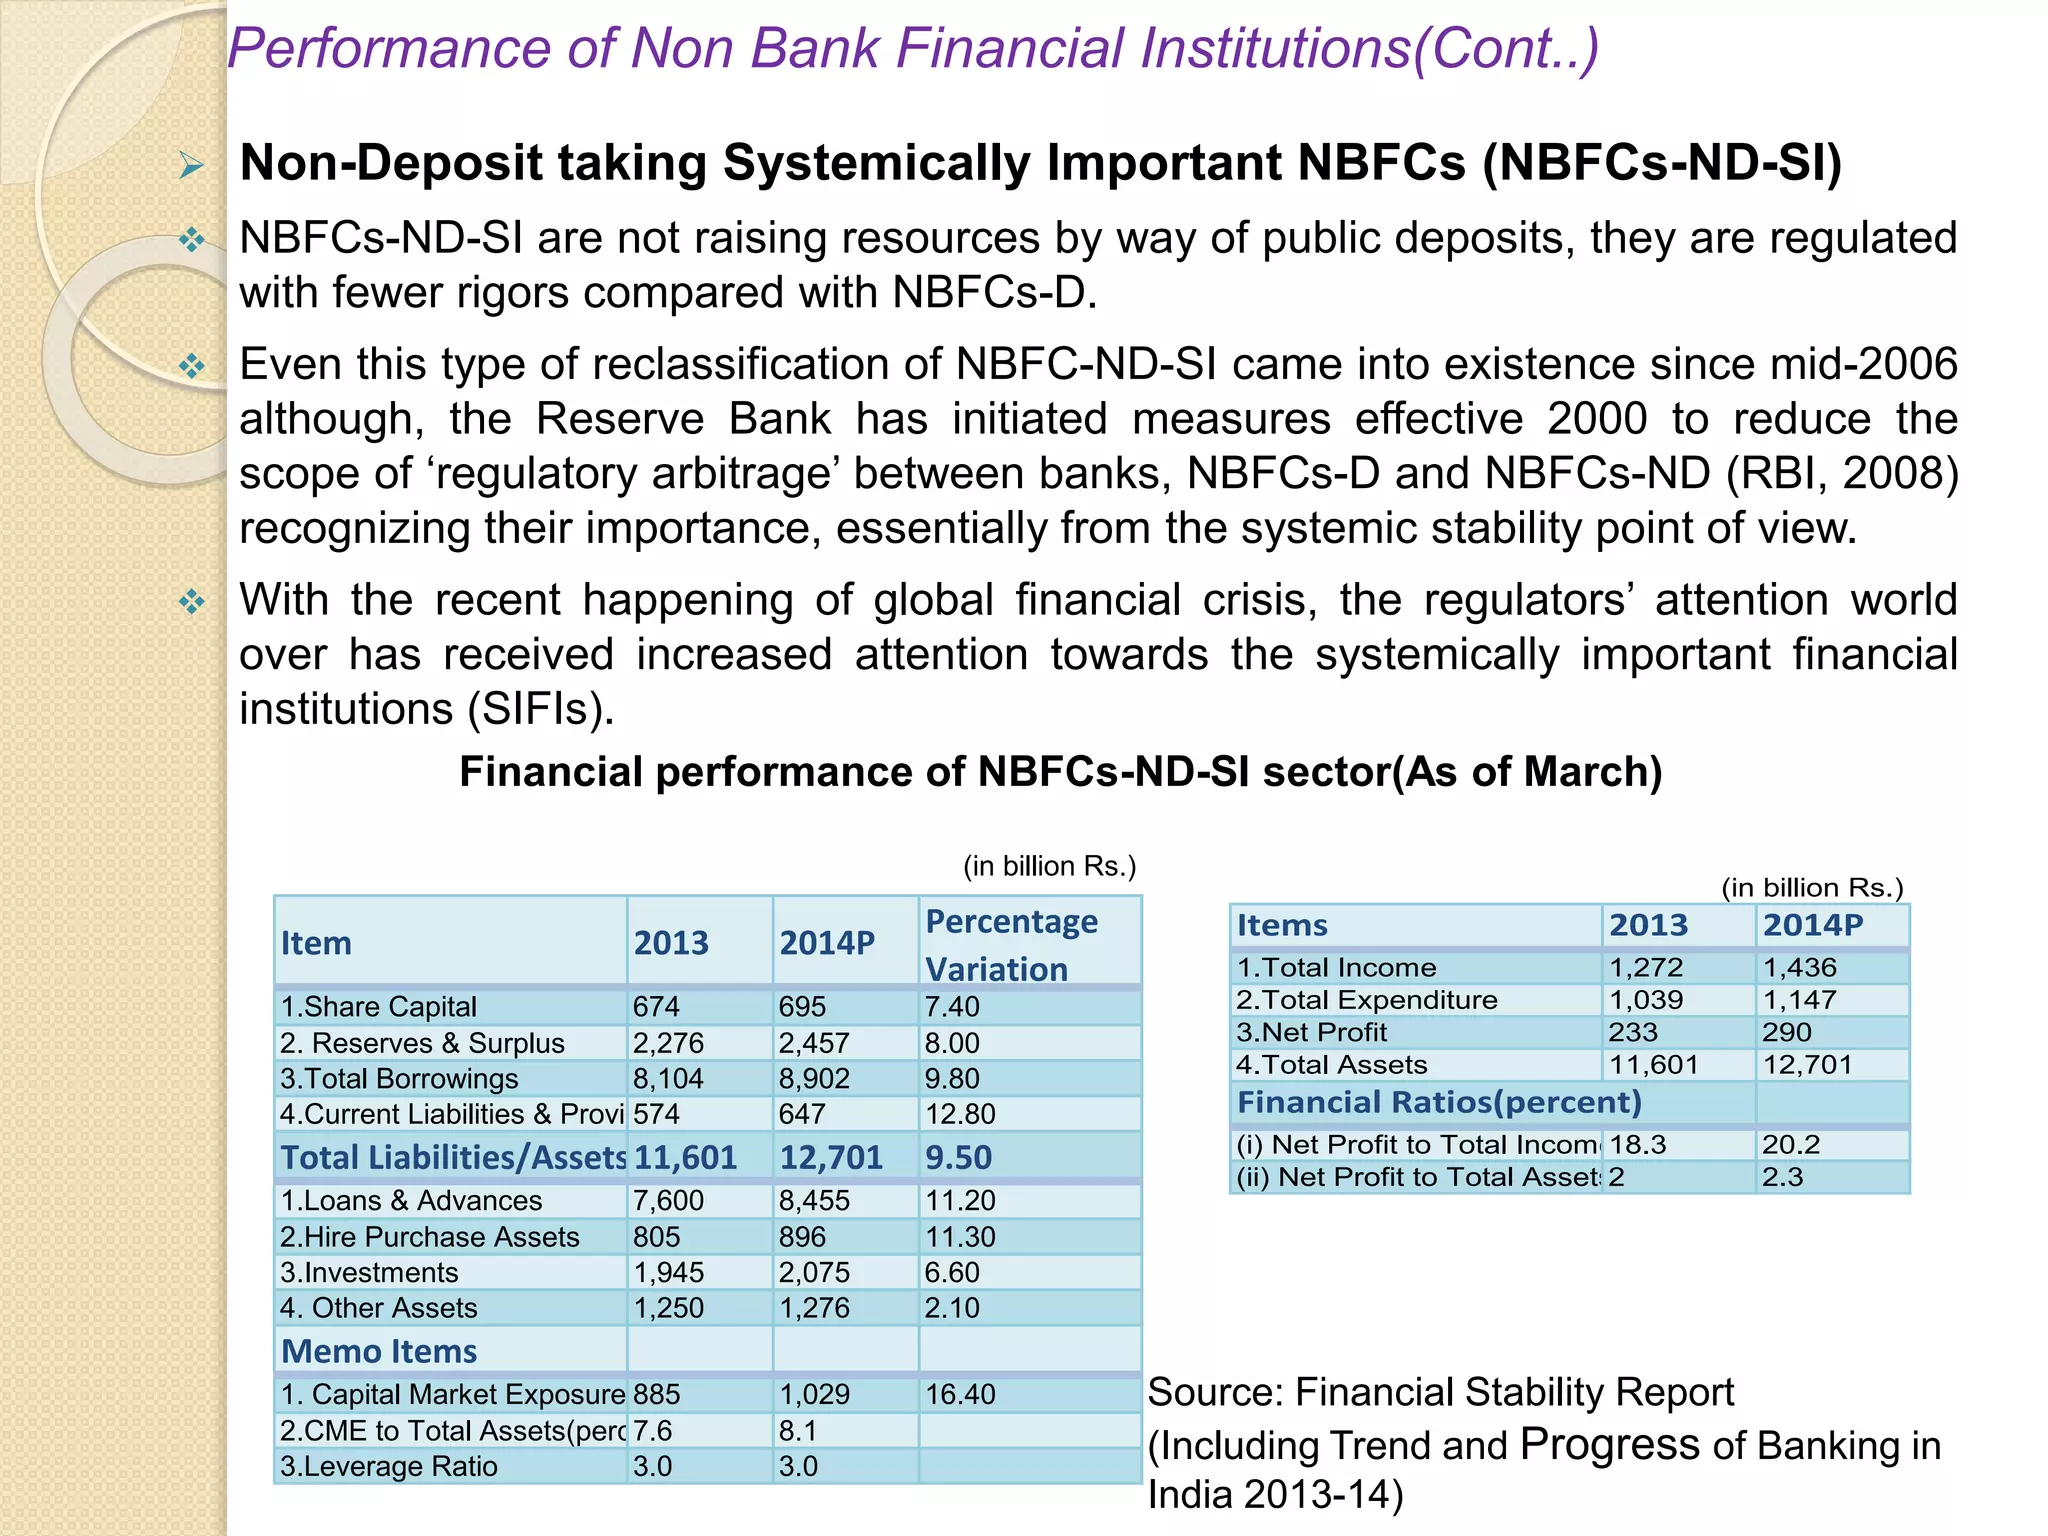
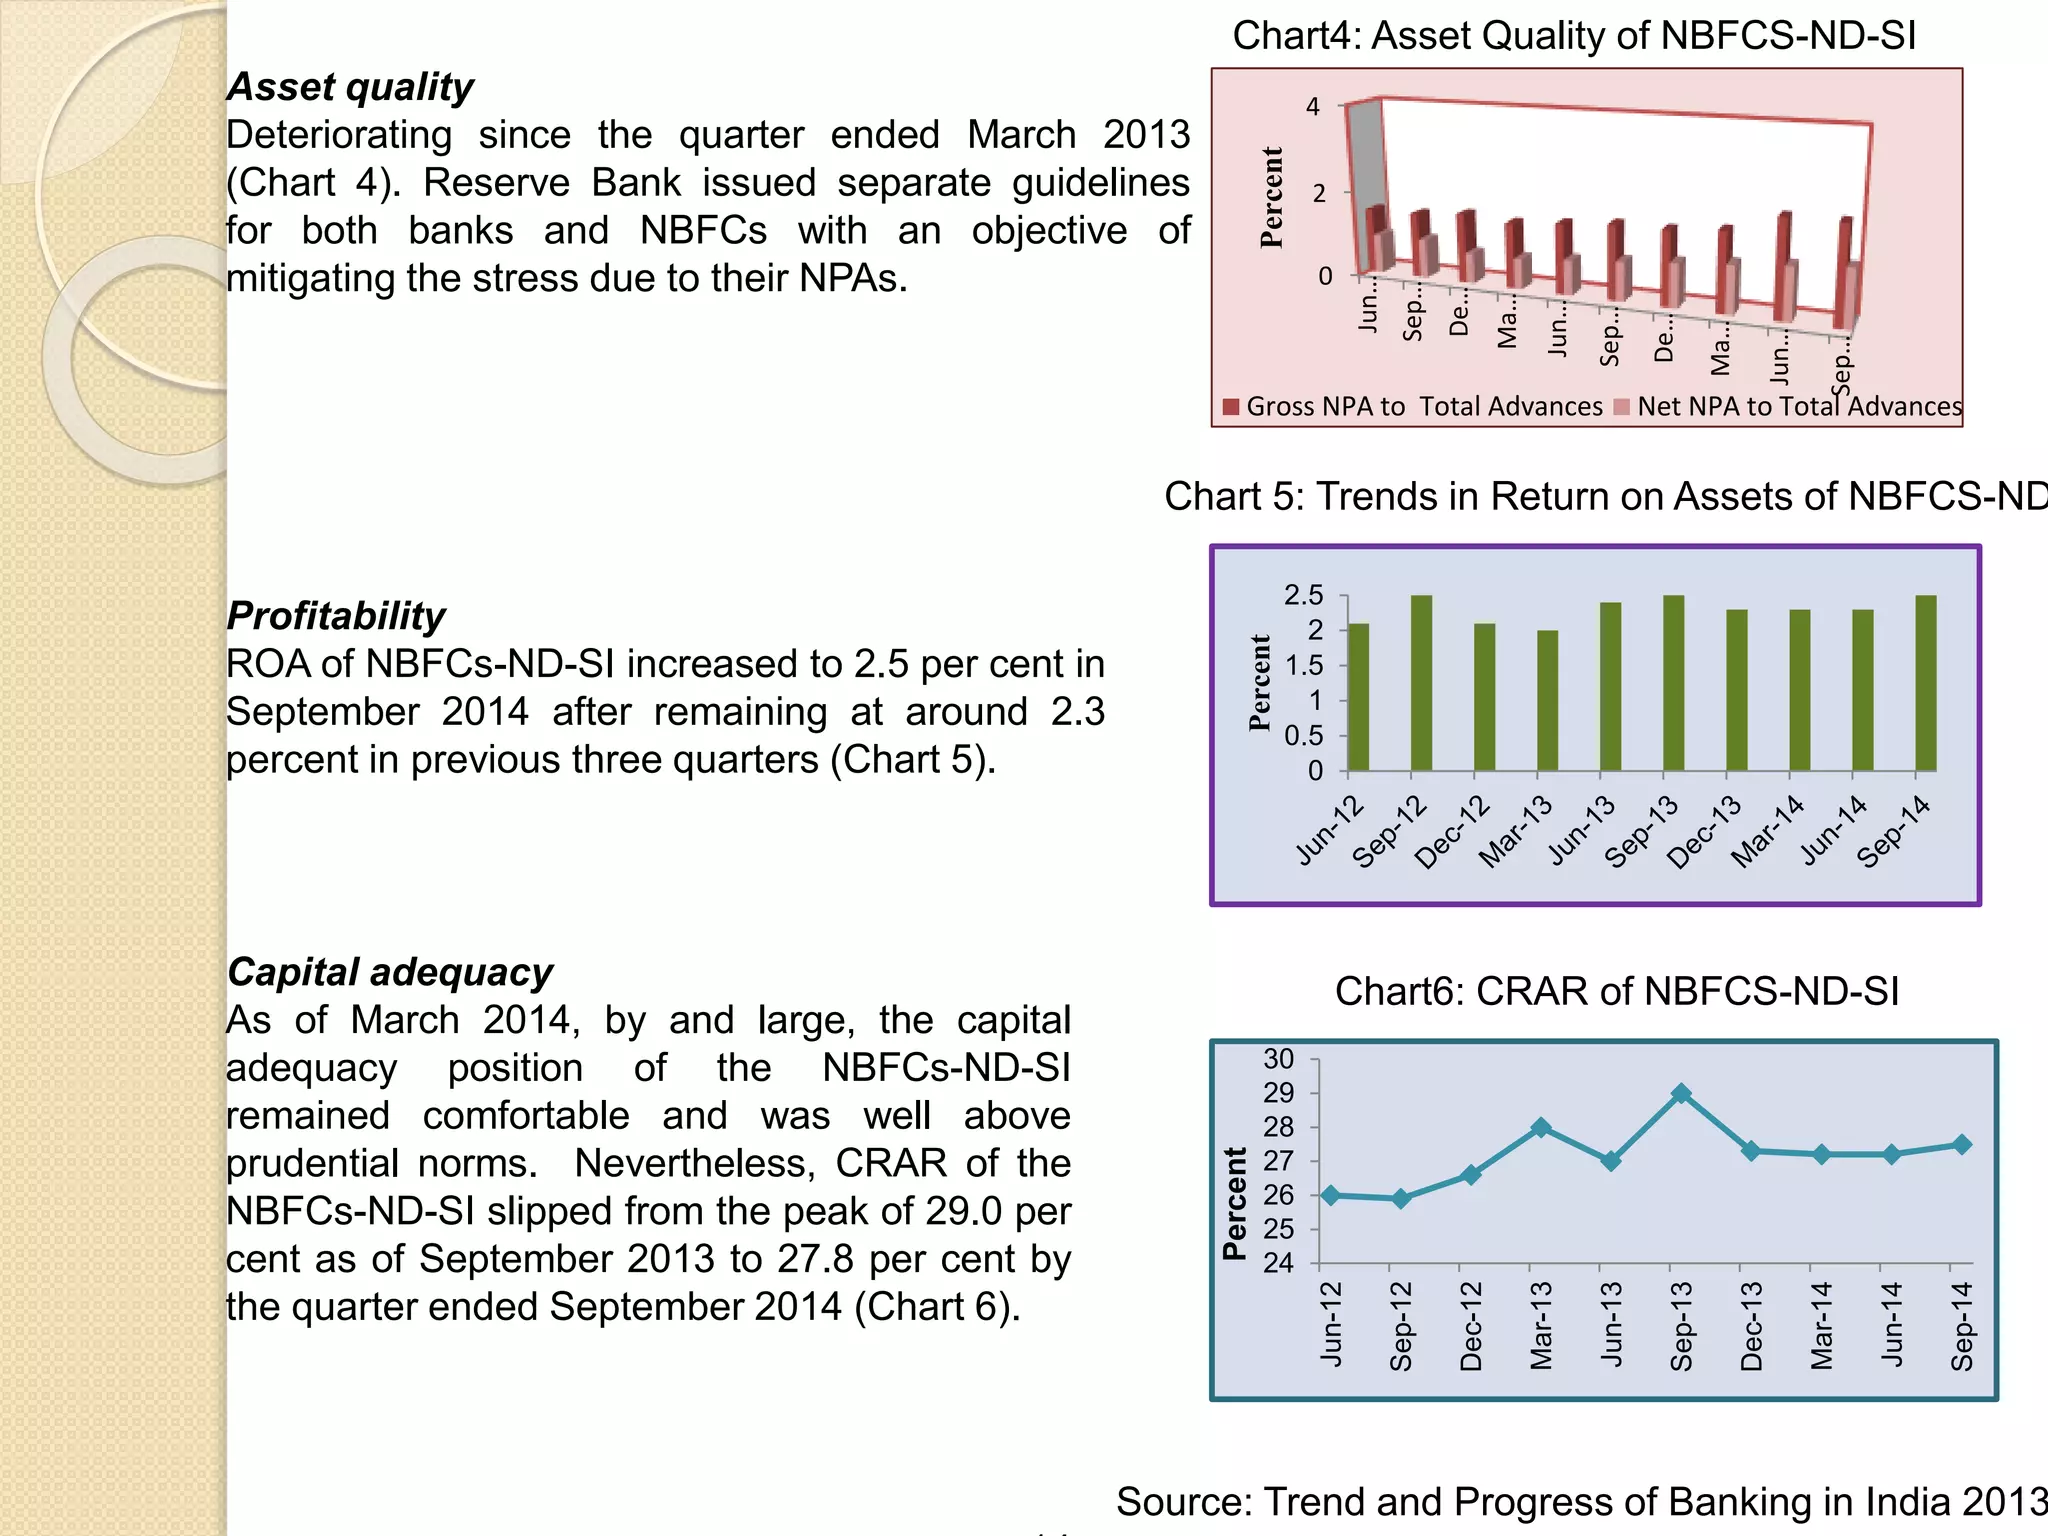
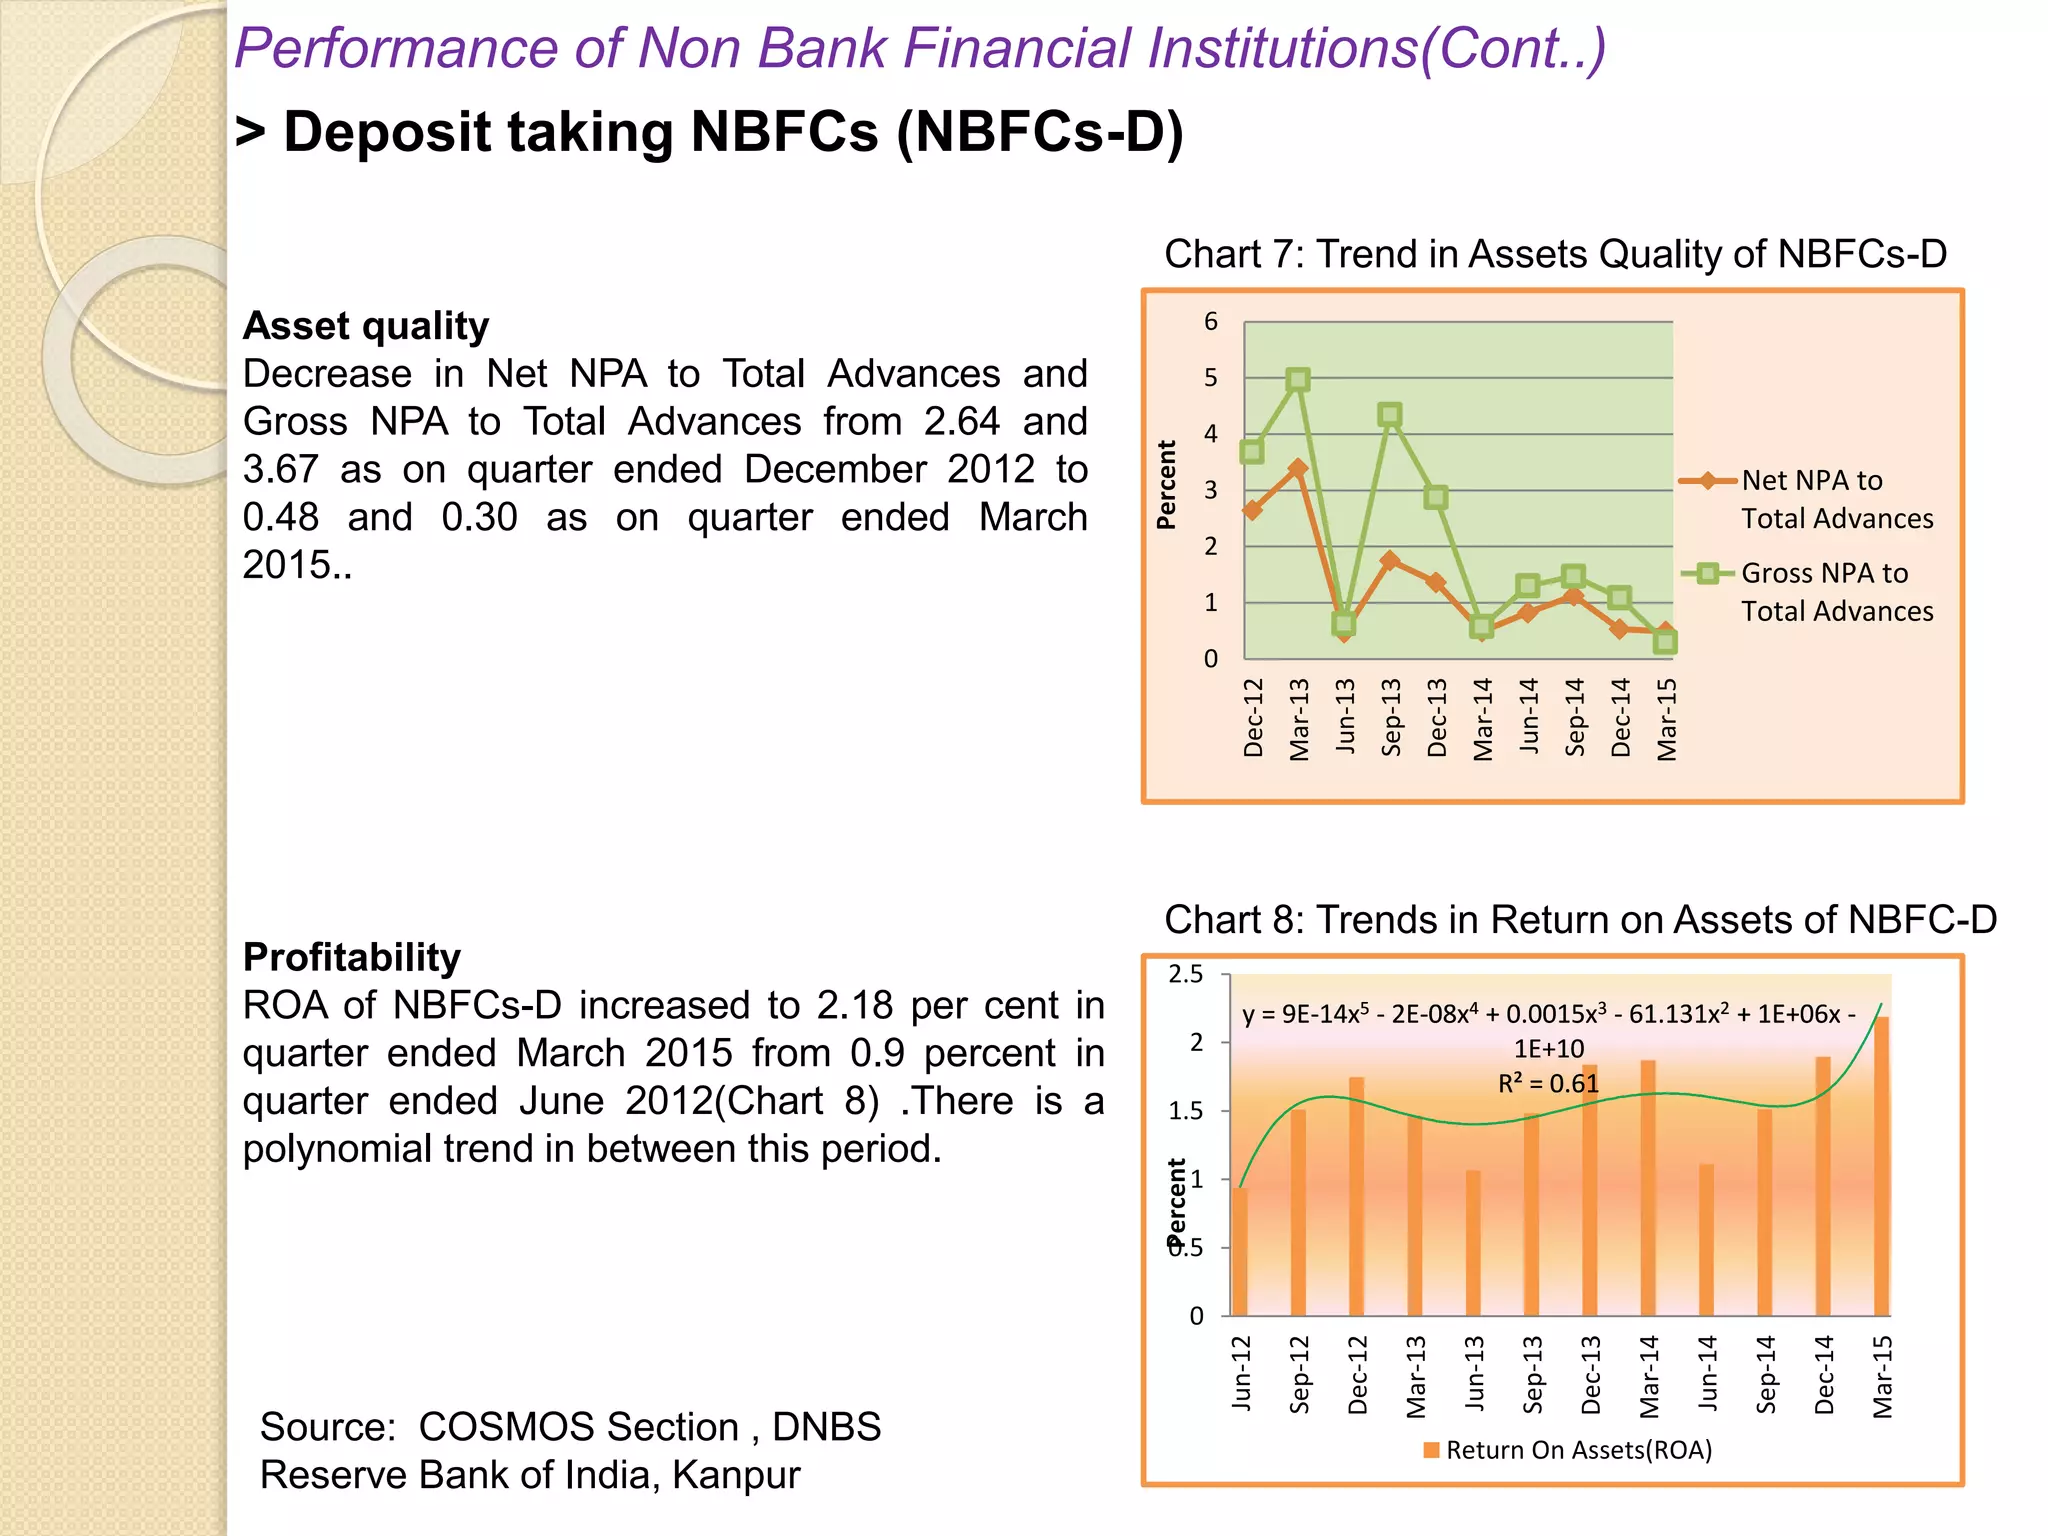
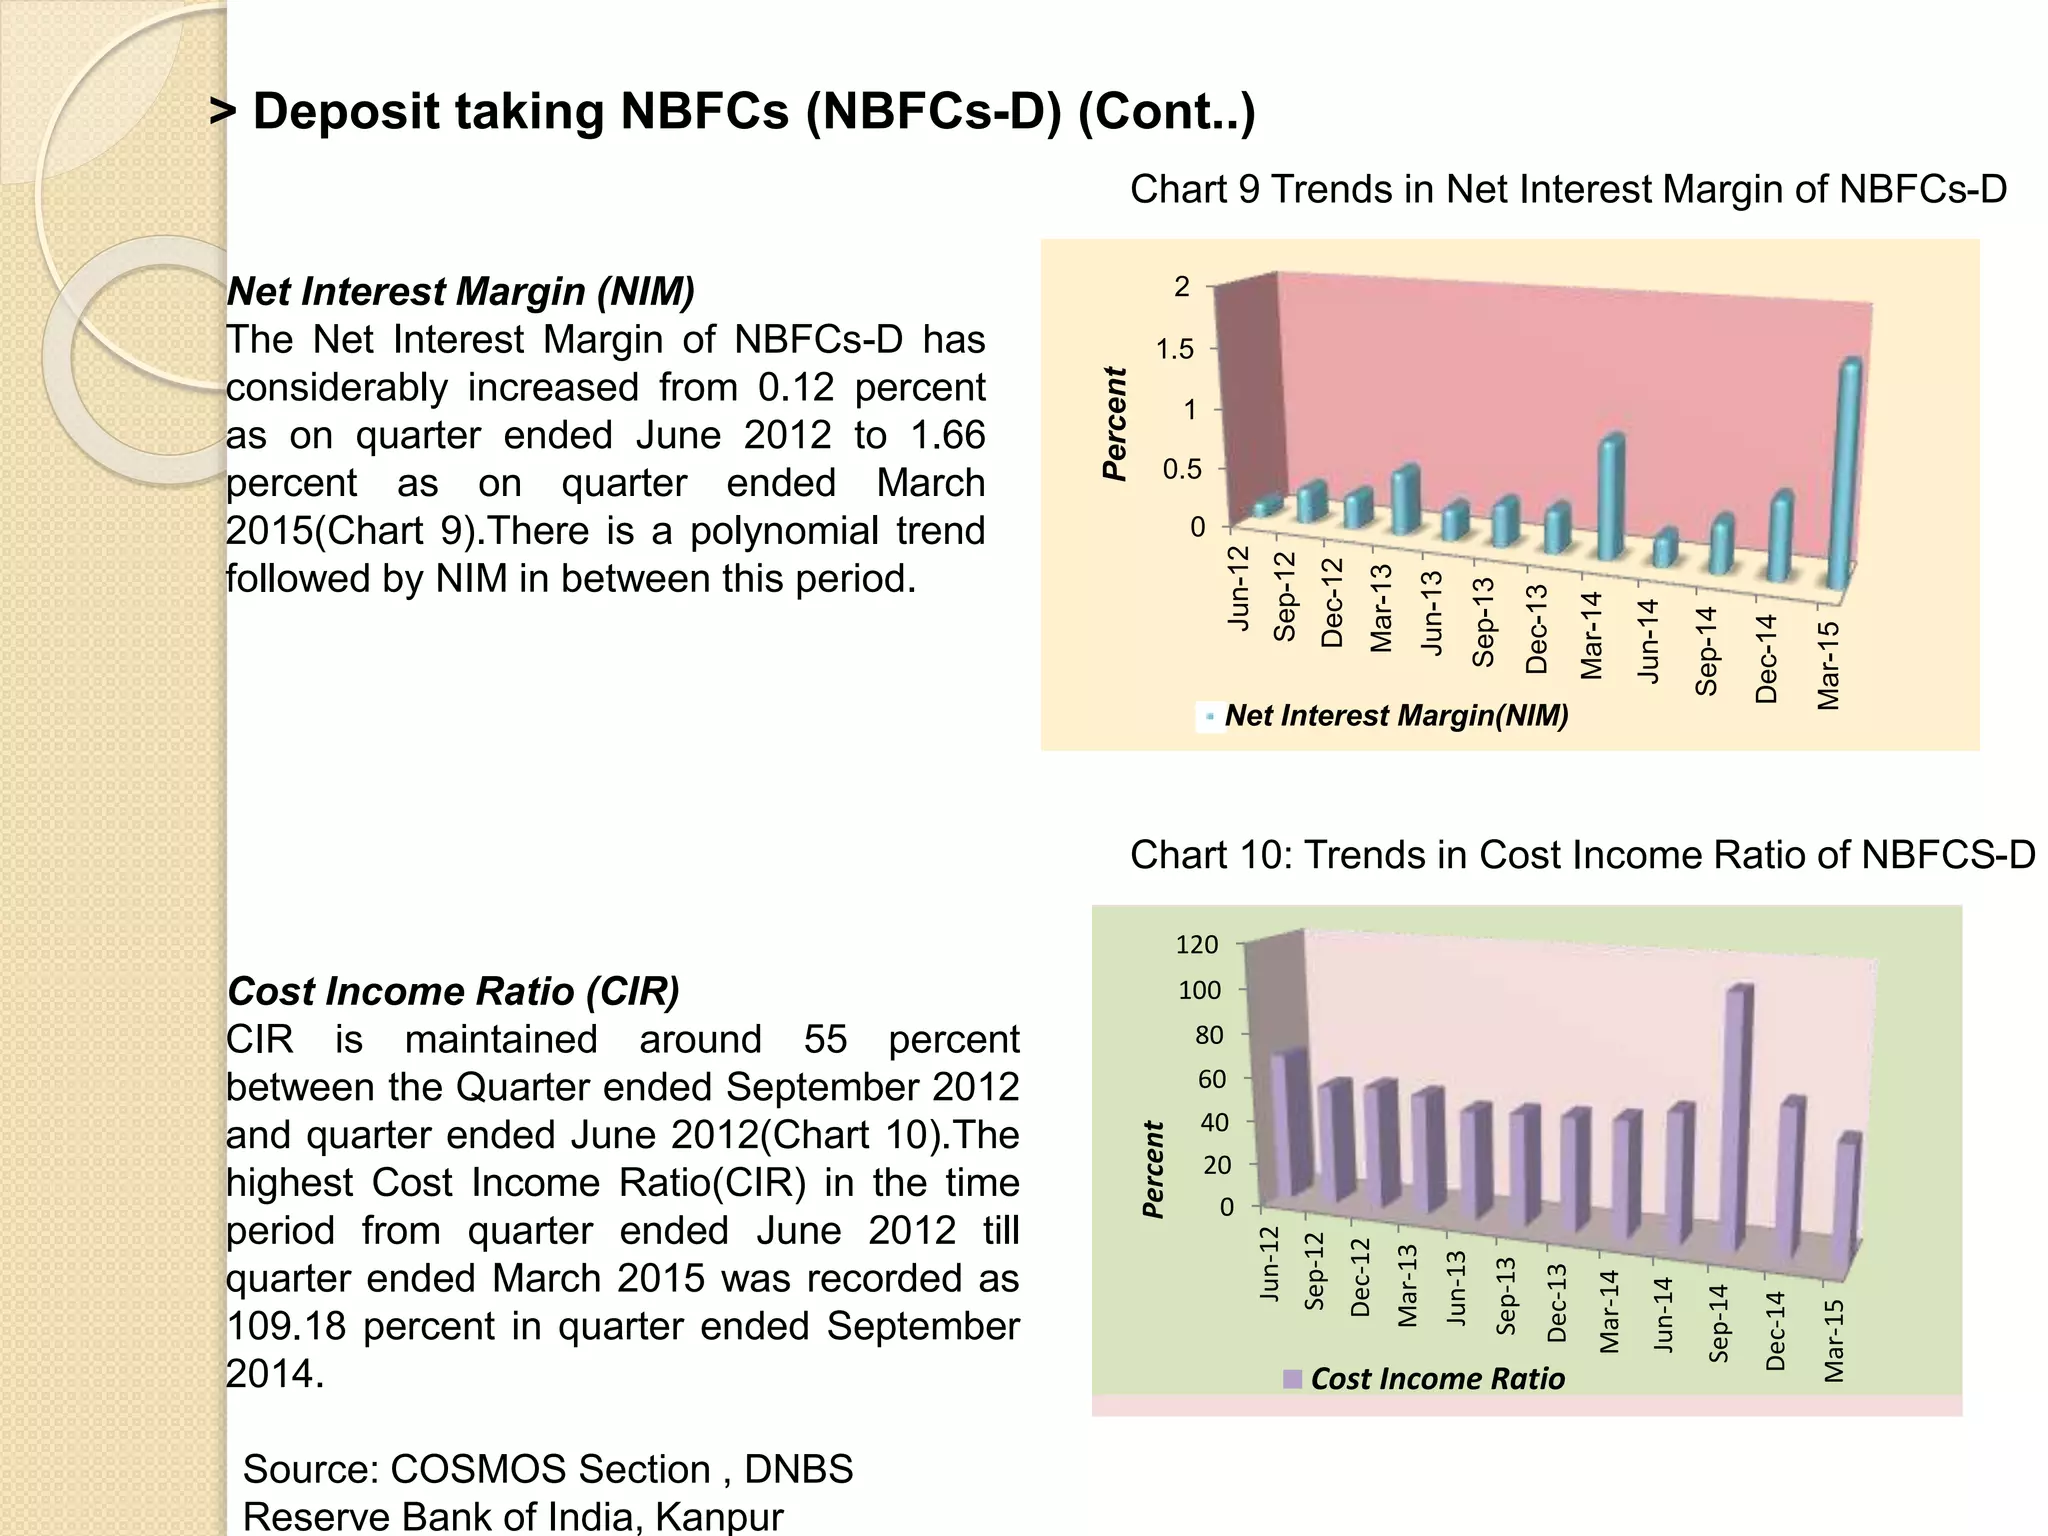
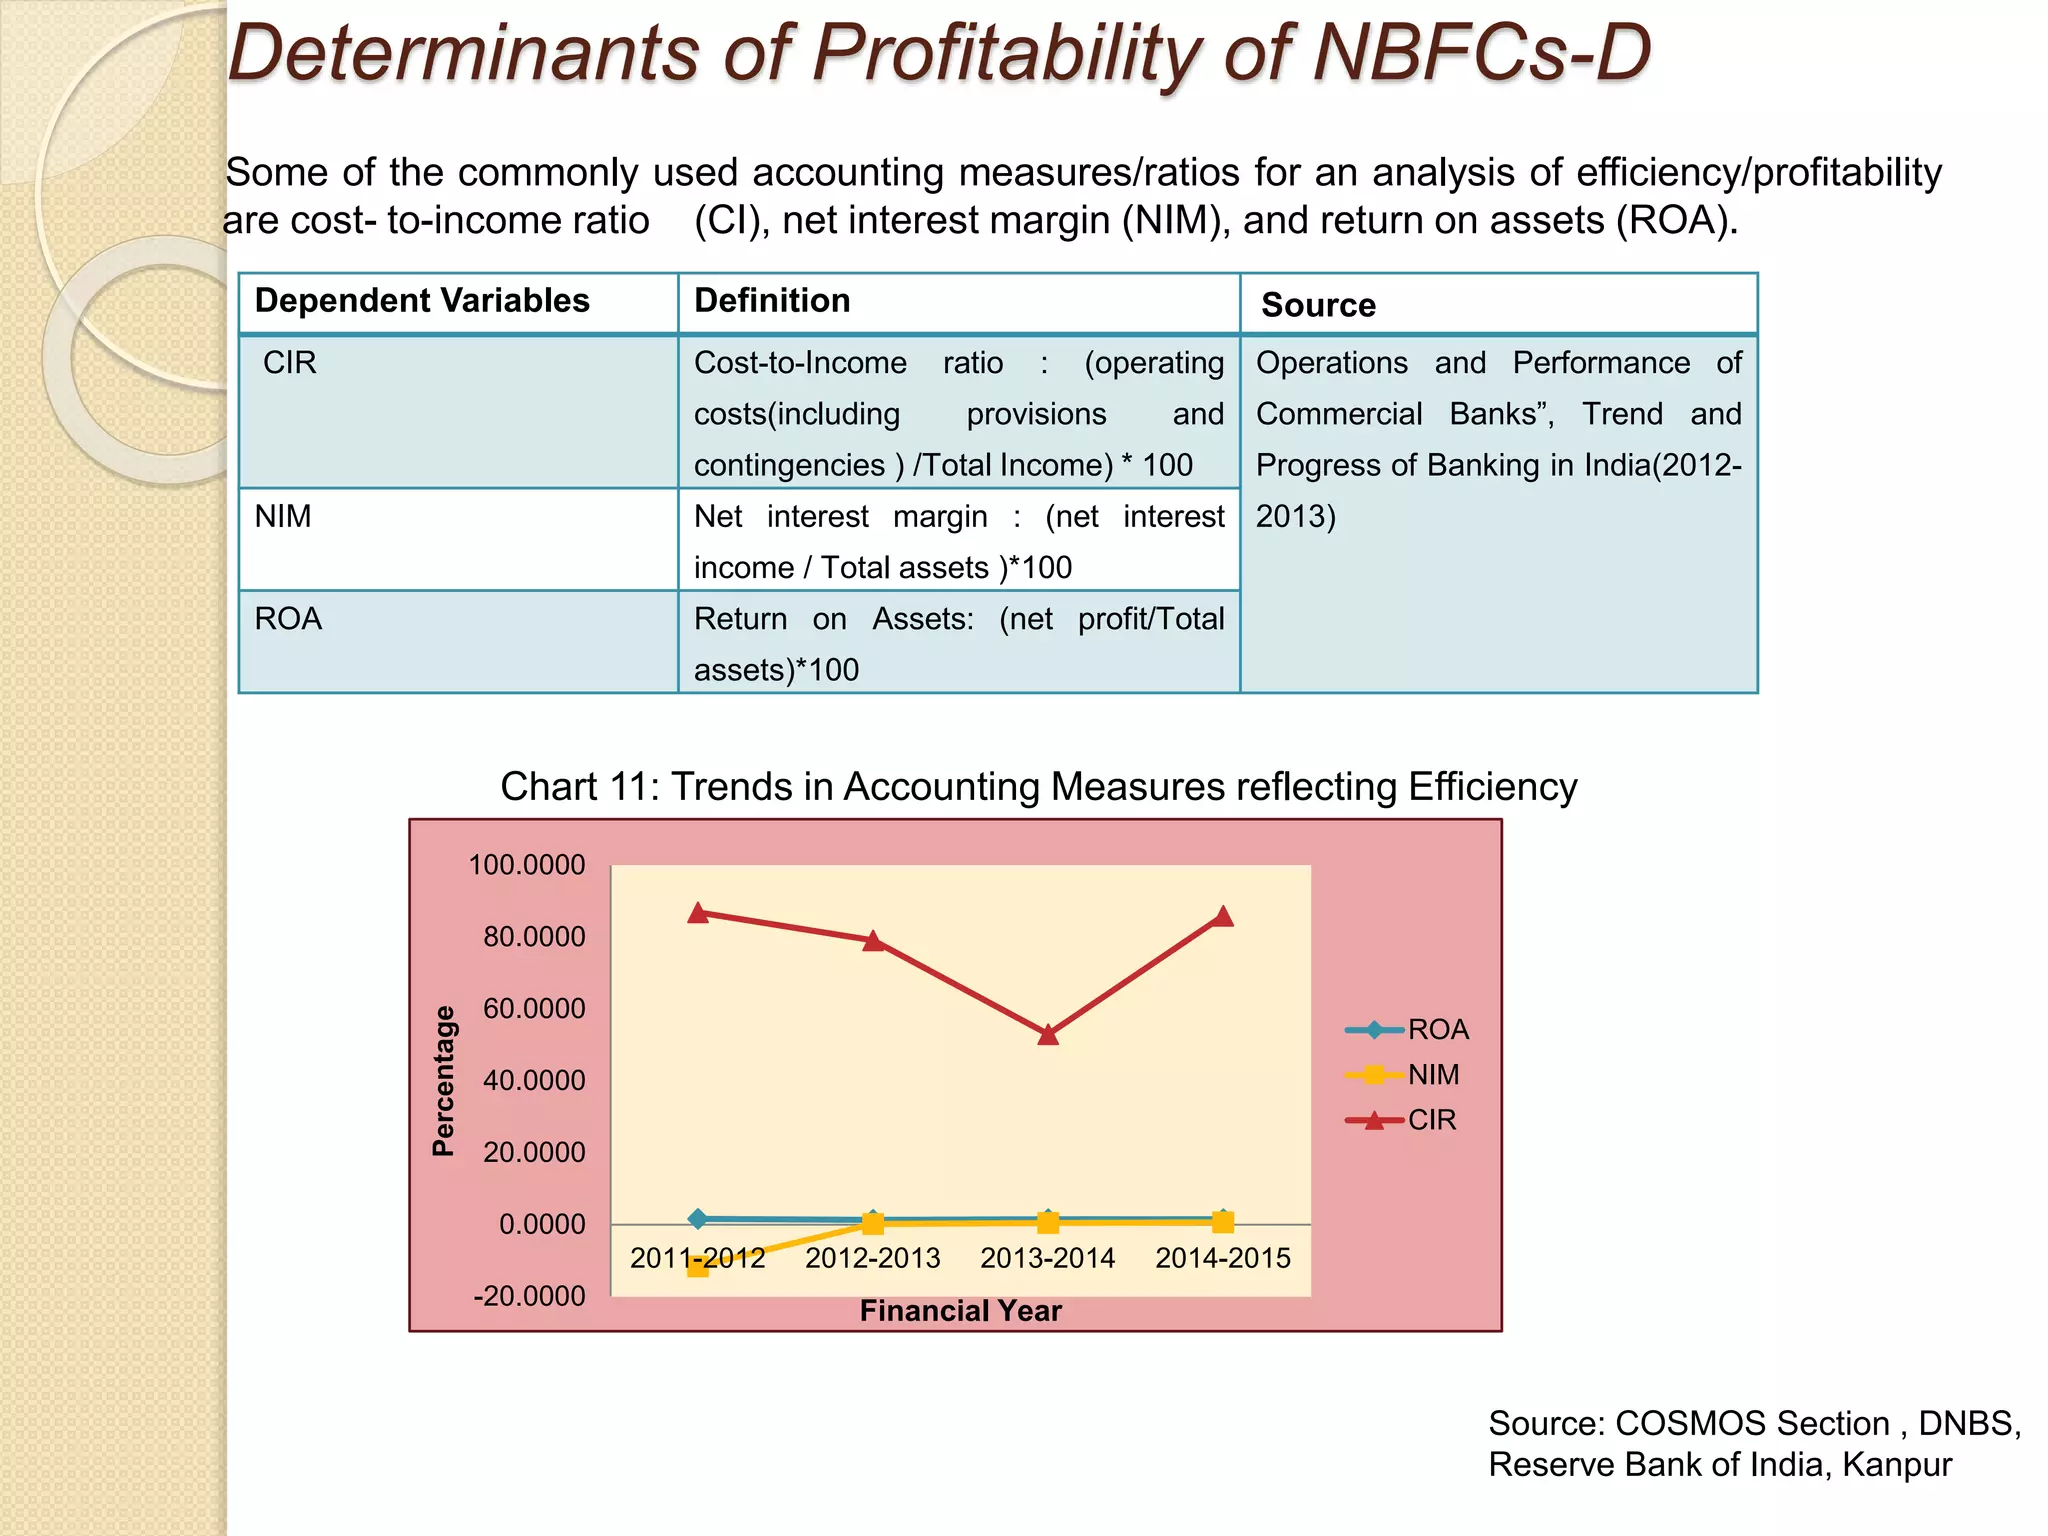
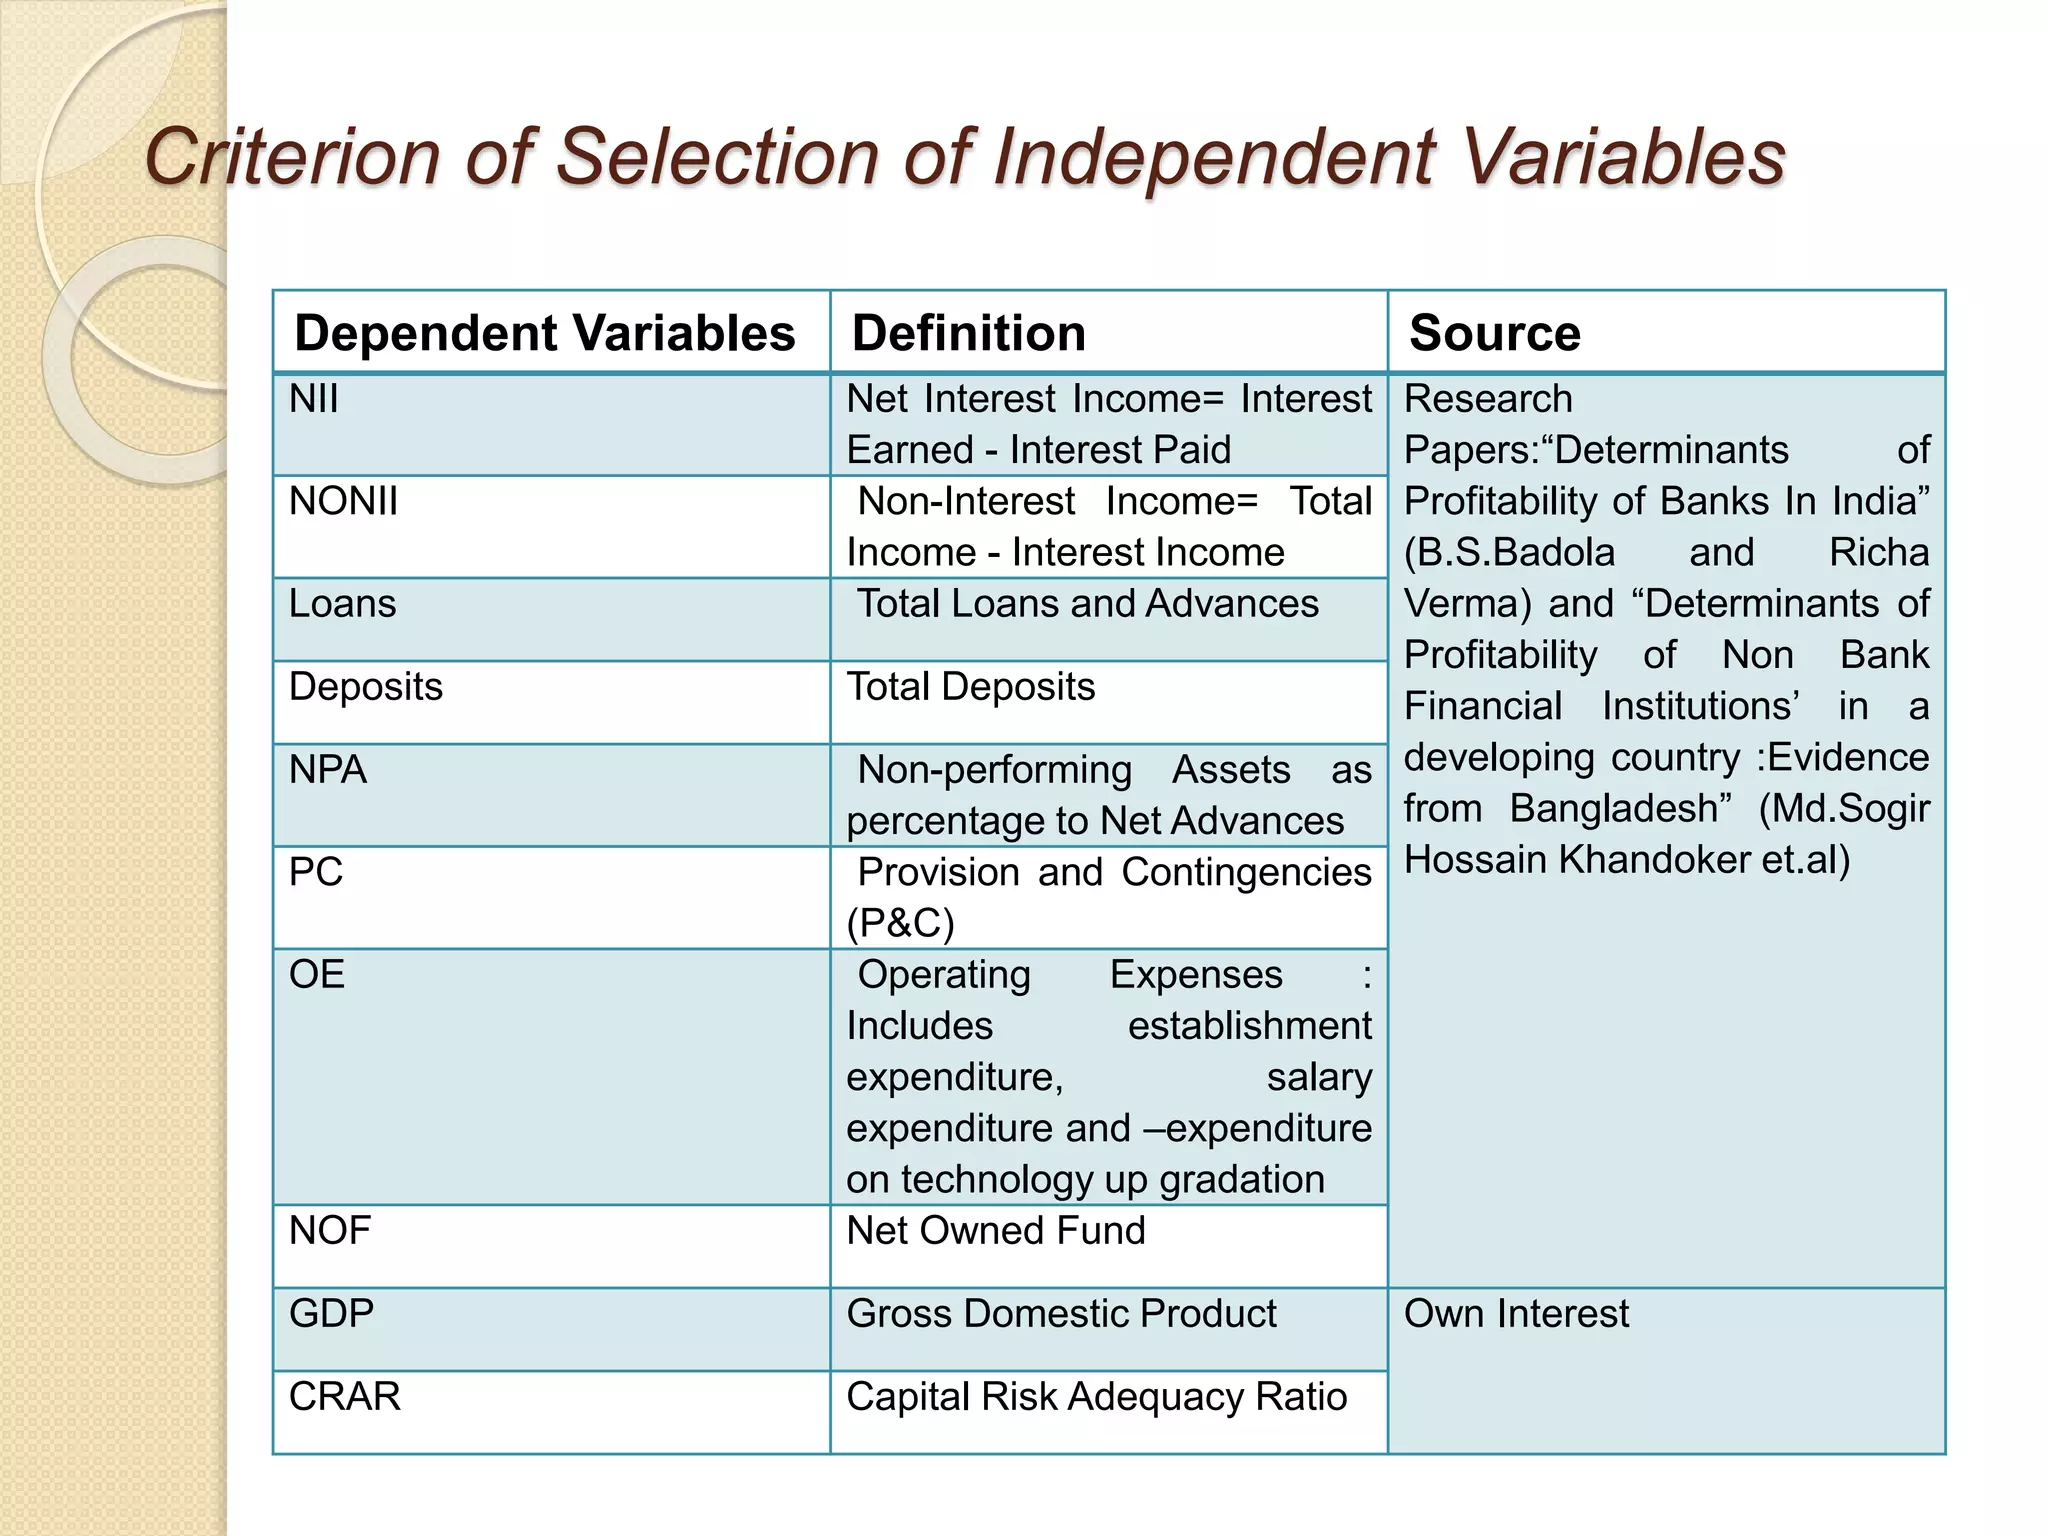
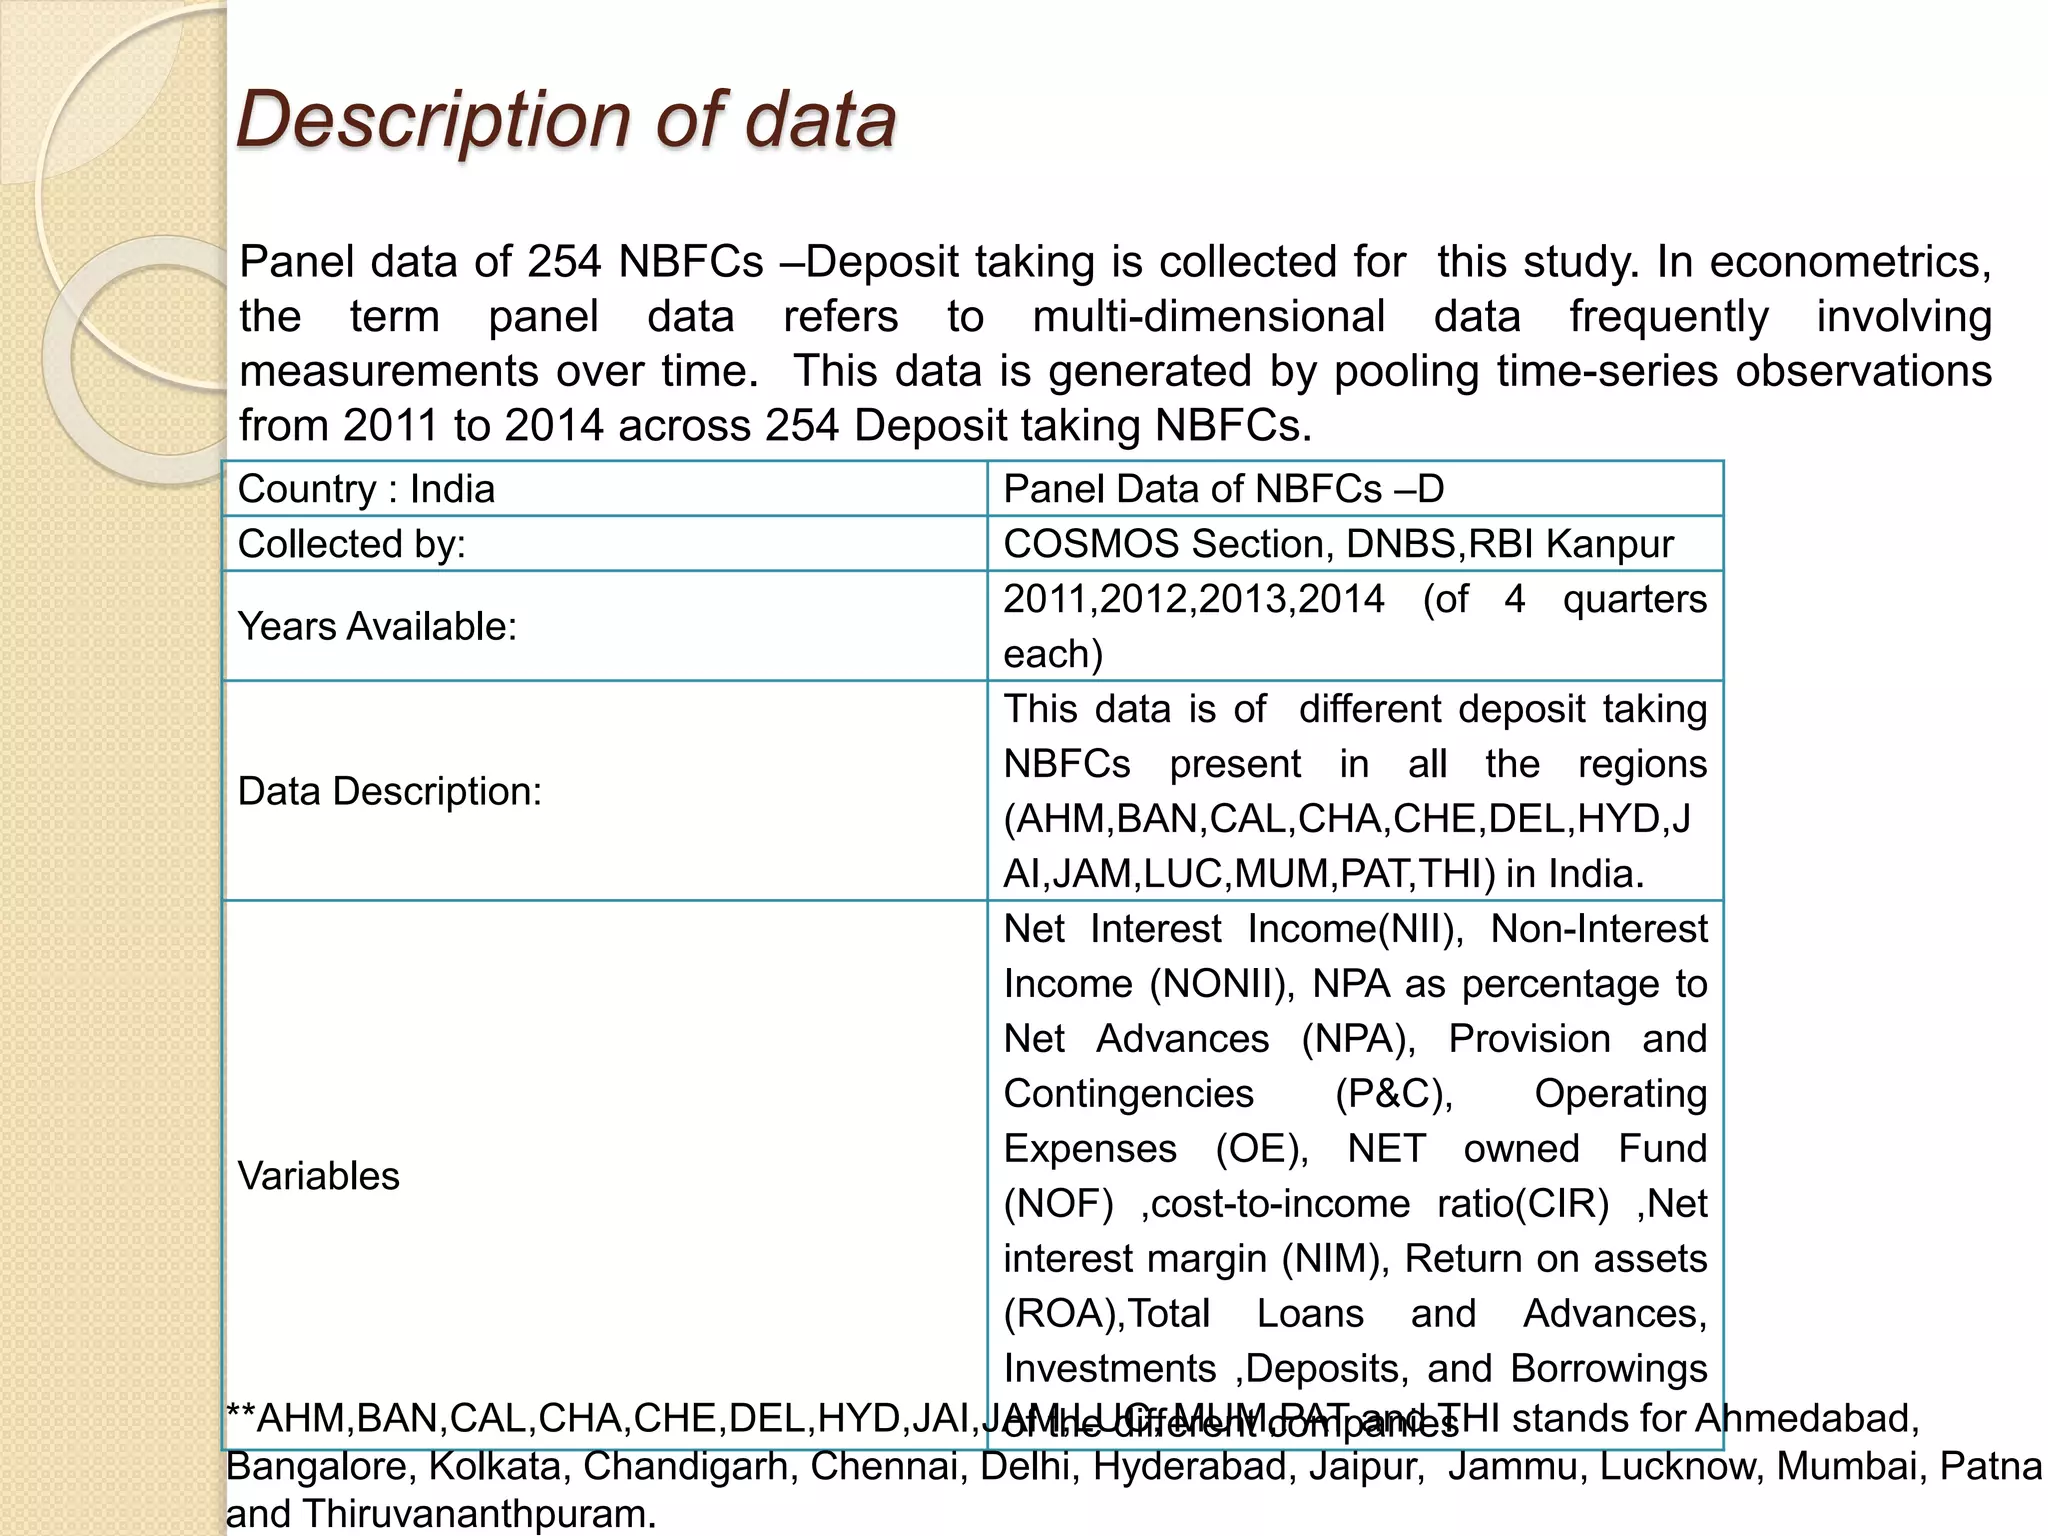
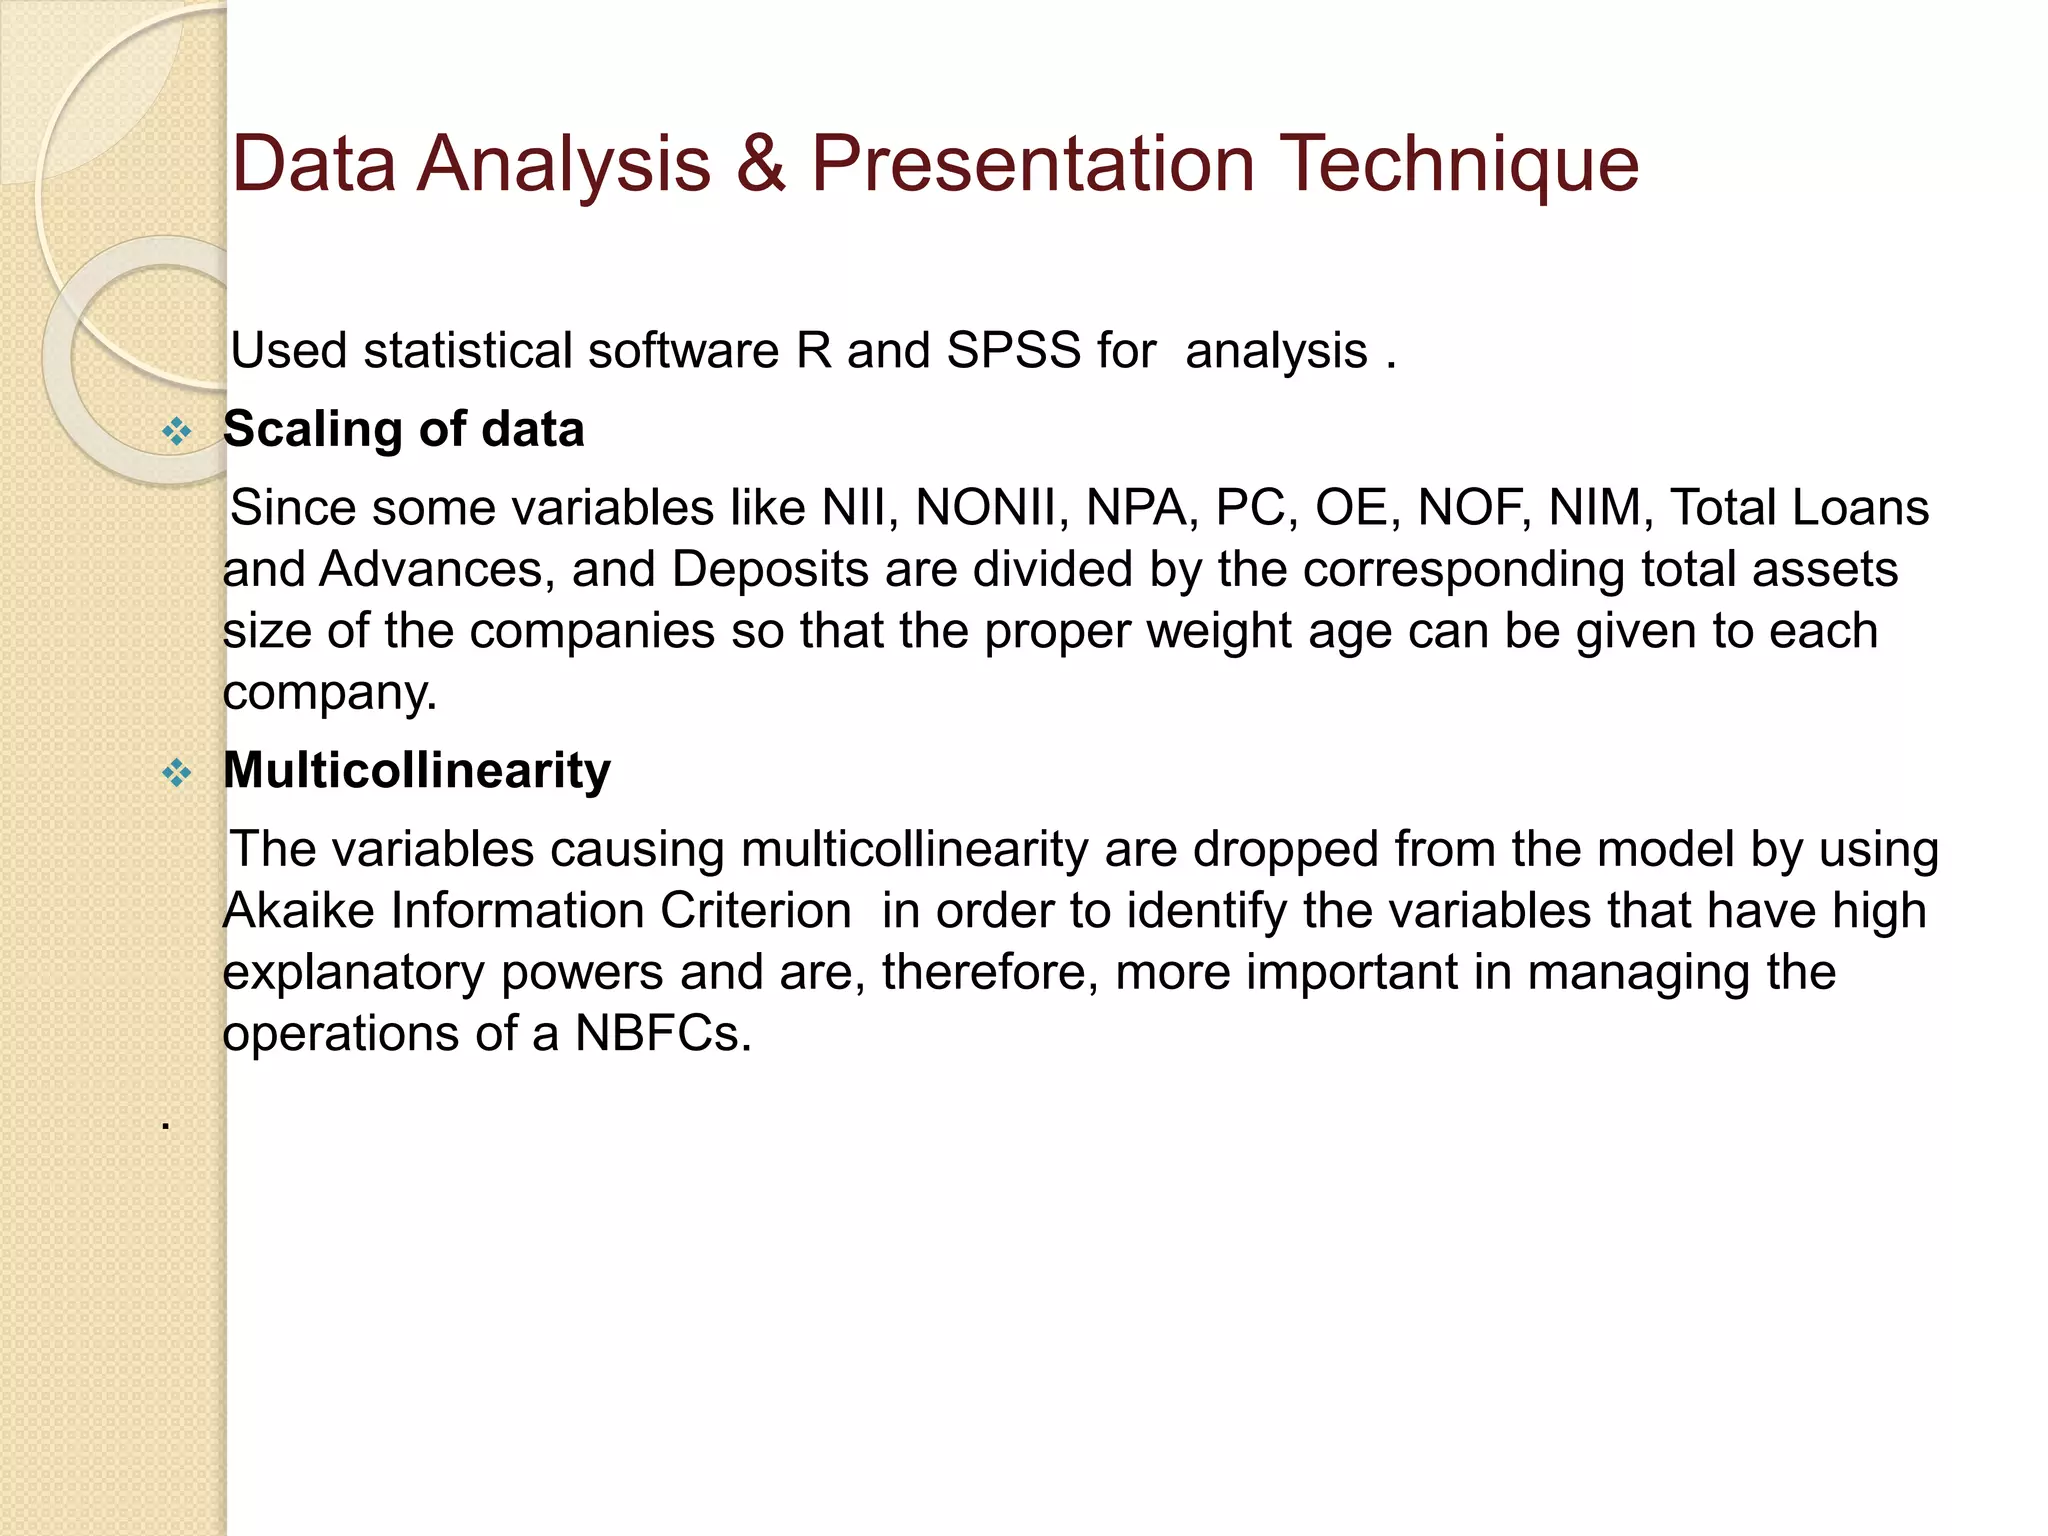
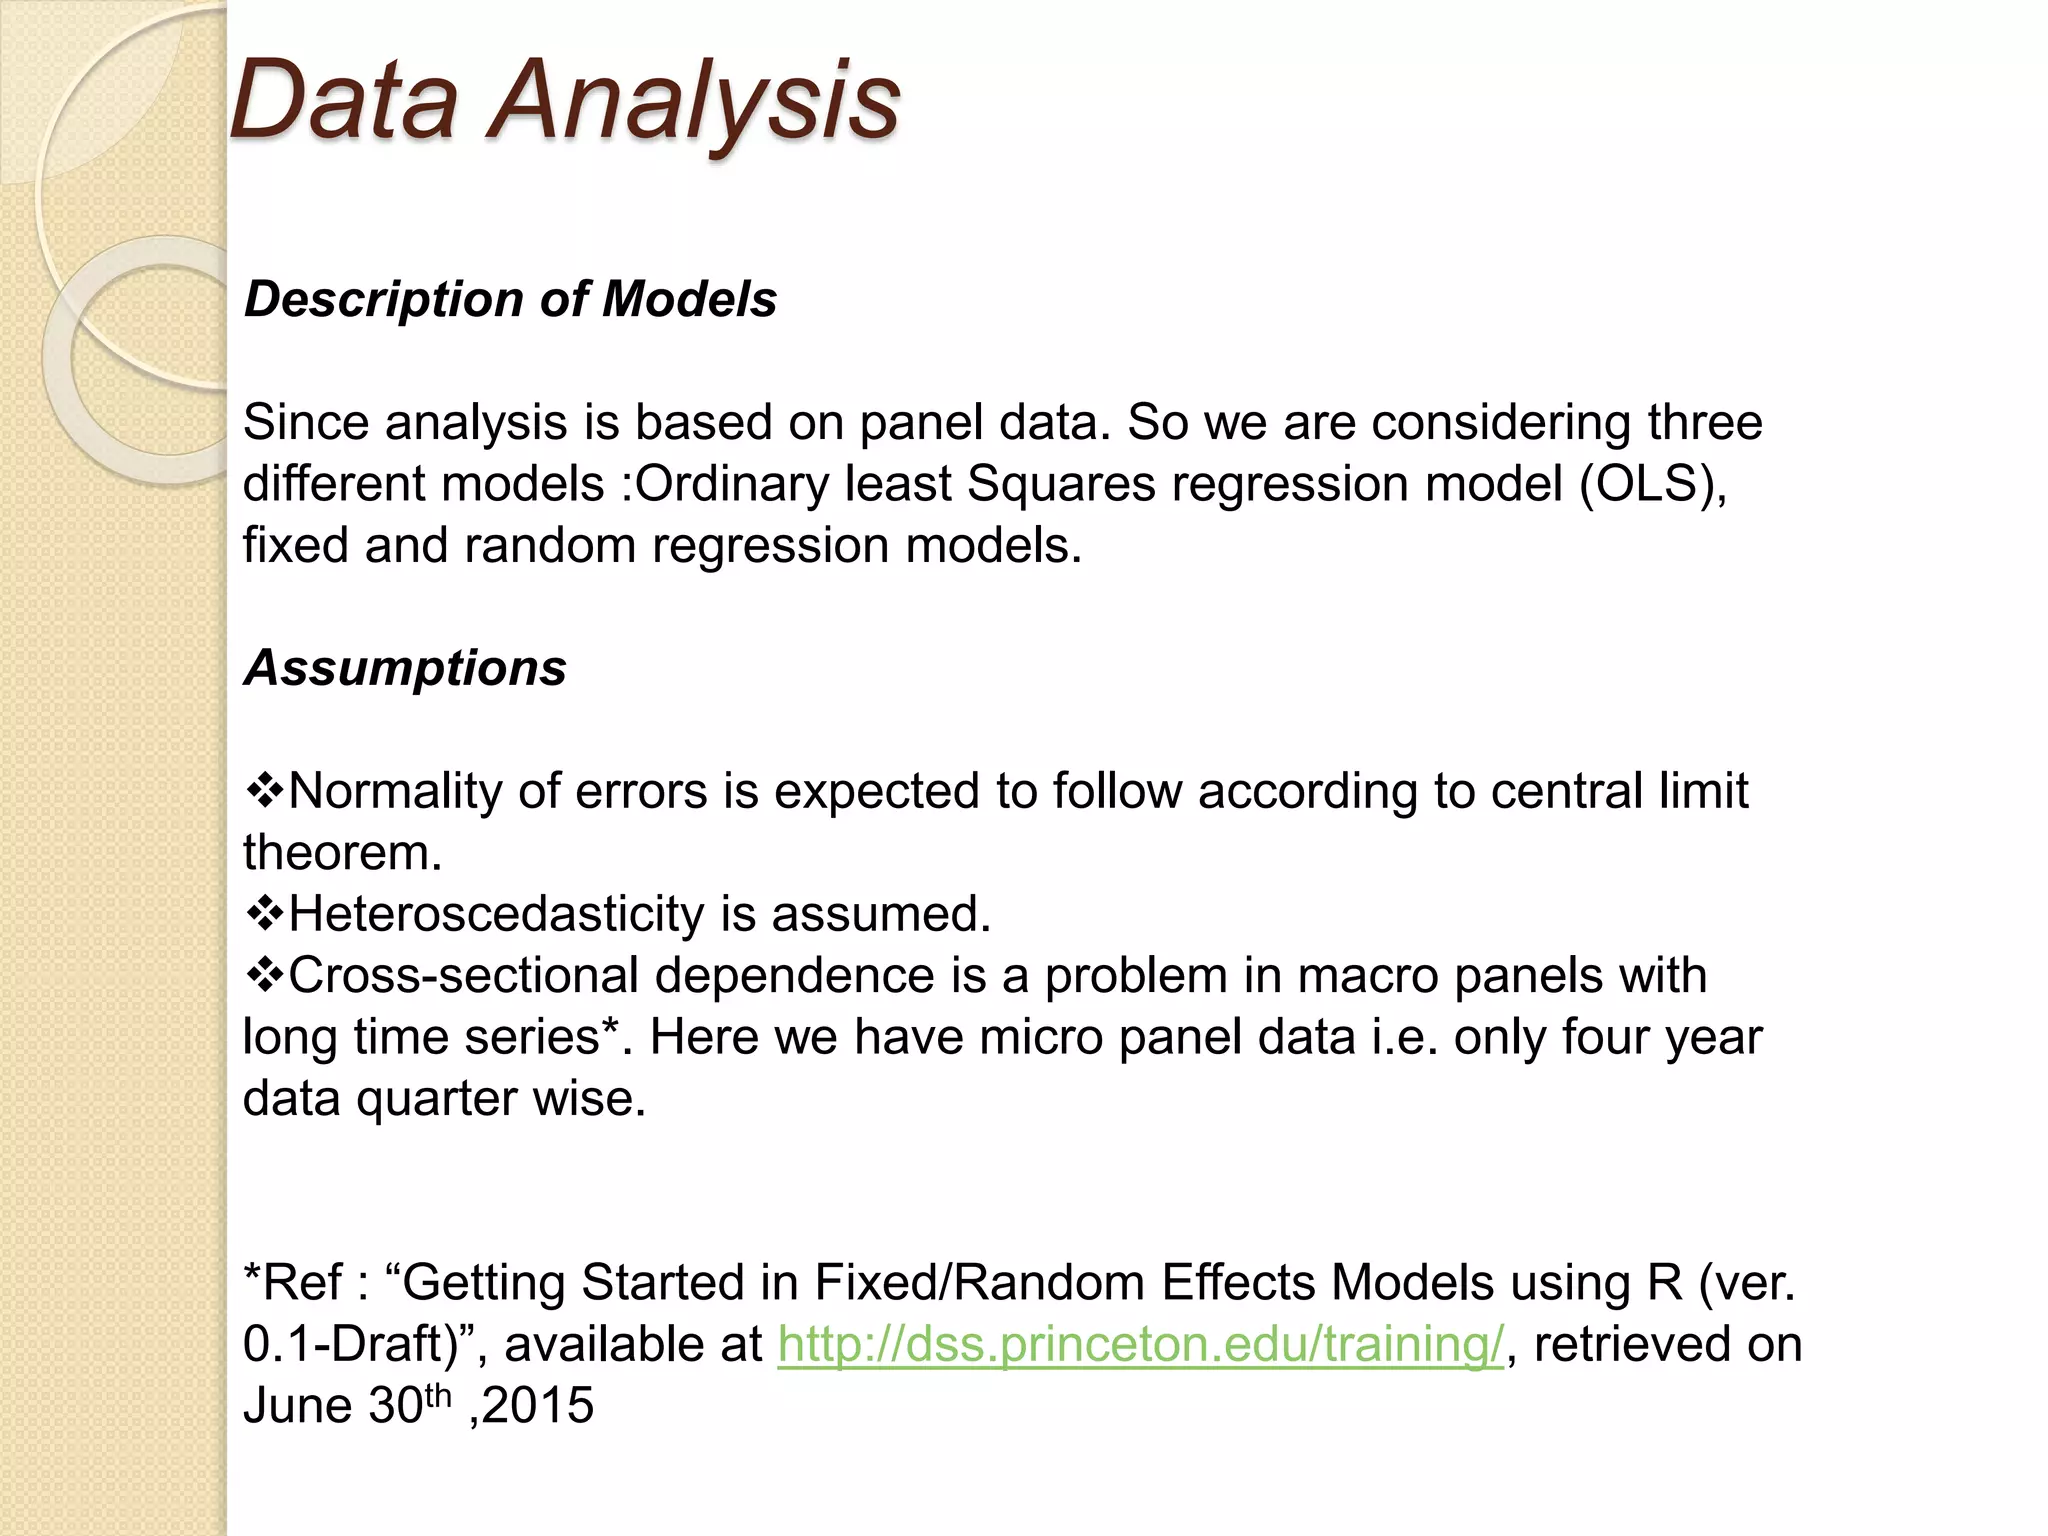
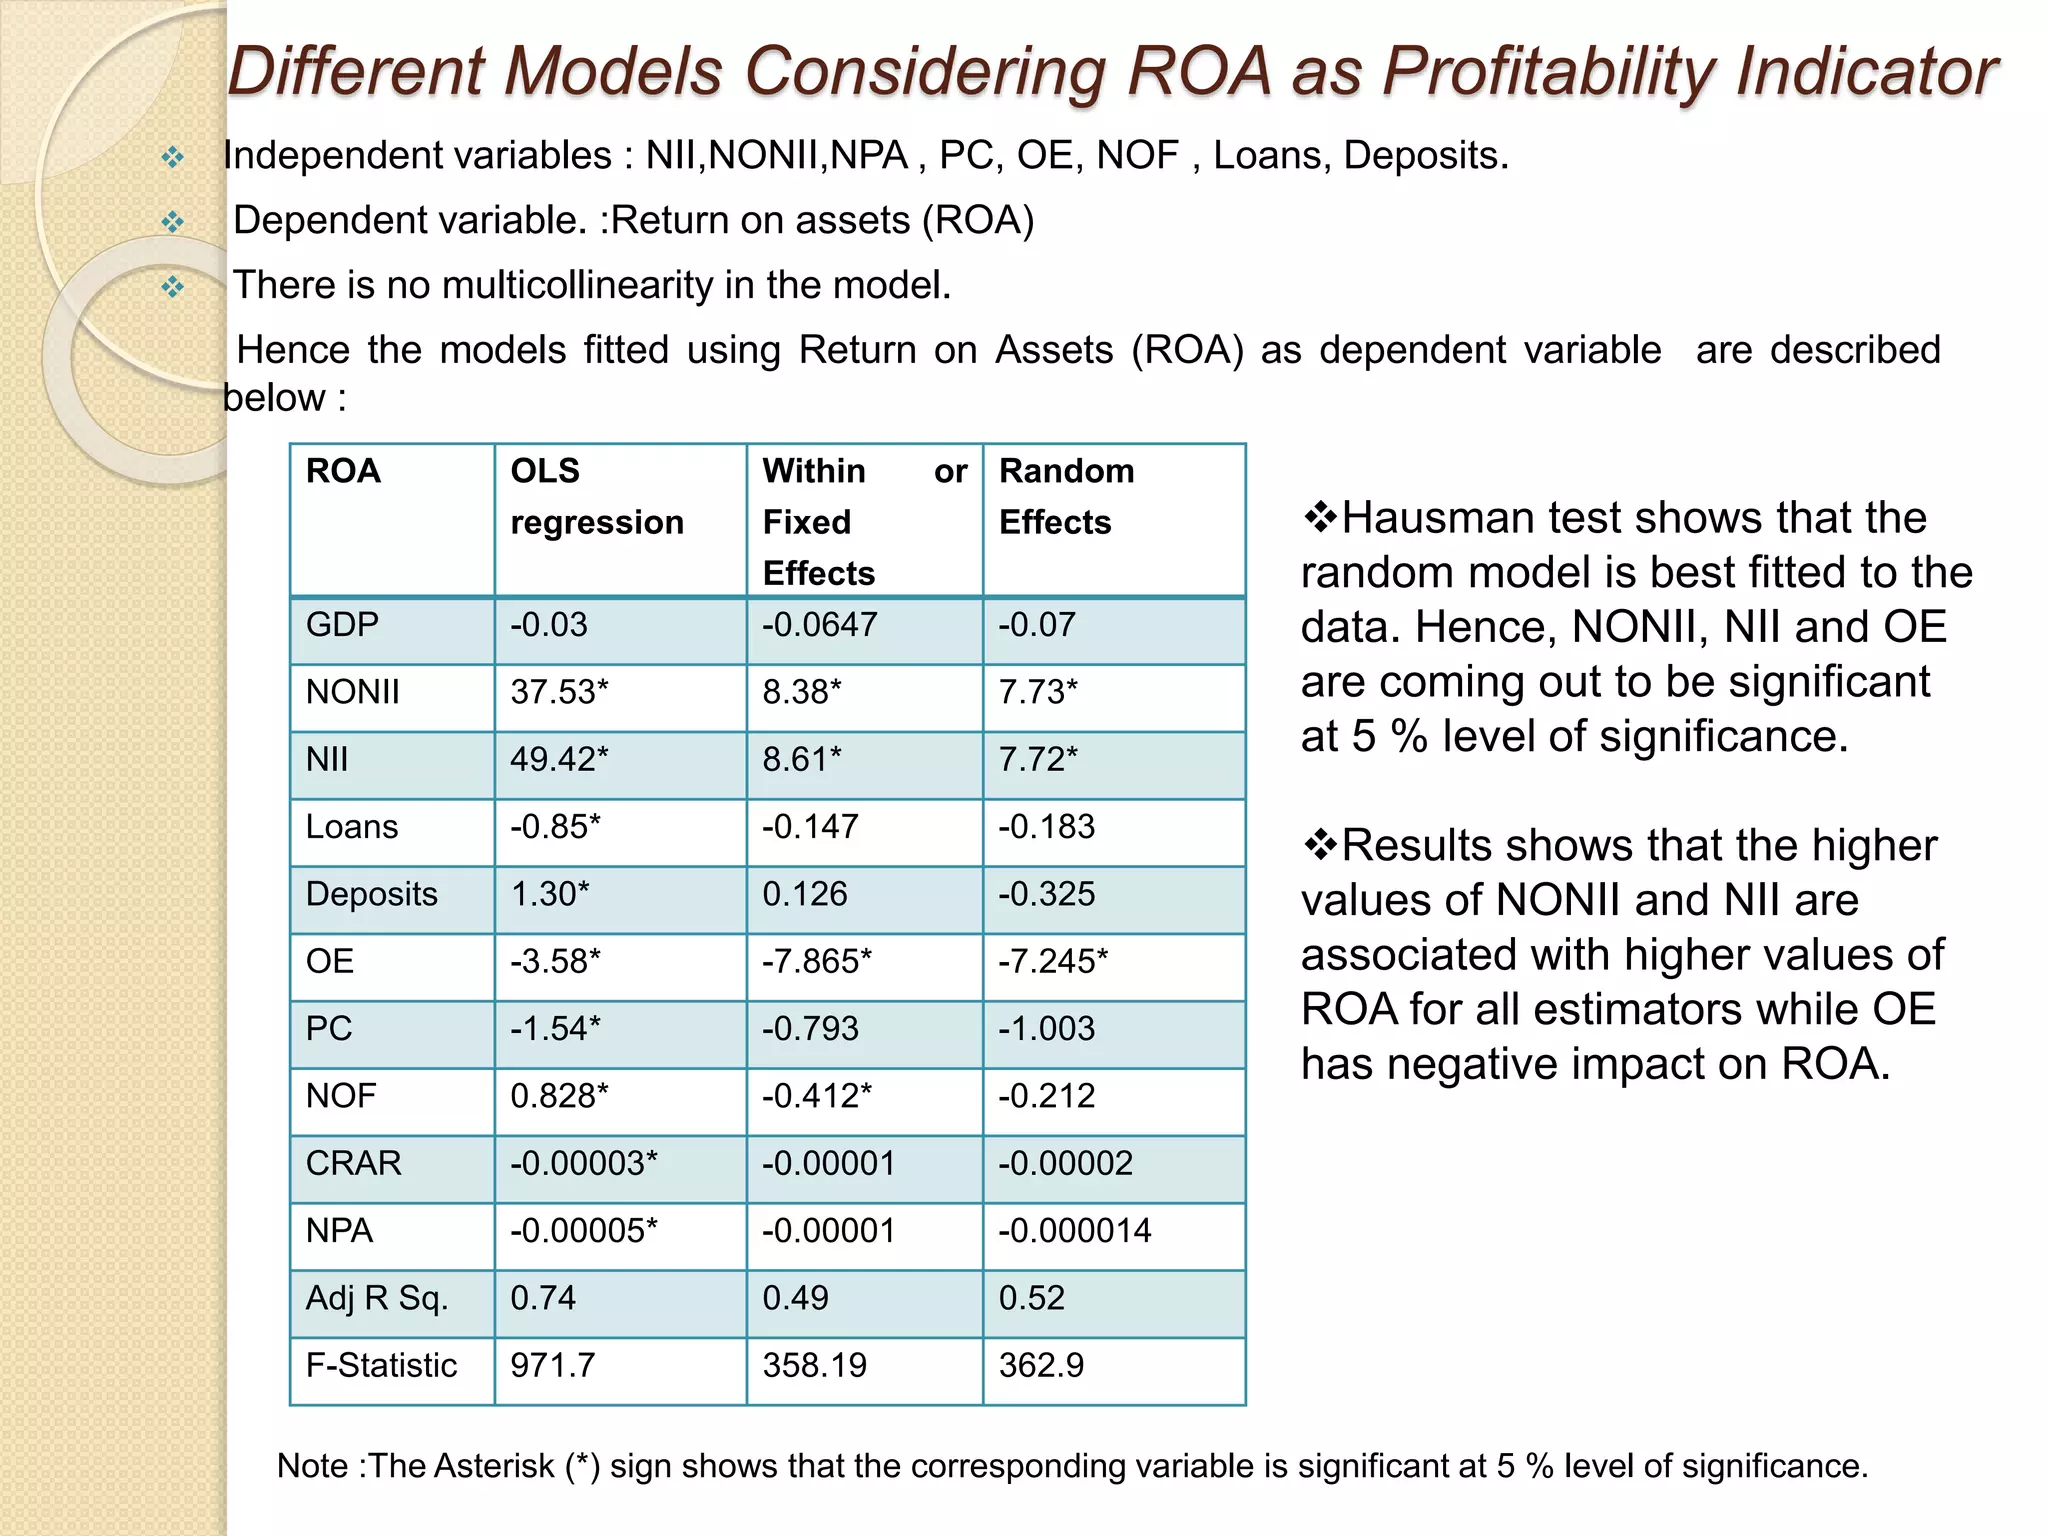
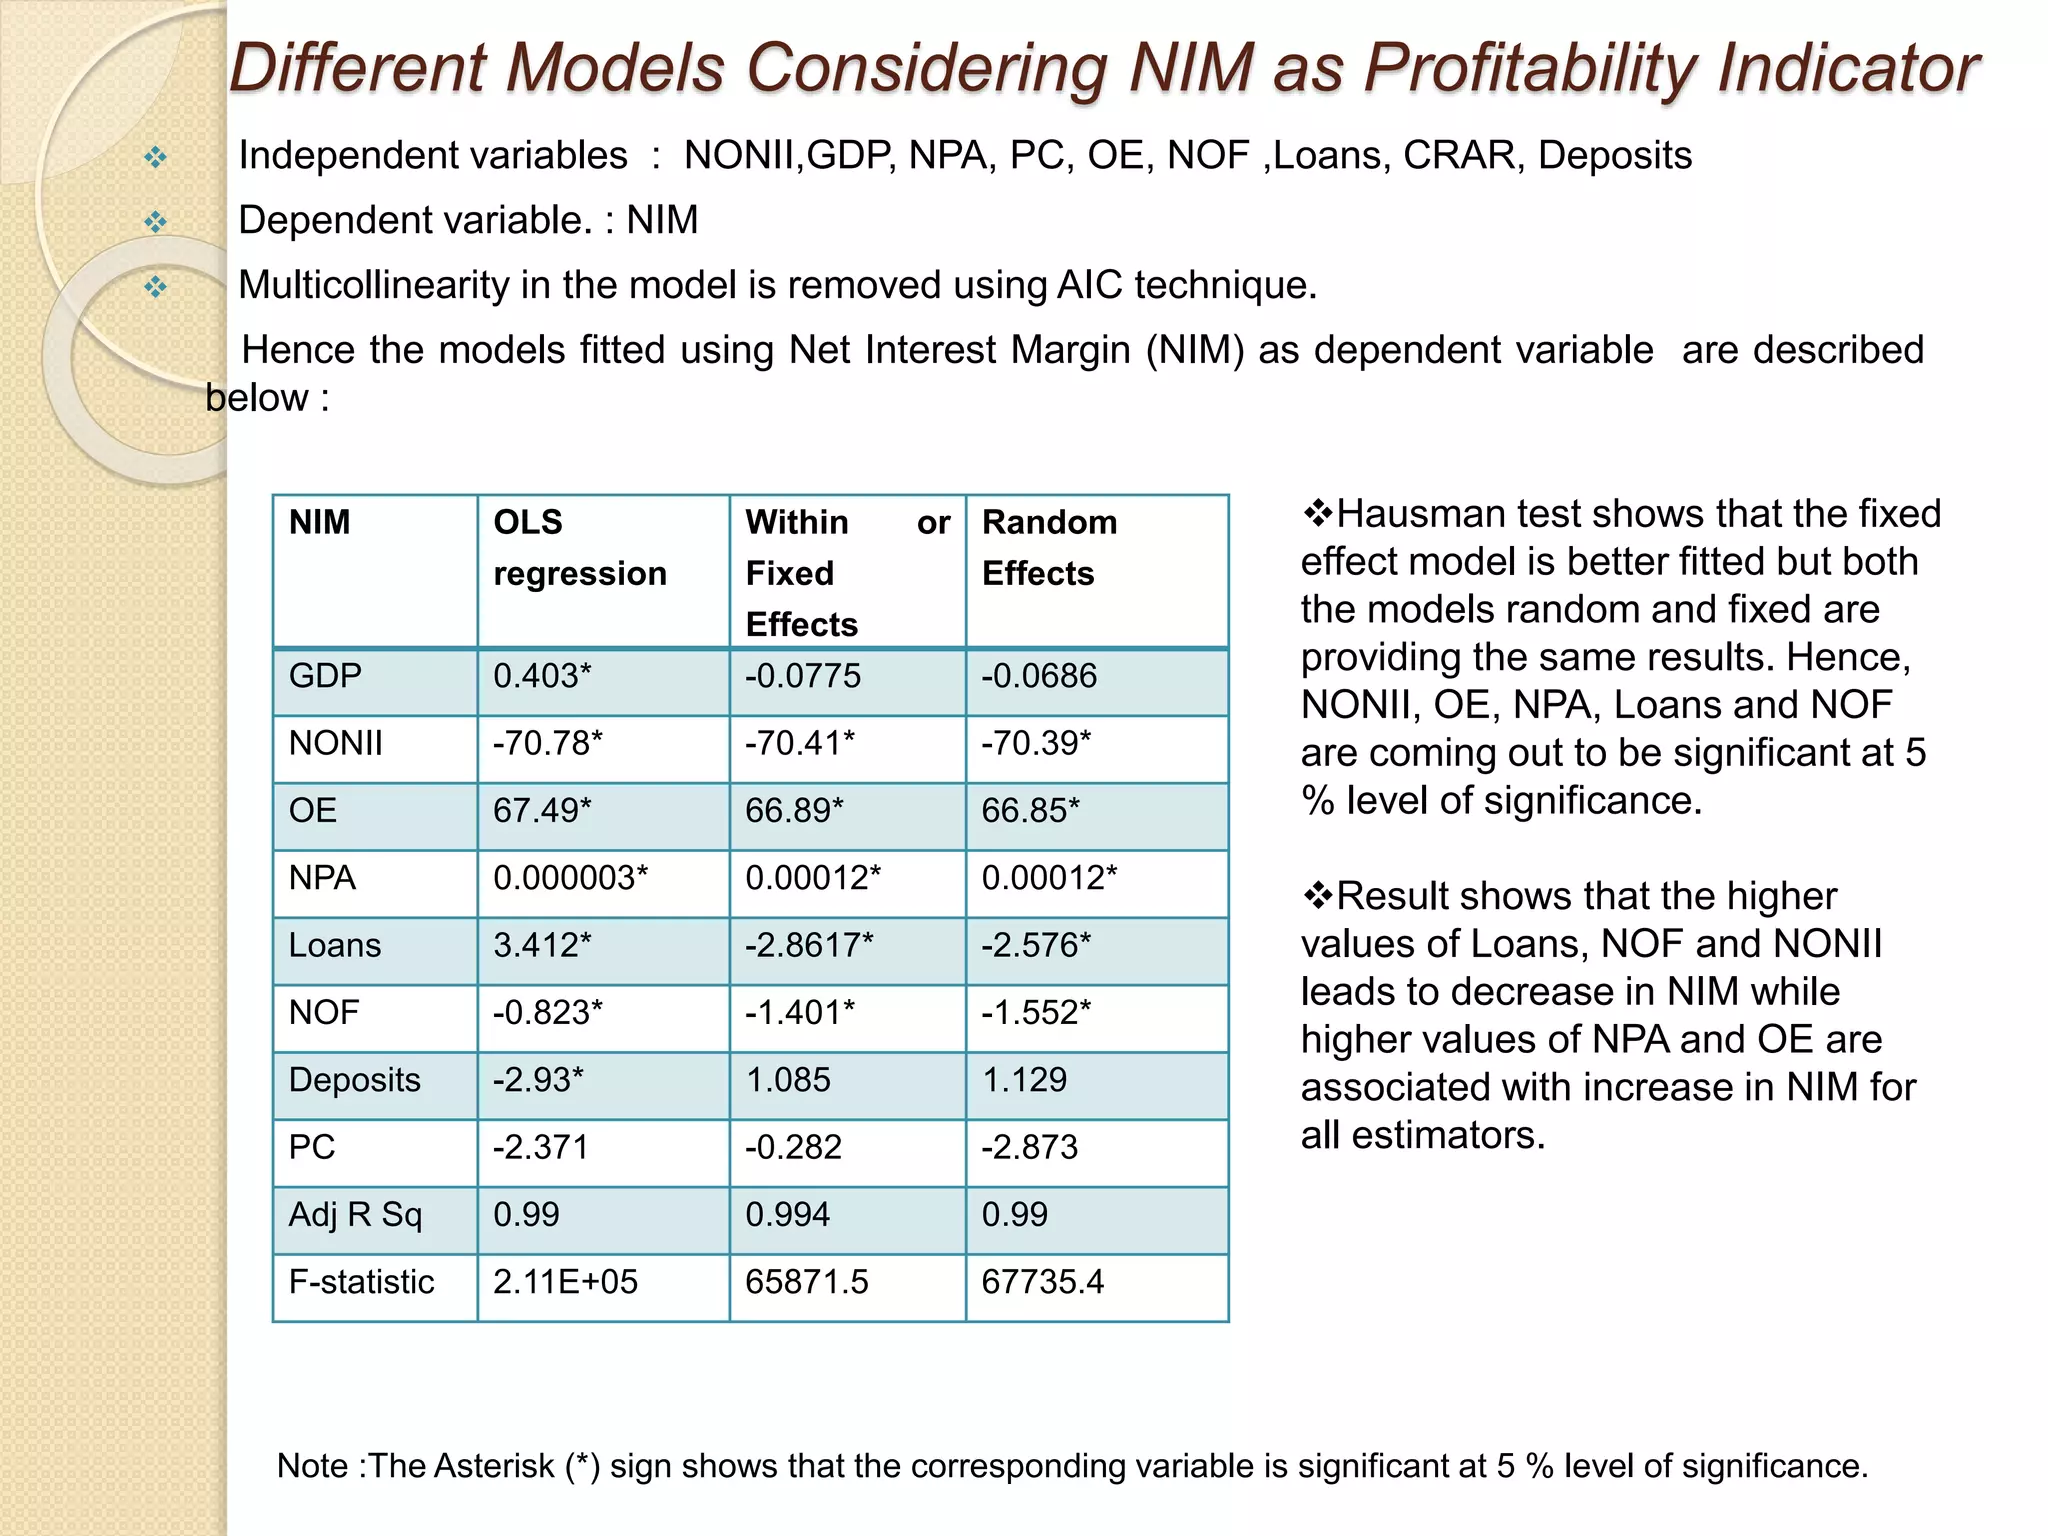
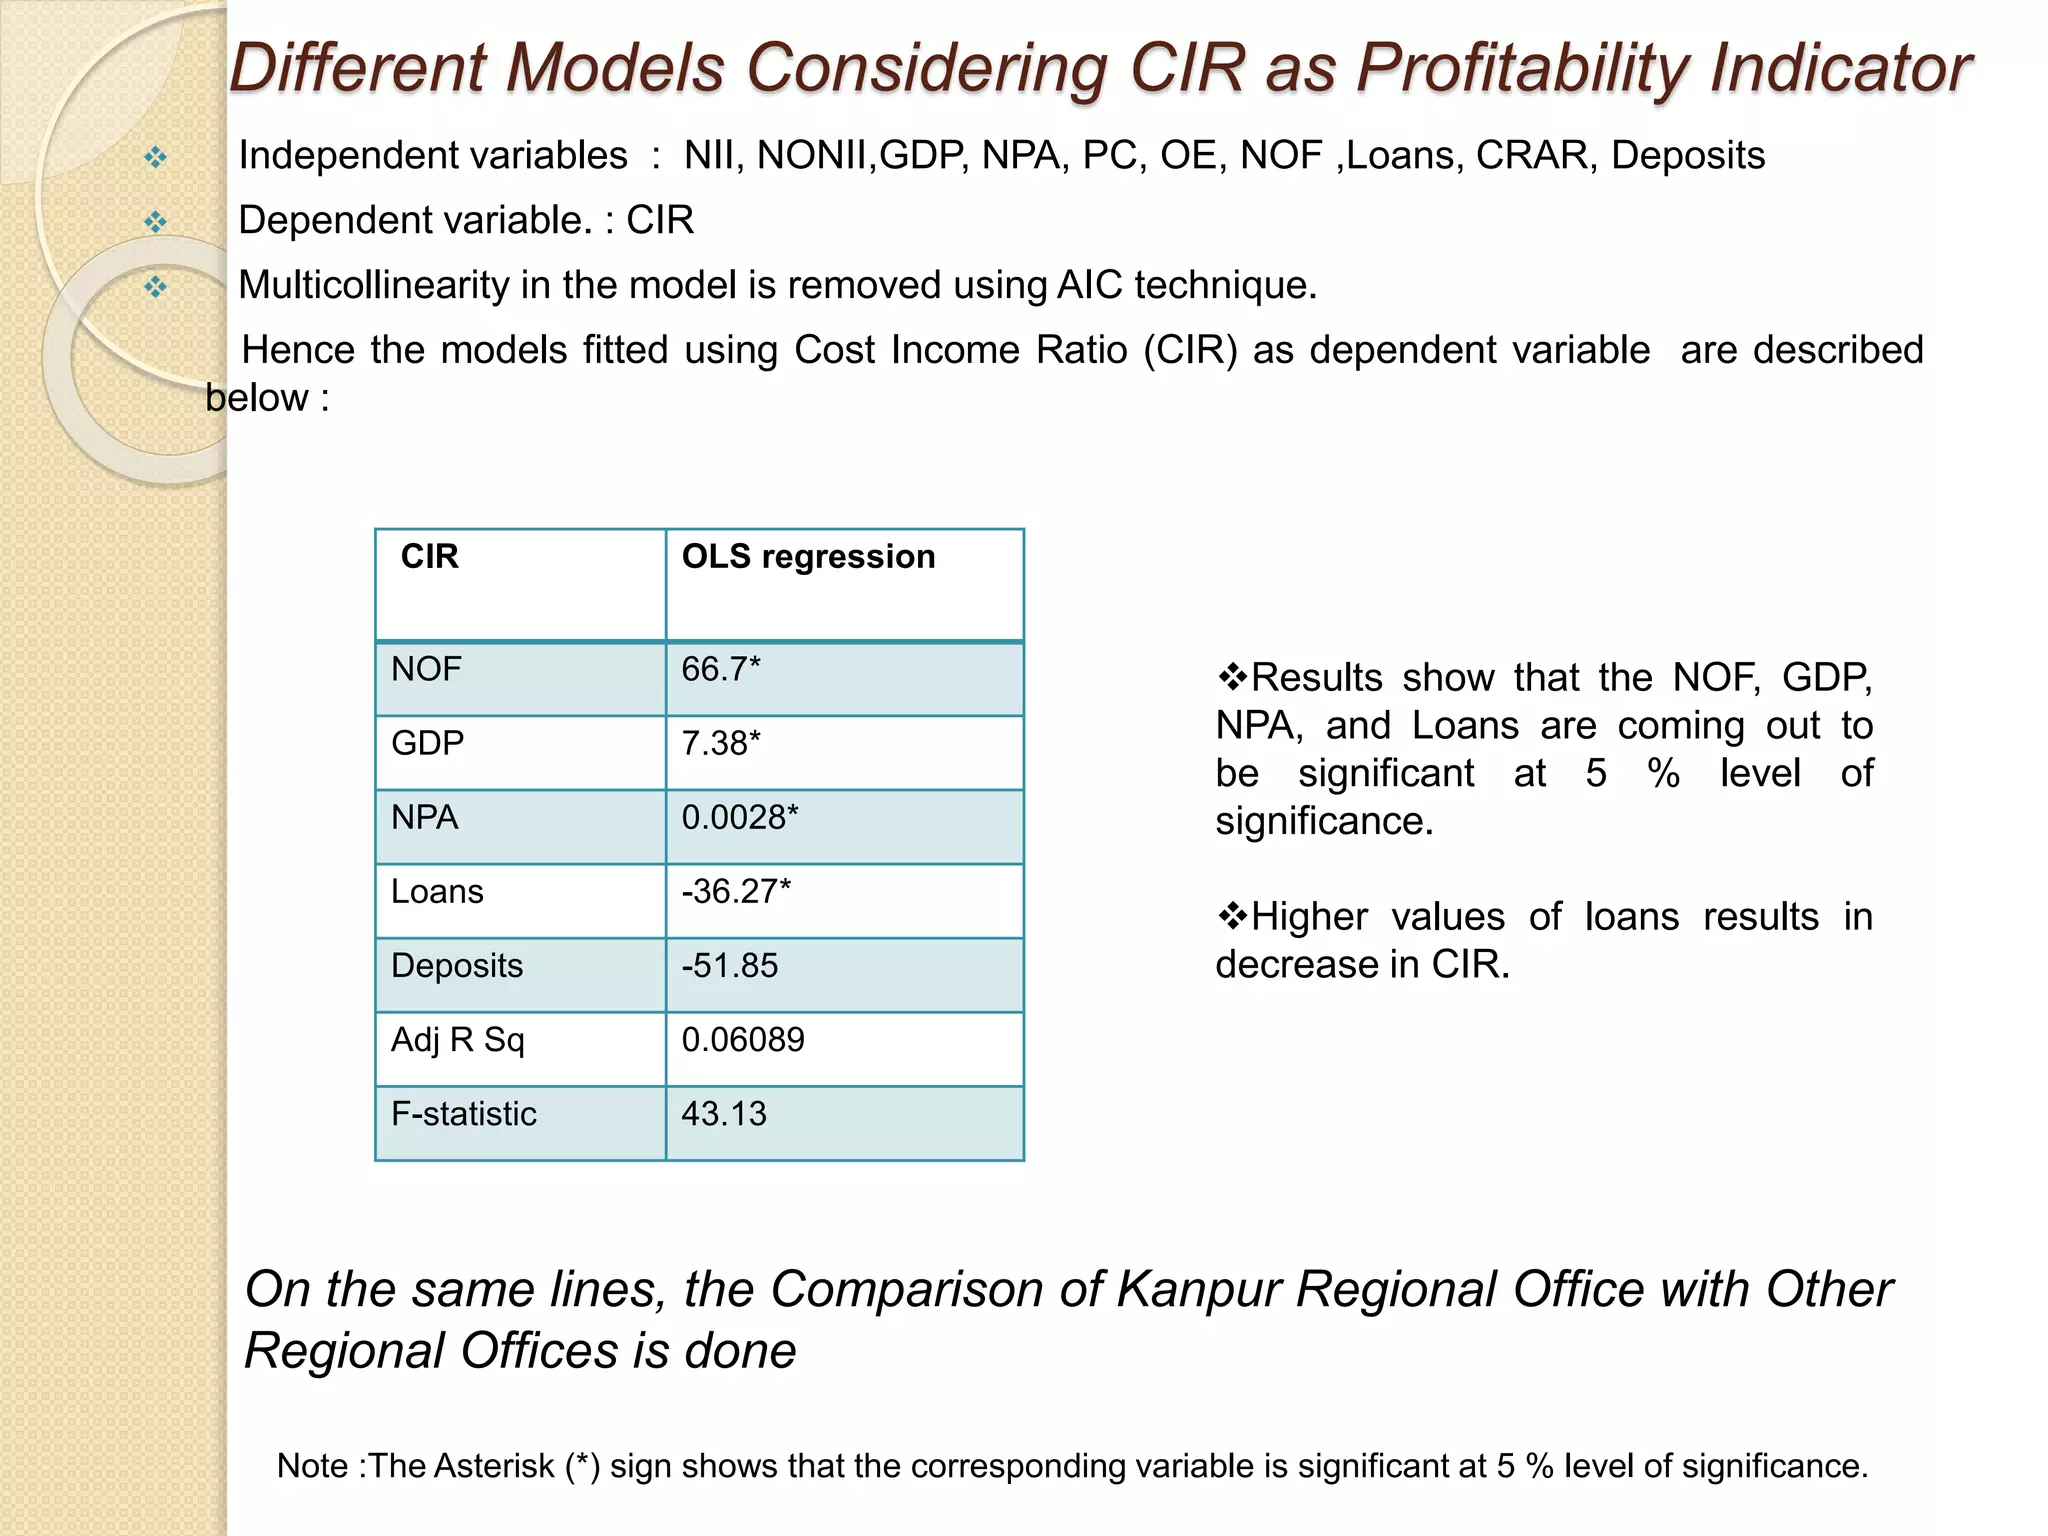
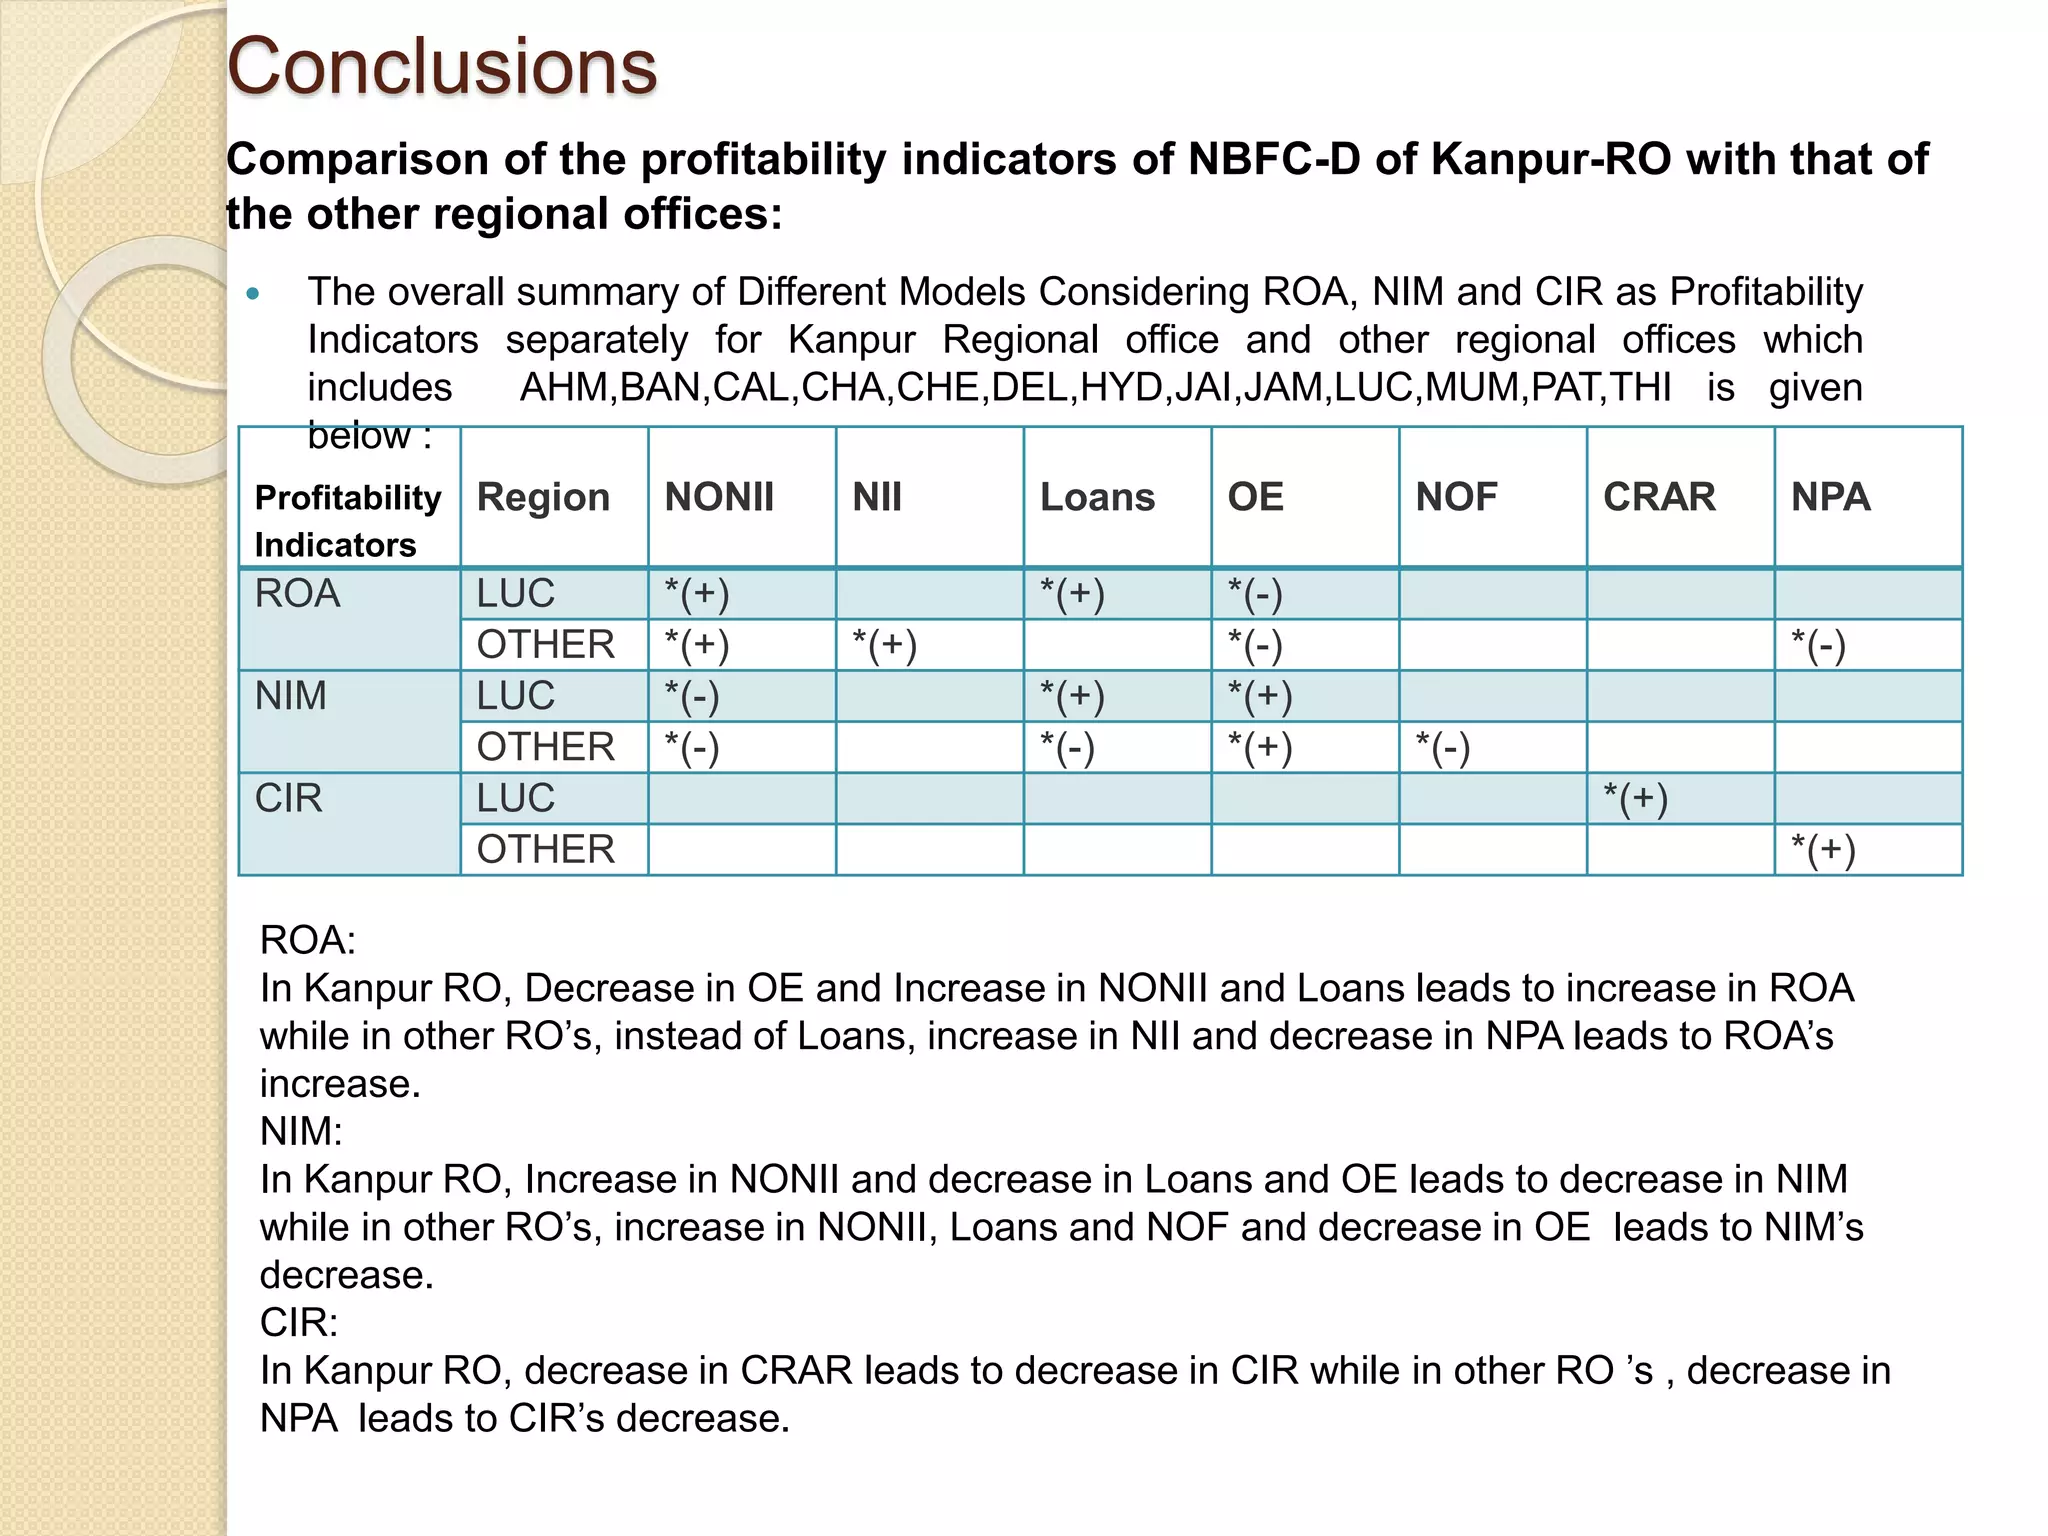
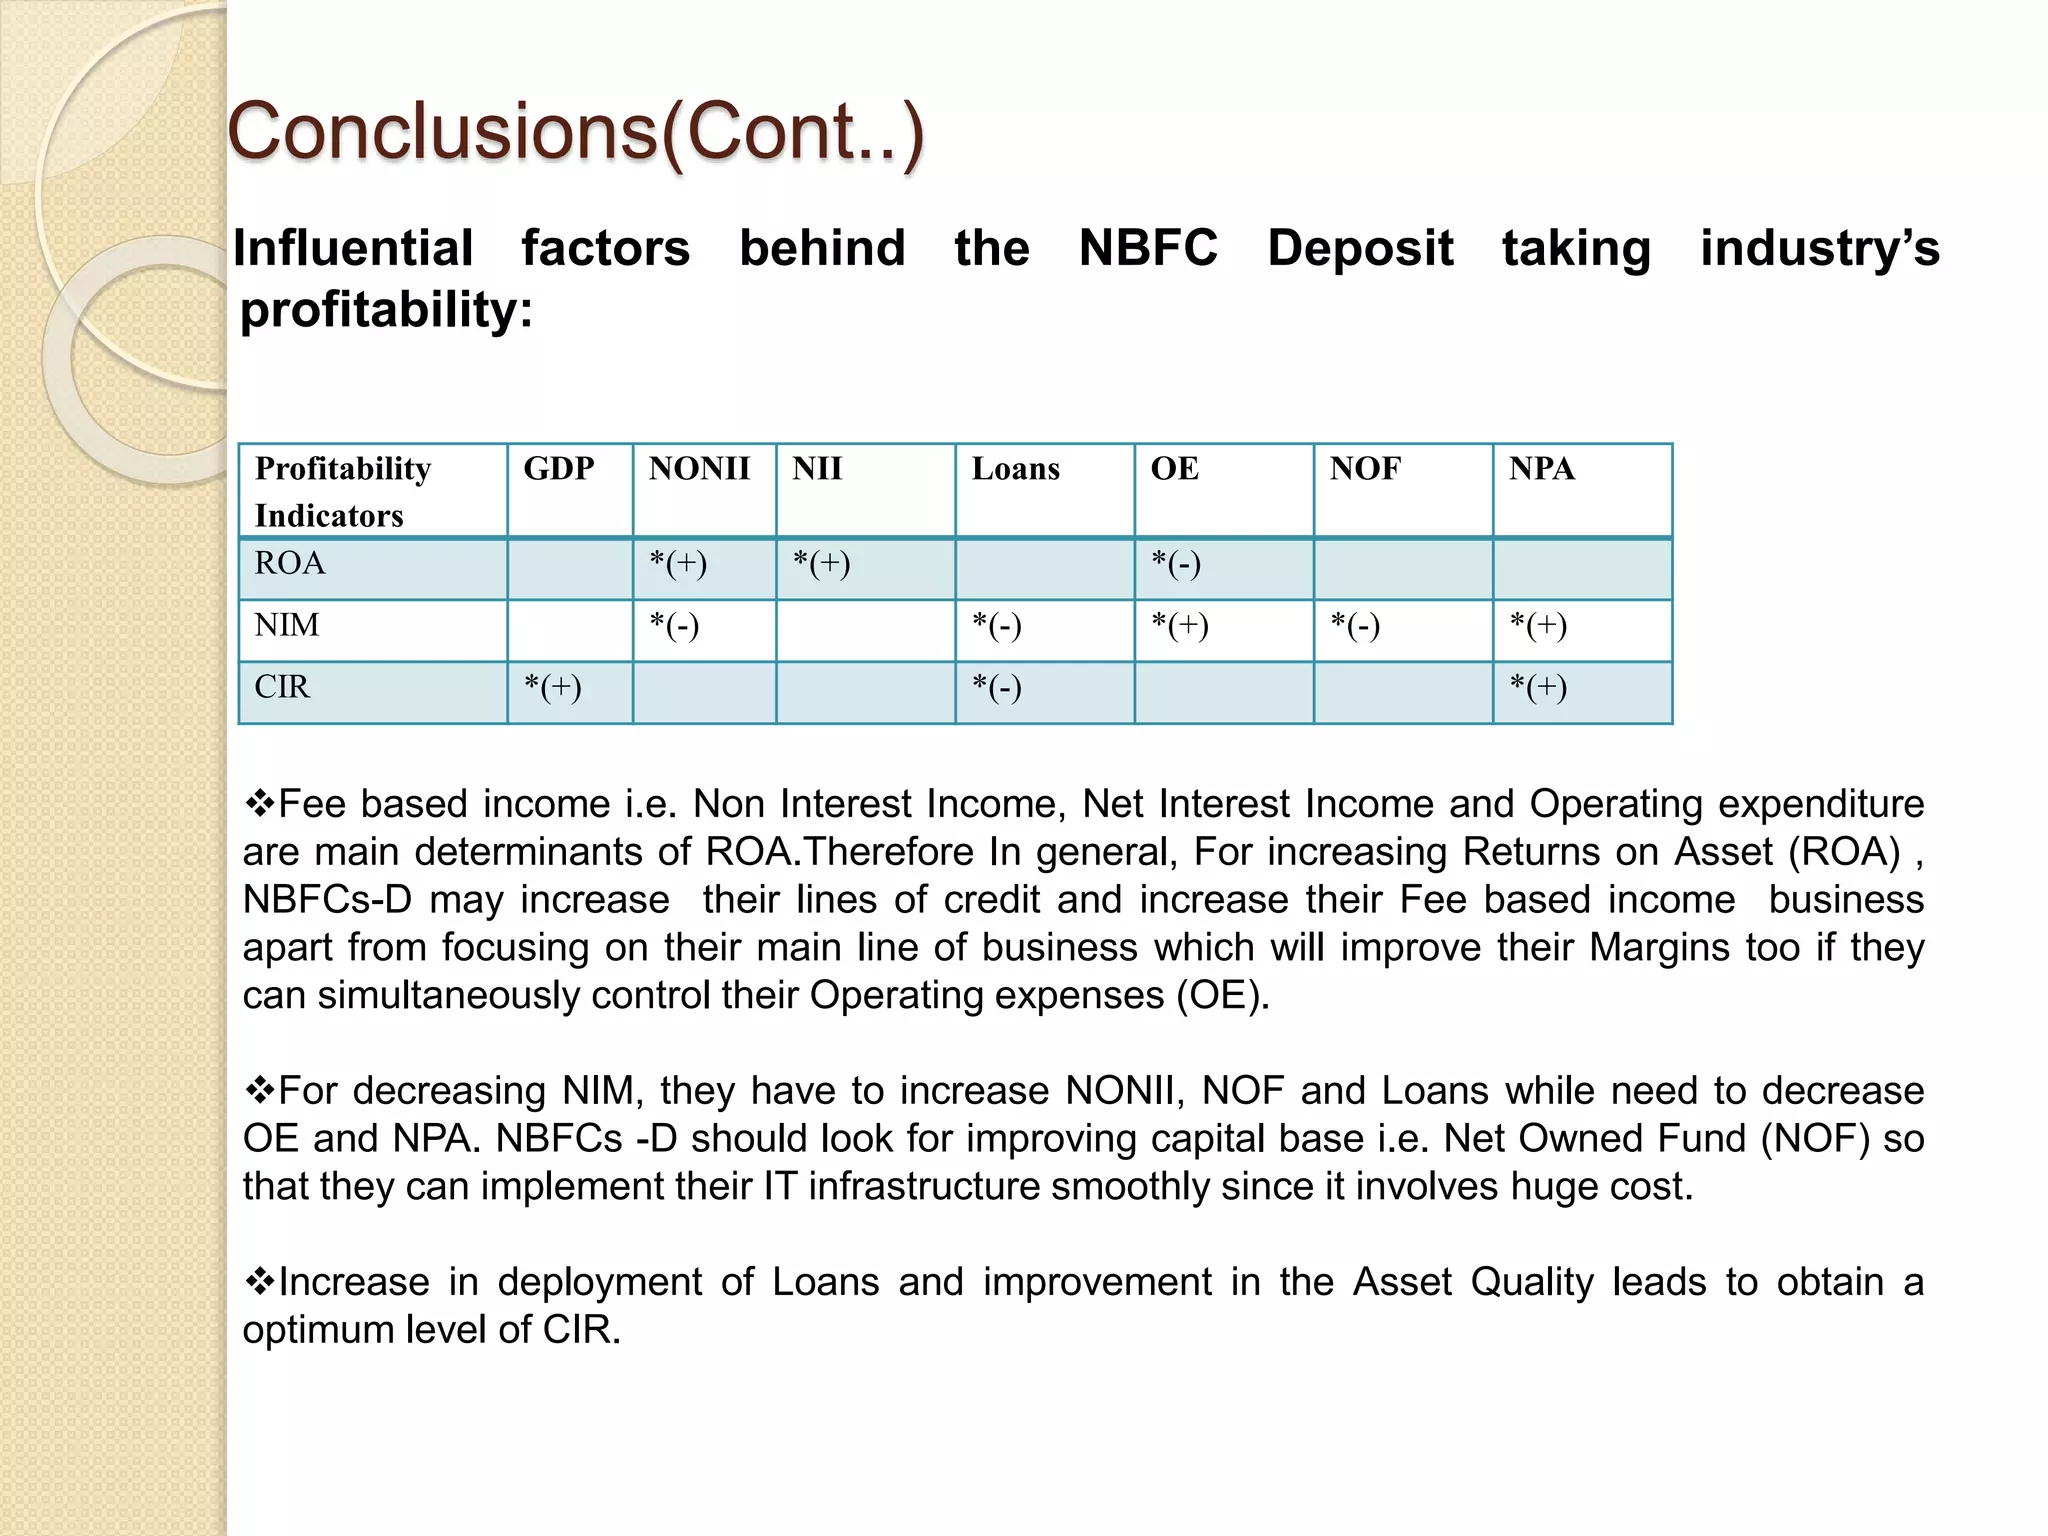
Analysis of the Efficiency of
NBFCs and Determinants of
Profitability of Deposit taking
NBFCs
Presented by
Vasudha Ruhela
Summer Trainee
DNBS, RBI Kanpur
Pursuing
MSc .Statistics (2yr)
IIT Kanpur
Introduction
 This project examines the efficiency of companies in the Non Banking
Financial Institution (NBFIs) industry of India.
 Study of the current performance of NBFCs is shown.
 Analysis of the determinants of profitability of Deposit taking NBFCs
(NBFCs-D) is being done.
 Comparison of the determinants of profitability of Deposit taking NBFCs
(NBFCs-D) of Kanpur-Regional Office with that of Other Regional Offices is
done.
 Different Statistical techniques such as panel data regressions have been
used to determine the relationships between variables.
Financial Institutions
 Act as a conduit for the transfer of resources from net savers to net
borrowers.
 Helped in reducing regional disparities by inducing widespread industrial
development.
 The Financial Institutions in India mainly comprises the commercial
banks, the credit rating agencies, the securities and exchange board of
India, insurance companies and the specialized financial institutions in
India.
Source: Trend and Progress of
Banking in India 2013-14
Chart1: Share of different sectors in total assets of the
Indian financial system
Shadow Banking
Shadow banking activities includes Credit intermediation, Liquidity
transformation and Maturity transformation.
 Why are they called shadow banks?
Because there was so little transparency, it often was unclear who owed (or
would owe later) what to whom.
 Do we have shadow banks in India?
The answer is yes. It is yes, because we have Financial institutions which
accept deposits and extend credit like banks, but we do not call them shadow
banks; we call them the Non-Banking Finance Companies (NBFCs).
 Are they in fact shadow banks?
No, because these institutions have been under the regulatory Structure of
the Reserve Bank of India, right from 1963 i.e. 50 full years before the
developed west is doing so.
Non-Banking Financial Companies (NBFCs)
 A Non-Banking Financial Company (NBFC) is a company registered under the
Companies Act, 1956 engaged in the business of loans and advances,
acquisition of shares/stocks/bonds/debentures/securities issued by
Government or local authority or other marketable securities of a like nature,
leasing, hire-purchase, insurance business, chit business but does not include
any institution whose principal business is that of agriculture activity, industrial
activity, purchase or sale of any goods (other than securities) or providing any
services.
 NBFCs have been made mandatory to get registered with the Reserve Bank
under Section 45 IA of the RBI Act, 1934 since January 1997.
 Heterogeneous group of institutions (other than commercial and co-operative
banks) performing financial intermediation in a variety of ways, like accepting
deposits, making loans and advances, leasing, hire purchase, etc.
 Raise funds from the public, directly or indirectly, and lend them to ultimate
spenders.
 Broadened and diversified the range of products and services offered by a
financial sector.
 Gradually, being recognized as complementary to the banking sector due to
their customer-oriented services
Source: www.rbi.org.in
W P S (DEPR): 21 / 2011 RBI working paper series
Inter-connectedness of Banks and NBFCs in India:
Issues and Policy Implications
Chart 2: Types of NBFCs
Systematically
important
Growth of NBFCs
 Over the years NBFCs have grown sizably both in terms of their numbers as well
as the volume of business transactions (RBI, 2009). The number of such financial
companies grew more than seven-fold from 7,063 in 1981 to 51,929 in 1996 owing
to the high degree of their orientation towards customers and simplification of loan
sanction requirements
 The number of NBFCs-D during 2012-13 declined mainly due to the cancellation of
Certificates of Registration (COR) and migration to non-deposit-taking category
Chart 3: Number of NBFCs registered with RBI
Source : Report on Trend
and Progress of Banking
in India 2012-13 and
Assets of NBFC and Banking (SCBs) Sectors
as a % to GDP
 In developed countries, the share of NBFCs’ assets in GDP ratio is >50%.
 In fact, if the assets of all the NBFCs below Rs.100 crore are reckoned, the share
of NBFCs’ assets to GDP would go further.
Sources: i) Reports on Trend and Progress of Banking in India, 2006-2013
ii) Hand Book of Statistics on Indian Economy, 2012-2013
iii) 2nd National Summit: Non-Banking Finance Companies- “The way forward”, The
Associated Chambers of Commerce and Industry of India,23rd January, 2015 – New Delhi
Note: Assets of NBFC sector include assets of all deposit taking NBFCs and Non -Deposit
Taking NBFCs having assets size Rs. 100 crore and above (NBFCs-ND)
Table 1 : Assets of NBFC and Banking (SCBs) Sectors as a % to GDP
Performance of Non Banking Financial
Institutions
Cross Country Analysis*
 Globally, the size of non-bank financial intermediation was equivalent to 117
percent of GDP as at the end of 2012 for 20 jurisdictions and the euro area.
 US has the largest system of non-bank financial intermediation with assets of
$ 26 trillion, followed by the euro area ($ 22 trillion), the UK ($ 9 trillion) and
Japan ($ 4 trillion).
 On an average, the size of non-bank financial intermediation in terms of
assets was equivalent to 52 per cent of the banking system. However, there
were significant cross-country differences, ranging from 10 per cent to 174
per cent.
 Non-bank financial intermediation is relatively small in the case of emerging
market economies compared to the level of GDP.
 In India, Turkey, Indonesia, Argentina, Saudi Arabia the amount of non-bank
financial activity remained less than 20 per cent of the GDP as at end 2012.
* As per the latest available report on Cross-Country analysis of NBFCs:“Non-Banking
Finance Companies: Game Changers”, Speech delivered by Shri P Vijaya Bhaskar,
Executive Director, Reserve Bank of India
Performance of Non Bank Financial Institutions(Cont..)
 Non-Deposit taking Systemically Important NBFCs (NBFCs-ND-SI)
 NBFCs-ND-SI are not raising resources by way of public deposits, they are regulated
with fewer rigors compared with NBFCs-D.
 Even this type of reclassification of NBFC-ND-SI came into existence since mid-2006
although, the Reserve Bank has initiated measures effective 2000 to reduce the
scope of ‘regulatory arbitrage’ between banks, NBFCs-D and NBFCs-ND (RBI, 2008)
recognizing their importance, essentially from the systemic stability point of view.
 With the recent happening of global financial crisis, the regulators’ attention world
over has received increased attention towards the systemically important financial
institutions (SIFIs).
Item 2013 2014P
Percentage
Variation
1.Share Capital 674 695 7.40
2. Reserves & Surplus 2,276 2,457 8.00
3.Total Borrowings 8,104 8,902 9.80
4.Current Liabilities & Provisions574 647 12.80
Total Liabilities/Assets11,601 12,701 9.50
1.Loans & Advances 7,600 8,455 11.20
2.Hire Purchase Assets 805 896 11.30
3.Investments 1,945 2,075 6.60
4. Other Assets 1,250 1,276 2.10
Memo Items
1. Capital Market Exposure(CME)885 1,029 16.40
2.CME to Total Assets(percent)7.6 8.1
3.Leverage Ratio 3.0 3.0
(in billion Rs.)
Items 2013 2014P
1.Total Income 1,272 1,436
2.Total Expenditure 1,039 1,147
3.Net Profit 233 290
4.Total Assets 11,601 12,701
Financial Ratios(percent)
(i) Net Profit to Total Income18.3 20.2
(ii) Net Profit to Total Assets2 2.3
(in billion Rs.)
Financial performance of NBFCs-ND-SI sector(As of March)
Source: Financial Stability Report
(Including Trend and Progress of Banking in
India 2013-14)
0
2
4
Jun…
Sep…
De…
Ma…
Jun…
Sep…
De…
Ma…
Jun…
Sep…
Percent
Gross NPA to Total Advances Net NPA to Total Advances
0
0.5
1
1.5
2
2.5
Percent
Source: Trend and Progress of Banking in India 2013
Asset quality
Deteriorating since the quarter ended March 2013
(Chart 4). Reserve Bank issued separate guidelines
for both banks and NBFCs with an objective of
mitigating the stress due to their NPAs.
Chart 5: Trends in Return on Assets of NBFCS-ND
Chart4: Asset Quality of NBFCS-ND-SI
Profitability
ROA of NBFCs-ND-SI increased to 2.5 per cent in
September 2014 after remaining at around 2.3
percent in previous three quarters (Chart 5).
24
25
26
27
28
29
30
Jun-12
Sep-12
Dec-12
Mar-13
Jun-13
Sep-13
Dec-13
Mar-14
Jun-14
Sep-14
Percent
Capital adequacy
As of March 2014, by and large, the capital
adequacy position of the NBFCs-ND-SI
remained comfortable and was well above
prudential norms. Nevertheless, CRAR of the
NBFCs-ND-SI slipped from the peak of 29.0 per
cent as of September 2013 to 27.8 per cent by
the quarter ended September 2014 (Chart 6).
Chart6: CRAR of NBFCS-ND-SI
Performance of Non Bank Financial Institutions(Cont..)
> Deposit taking NBFCs (NBFCs-D)
0
1
2
3
4
5
6
Dec-12
Mar-13
Jun-13
Sep-13
Dec-13
Mar-14
Jun-14
Sep-14
Dec-14
Mar-15
Percent
Net NPA to
Total Advances
Gross NPA to
Total Advances
y = 9E-14x5 - 2E-08x4 + 0.0015x3 - 61.131x2 + 1E+06x -
1E+10
R² = 0.61
y = 9E-14x5 - 2E-08x4 + 0.0015x3 - 61.131x2 + 1E+06x -
1E+10
R² = 0.61
0
0.5
1
1.5
2
2.5
Jun-12
Sep-12
Dec-12
Mar-13
Jun-13
Sep-13
Dec-13
Mar-14
Jun-14
Sep-14
Dec-14
Mar-15
Percent
Return On Assets(ROA)
Chart 7: Trend in Assets Quality of NBFCs-D
Chart 8: Trends in Return on Assets of NBFC-D
Source: COSMOS Section , DNBS
Reserve Bank of India, Kanpur
Asset quality
Decrease in Net NPA to Total Advances and
Gross NPA to Total Advances from 2.64 and
3.67 as on quarter ended December 2012 to
0.48 and 0.30 as on quarter ended March
2015..
Profitability
ROA of NBFCs-D increased to 2.18 per cent in
quarter ended March 2015 from 0.9 percent in
quarter ended June 2012(Chart 8) .There is a
polynomial trend in between this period.
0
0.5
1
1.5
2
Jun-12
Sep-12
Dec-12
Mar-13
Jun-13
Sep-13
Dec-13
Mar-14
Jun-14
Sep-14
Dec-14
Mar-15
Percent
Net Interest Margin(NIM)
Net Interest Margin (NIM)
The Net Interest Margin of NBFCs-D has
considerably increased from 0.12 percent
as on quarter ended June 2012 to 1.66
percent as on quarter ended March
2015(Chart 9).There is a polynomial trend
followed by NIM in between this period.
Chart 10: Trends in Cost Income Ratio of NBFCS-D
0
20
40
60
80
100
120
Jun-12
Sep-12
Dec-12
Mar-13
Jun-13
Sep-13
Dec-13
Mar-14
Jun-14
Sep-14
Dec-14
Mar-15
Percent
Cost Income Ratio
Cost Income Ratio (CIR)
CIR is maintained around 55 percent
between the Quarter ended September 2012
and quarter ended June 2012(Chart 10).The
highest Cost Income Ratio(CIR) in the time
period from quarter ended June 2012 till
quarter ended March 2015 was recorded as
109.18 percent in quarter ended September
2014.
> Deposit taking NBFCs (NBFCs-D) (Cont..)
Chart 9 Trends in Net Interest Margin of NBFCs-D
Source: COSMOS Section , DNBS
Reserve Bank of India, Kanpur
Determinants of Profitability of NBFCs-D
Some of the commonly used accounting measures/ratios for an analysis of efficiency/profitability
are cost- to-income ratio (CI), net interest margin (NIM), and return on assets (ROA).
Chart 11: Trends in Accounting Measures reflecting Efficiency
-20.0000
0.0000
20.0000
40.0000
60.0000
80.0000
100.0000
2011-2012 2012-2013 2013-2014 2014-2015
Percentage
Financial Year
ROA
NIM
CIR
Source: COSMOS Section , DNBS,
Reserve Bank of India, Kanpur
Dependent Variables Definition Source
CIR Cost-to-Income ratio : (operating
costs(including provisions and
contingencies ) /Total Income) * 100
Operations and Performance of
Commercial Banks”, Trend and
Progress of Banking in India(2012-
2013)NIM Net interest margin : (net interest
income / Total assets )*100
ROA Return on Assets: (net profit/Total
assets)*100
Criterion of Selection of Independent Variables
Dependent Variables Definition Source
NII Net Interest Income= Interest
Earned - Interest Paid
Research
Papers:“Determinants of
Profitability of Banks In India”
(B.S.Badola and Richa
Verma) and “Determinants of
Profitability of Non Bank
Financial Institutions’ in a
developing country :Evidence
from Bangladesh” (Md.Sogir
Hossain Khandoker et.al)
NONII Non-Interest Income= Total
Income - Interest Income
Loans Total Loans and Advances
Deposits Total Deposits
NPA Non-performing Assets as
percentage to Net Advances
PC Provision and Contingencies
(P&C)
OE Operating Expenses :
Includes establishment
expenditure, salary
expenditure and –expenditure
on technology up gradation
NOF Net Owned Fund
GDP Gross Domestic Product Own Interest
CRAR Capital Risk Adequacy Ratio
Description of data
Panel data of 254 NBFCs –Deposit taking is collected for this study. In econometrics,
the term panel data refers to multi-dimensional data frequently involving
measurements over time. This data is generated by pooling time-series observations
from 2011 to 2014 across 254 Deposit taking NBFCs.
Country : India Panel Data of NBFCs –D
Collected by: COSMOS Section, DNBS,RBI Kanpur
Years Available:
2011,2012,2013,2014 (of 4 quarters
each)
Data Description:
This data is of different deposit taking
NBFCs present in all the regions
(AHM,BAN,CAL,CHA,CHE,DEL,HYD,J
AI,JAM,LUC,MUM,PAT,THI) in India.
Variables
Net Interest Income(NII), Non-Interest
Income (NONII), NPA as percentage to
Net Advances (NPA), Provision and
Contingencies (P&C), Operating
Expenses (OE), NET owned Fund
(NOF) ,cost-to-income ratio(CIR) ,Net
interest margin (NIM), Return on assets
(ROA),Total Loans and Advances,
Investments ,Deposits, and Borrowings
of the different companies**AHM,BAN,CAL,CHA,CHE,DEL,HYD,JAI,JAM,LUC, MUM,PAT and THI stands for Ahmedabad,
Bangalore, Kolkata, Chandigarh, Chennai, Delhi, Hyderabad, Jaipur, Jammu, Lucknow, Mumbai, Patna
and Thiruvananthpuram.
Used statistical software R and SPSS for analysis .
 Scaling of data
Since some variables like NII, NONII, NPA, PC, OE, NOF, NIM, Total Loans
and Advances, and Deposits are divided by the corresponding total assets
size of the companies so that the proper weight age can be given to each
company.
 Multicollinearity
The variables causing multicollinearity are dropped from the model by using
Akaike Information Criterion in order to identify the variables that have high
explanatory powers and are, therefore, more important in managing the
operations of a NBFCs.
.
Data Analysis & Presentation Technique
Data Analysis
Description of Models
Since analysis is based on panel data. So we are considering three
different models :Ordinary least Squares regression model (OLS),
fixed and random regression models.
Assumptions
Normality of errors is expected to follow according to central limit
theorem.
Heteroscedasticity is assumed.
Cross-sectional dependence is a problem in macro panels with
long time series*. Here we have micro panel data i.e. only four year
data quarter wise.
*Ref : “Getting Started in Fixed/Random Effects Models using R (ver.
0.1-Draft)”, available at http://dss.princeton.edu/training/, retrieved on
June 30th ,2015
Different Models Considering ROA as Profitability Indicator
 Independent variables : NII,NONII,NPA , PC, OE, NOF , Loans, Deposits.
 Dependent variable. :Return on assets (ROA)
 There is no multicollinearity in the model.
Hence the models fitted using Return on Assets (ROA) as dependent variable are described
below :
ROA OLS
regression
Within or
Fixed
Effects
Random
Effects
GDP -0.03 -0.0647 -0.07
NONII 37.53* 8.38* 7.73*
NII 49.42* 8.61* 7.72*
Loans -0.85* -0.147 -0.183
Deposits 1.30* 0.126 -0.325
OE -3.58* -7.865* -7.245*
PC -1.54* -0.793 -1.003
NOF 0.828* -0.412* -0.212
CRAR -0.00003* -0.00001 -0.00002
NPA -0.00005* -0.00001 -0.000014
Adj R Sq. 0.74 0.49 0.52
F-Statistic 971.7 358.19 362.9
Note :The Asterisk (*) sign shows that the corresponding variable is significant at 5 % level of significance.
Hausman test shows that the
random model is best fitted to the
data. Hence, NONII, NII and OE
are coming out to be significant
at 5 % level of significance.
Results shows that the higher
values of NONII and NII are
associated with higher values of
ROA for all estimators while OE
has negative impact on ROA.
Different Models Considering NIM as Profitability Indicator
 Independent variables : NONII,GDP, NPA, PC, OE, NOF ,Loans, CRAR, Deposits
 Dependent variable. : NIM
 Multicollinearity in the model is removed using AIC technique.
Hence the models fitted using Net Interest Margin (NIM) as dependent variable are described
below :
NIM OLS
regression
Within or
Fixed
Effects
Random
Effects
GDP 0.403* -0.0775 -0.0686
NONII -70.78* -70.41* -70.39*
OE 67.49* 66.89* 66.85*
NPA 0.000003* 0.00012* 0.00012*
Loans 3.412* -2.8617* -2.576*
NOF -0.823* -1.401* -1.552*
Deposits -2.93* 1.085 1.129
PC -2.371 -0.282 -2.873
Adj R Sq 0.99 0.994 0.99
F-statistic 2.11E+05 65871.5 67735.4
Note :The Asterisk (*) sign shows that the corresponding variable is significant at 5 % level of significance.
Hausman test shows that the fixed
effect model is better fitted but both
the models random and fixed are
providing the same results. Hence,
NONII, OE, NPA, Loans and NOF
are coming out to be significant at 5
% level of significance.
Result shows that the higher
values of Loans, NOF and NONII
leads to decrease in NIM while
higher values of NPA and OE are
associated with increase in NIM for
all estimators.
Different Models Considering CIR as Profitability Indicator
 Independent variables : NII, NONII,GDP, NPA, PC, OE, NOF ,Loans, CRAR, Deposits
 Dependent variable. : CIR
 Multicollinearity in the model is removed using AIC technique.
Hence the models fitted using Cost Income Ratio (CIR) as dependent variable are described
below :
CIR OLS regression
NOF 66.7*
GDP 7.38*
NPA 0.0028*
Loans -36.27*
Deposits -51.85
Adj R Sq 0.06089
F-statistic 43.13
Note :The Asterisk (*) sign shows that the corresponding variable is significant at 5 % level of significance.
Results show that the NOF, GDP,
NPA, and Loans are coming out to
be significant at 5 % level of
significance.
Higher values of loans results in
decrease in CIR.
On the same lines, the Comparison of Kanpur Regional Office with Other
Regional Offices is done
Conclusions
 The overall summary of Different Models Considering ROA, NIM and CIR as Profitability
Indicators separately for Kanpur Regional office and other regional offices which
includes AHM,BAN,CAL,CHA,CHE,DEL,HYD,JAI,JAM,LUC,MUM,PAT,THI is given
below :
Comparison of the profitability indicators of NBFC-D of Kanpur-RO with that of
the other regional offices:
Profitability
Indicators
Region NONII NII Loans OE NOF CRAR NPA
ROA LUC *(+) *(+) *(-)
OTHER *(+) *(+) *(-) *(-)
NIM LUC *(-) *(+) *(+)
OTHER *(-) *(-) *(+) *(-)
CIR LUC *(+)
OTHER *(+)
ROA:
In Kanpur RO, Decrease in OE and Increase in NONII and Loans leads to increase in ROA
while in other RO’s, instead of Loans, increase in NII and decrease in NPA leads to ROA’s
increase.
NIM:
In Kanpur RO, Increase in NONII and decrease in Loans and OE leads to decrease in NIM
while in other RO’s, increase in NONII, Loans and NOF and decrease in OE leads to NIM’s
decrease.
CIR:
In Kanpur RO, decrease in CRAR leads to decrease in CIR while in other RO ’s , decrease in
NPA leads to CIR’s decrease.
Conclusions(Cont..)
Influential factors behind the NBFC Deposit taking industry’s
profitability:
Profitability
Indicators
GDP NONII NII Loans OE NOF NPA
ROA *(+) *(+) *(-)
NIM *(-) *(-) *(+) *(-) *(+)
CIR *(+) *(-) *(+)
Fee based income i.e. Non Interest Income, Net Interest Income and Operating expenditure
are main determinants of ROA.Therefore In general, For increasing Returns on Asset (ROA) ,
NBFCs-D may increase their lines of credit and increase their Fee based income business
apart from focusing on their main line of business which will improve their Margins too if they
can simultaneously control their Operating expenses (OE).
For decreasing NIM, they have to increase NONII, NOF and Loans while need to decrease
OE and NPA. NBFCs -D should look for improving capital base i.e. Net Owned Fund (NOF) so
that they can implement their IT infrastructure smoothly since it involves huge cost.
Increase in deployment of Loans and improvement in the Asset Quality leads to obtain a
optimum level of CIR.
Recommendations:
 NBFCs should increase their NOF :NBFCs may face decline in their
profitability indicators in the short run but in the longer run it will benefit them.
Since introduction of new small and payment banks will increase competition
in this sector catering the same customer base and will pose a tough
challenge to these NBFCs.
 Improvement in CRAR will lead to increase in the loss absorbing capacity of
the company; increase in capital will help them in improving the market
perception of their financial soundness. This may lead to ease in raising their
resources and funds to shore up their NOF. With higher NOF and income,
companies will be in better position to implement IT infrastructure which
initially requires high cost but after reaching break even it can reduce their
operation costs and thus leading to improvement in Cost to income ratios
too.
 Since this data is of much use subject to its reliability and availability and this
study leaves room for further study in different areas of NBFI functions such
as products of productivity analysis, Data Envelopment Analysis (DEA).
Limitations
Although this study was carefully prepared, I am still aware of its
limitations and shortcomings.
 Time Period: In this study, it would have been better if a larger time
period was covered. It'd have given a better picture of the NBFCs
sector in India.
 The project is done on few variables affecting the profitability. There
are bound to be other variables which may considerably affect the
profitability of banks.
Thank You

Analysis of the Efficiency of NBFCs

  • 1.
    Analysis of theEfficiency of NBFCs and Determinants of Profitability of Deposit taking NBFCs Presented by Vasudha Ruhela Summer Trainee DNBS, RBI Kanpur Pursuing MSc .Statistics (2yr) IIT Kanpur
  • 2.
    Introduction  This projectexamines the efficiency of companies in the Non Banking Financial Institution (NBFIs) industry of India.  Study of the current performance of NBFCs is shown.  Analysis of the determinants of profitability of Deposit taking NBFCs (NBFCs-D) is being done.  Comparison of the determinants of profitability of Deposit taking NBFCs (NBFCs-D) of Kanpur-Regional Office with that of Other Regional Offices is done.  Different Statistical techniques such as panel data regressions have been used to determine the relationships between variables.
  • 3.
    Financial Institutions  Actas a conduit for the transfer of resources from net savers to net borrowers.  Helped in reducing regional disparities by inducing widespread industrial development.  The Financial Institutions in India mainly comprises the commercial banks, the credit rating agencies, the securities and exchange board of India, insurance companies and the specialized financial institutions in India. Source: Trend and Progress of Banking in India 2013-14 Chart1: Share of different sectors in total assets of the Indian financial system
  • 4.
    Shadow Banking Shadow bankingactivities includes Credit intermediation, Liquidity transformation and Maturity transformation.  Why are they called shadow banks? Because there was so little transparency, it often was unclear who owed (or would owe later) what to whom.  Do we have shadow banks in India? The answer is yes. It is yes, because we have Financial institutions which accept deposits and extend credit like banks, but we do not call them shadow banks; we call them the Non-Banking Finance Companies (NBFCs).  Are they in fact shadow banks? No, because these institutions have been under the regulatory Structure of the Reserve Bank of India, right from 1963 i.e. 50 full years before the developed west is doing so.
  • 5.
    Non-Banking Financial Companies(NBFCs)  A Non-Banking Financial Company (NBFC) is a company registered under the Companies Act, 1956 engaged in the business of loans and advances, acquisition of shares/stocks/bonds/debentures/securities issued by Government or local authority or other marketable securities of a like nature, leasing, hire-purchase, insurance business, chit business but does not include any institution whose principal business is that of agriculture activity, industrial activity, purchase or sale of any goods (other than securities) or providing any services.  NBFCs have been made mandatory to get registered with the Reserve Bank under Section 45 IA of the RBI Act, 1934 since January 1997.  Heterogeneous group of institutions (other than commercial and co-operative banks) performing financial intermediation in a variety of ways, like accepting deposits, making loans and advances, leasing, hire purchase, etc.  Raise funds from the public, directly or indirectly, and lend them to ultimate spenders.  Broadened and diversified the range of products and services offered by a financial sector.  Gradually, being recognized as complementary to the banking sector due to their customer-oriented services
  • 6.
    Source: www.rbi.org.in W PS (DEPR): 21 / 2011 RBI working paper series Inter-connectedness of Banks and NBFCs in India: Issues and Policy Implications Chart 2: Types of NBFCs Systematically important
  • 7.
    Growth of NBFCs Over the years NBFCs have grown sizably both in terms of their numbers as well as the volume of business transactions (RBI, 2009). The number of such financial companies grew more than seven-fold from 7,063 in 1981 to 51,929 in 1996 owing to the high degree of their orientation towards customers and simplification of loan sanction requirements  The number of NBFCs-D during 2012-13 declined mainly due to the cancellation of Certificates of Registration (COR) and migration to non-deposit-taking category Chart 3: Number of NBFCs registered with RBI Source : Report on Trend and Progress of Banking in India 2012-13 and
  • 8.
    Assets of NBFCand Banking (SCBs) Sectors as a % to GDP  In developed countries, the share of NBFCs’ assets in GDP ratio is >50%.  In fact, if the assets of all the NBFCs below Rs.100 crore are reckoned, the share of NBFCs’ assets to GDP would go further. Sources: i) Reports on Trend and Progress of Banking in India, 2006-2013 ii) Hand Book of Statistics on Indian Economy, 2012-2013 iii) 2nd National Summit: Non-Banking Finance Companies- “The way forward”, The Associated Chambers of Commerce and Industry of India,23rd January, 2015 – New Delhi Note: Assets of NBFC sector include assets of all deposit taking NBFCs and Non -Deposit Taking NBFCs having assets size Rs. 100 crore and above (NBFCs-ND) Table 1 : Assets of NBFC and Banking (SCBs) Sectors as a % to GDP
  • 9.
    Performance of NonBanking Financial Institutions Cross Country Analysis*  Globally, the size of non-bank financial intermediation was equivalent to 117 percent of GDP as at the end of 2012 for 20 jurisdictions and the euro area.  US has the largest system of non-bank financial intermediation with assets of $ 26 trillion, followed by the euro area ($ 22 trillion), the UK ($ 9 trillion) and Japan ($ 4 trillion).  On an average, the size of non-bank financial intermediation in terms of assets was equivalent to 52 per cent of the banking system. However, there were significant cross-country differences, ranging from 10 per cent to 174 per cent.  Non-bank financial intermediation is relatively small in the case of emerging market economies compared to the level of GDP.  In India, Turkey, Indonesia, Argentina, Saudi Arabia the amount of non-bank financial activity remained less than 20 per cent of the GDP as at end 2012. * As per the latest available report on Cross-Country analysis of NBFCs:“Non-Banking Finance Companies: Game Changers”, Speech delivered by Shri P Vijaya Bhaskar, Executive Director, Reserve Bank of India
  • 10.
    Performance of NonBank Financial Institutions(Cont..)  Non-Deposit taking Systemically Important NBFCs (NBFCs-ND-SI)  NBFCs-ND-SI are not raising resources by way of public deposits, they are regulated with fewer rigors compared with NBFCs-D.  Even this type of reclassification of NBFC-ND-SI came into existence since mid-2006 although, the Reserve Bank has initiated measures effective 2000 to reduce the scope of ‘regulatory arbitrage’ between banks, NBFCs-D and NBFCs-ND (RBI, 2008) recognizing their importance, essentially from the systemic stability point of view.  With the recent happening of global financial crisis, the regulators’ attention world over has received increased attention towards the systemically important financial institutions (SIFIs). Item 2013 2014P Percentage Variation 1.Share Capital 674 695 7.40 2. Reserves & Surplus 2,276 2,457 8.00 3.Total Borrowings 8,104 8,902 9.80 4.Current Liabilities & Provisions574 647 12.80 Total Liabilities/Assets11,601 12,701 9.50 1.Loans & Advances 7,600 8,455 11.20 2.Hire Purchase Assets 805 896 11.30 3.Investments 1,945 2,075 6.60 4. Other Assets 1,250 1,276 2.10 Memo Items 1. Capital Market Exposure(CME)885 1,029 16.40 2.CME to Total Assets(percent)7.6 8.1 3.Leverage Ratio 3.0 3.0 (in billion Rs.) Items 2013 2014P 1.Total Income 1,272 1,436 2.Total Expenditure 1,039 1,147 3.Net Profit 233 290 4.Total Assets 11,601 12,701 Financial Ratios(percent) (i) Net Profit to Total Income18.3 20.2 (ii) Net Profit to Total Assets2 2.3 (in billion Rs.) Financial performance of NBFCs-ND-SI sector(As of March) Source: Financial Stability Report (Including Trend and Progress of Banking in India 2013-14)
  • 11.
    0 2 4 Jun… Sep… De… Ma… Jun… Sep… De… Ma… Jun… Sep… Percent Gross NPA toTotal Advances Net NPA to Total Advances 0 0.5 1 1.5 2 2.5 Percent Source: Trend and Progress of Banking in India 2013 Asset quality Deteriorating since the quarter ended March 2013 (Chart 4). Reserve Bank issued separate guidelines for both banks and NBFCs with an objective of mitigating the stress due to their NPAs. Chart 5: Trends in Return on Assets of NBFCS-ND Chart4: Asset Quality of NBFCS-ND-SI Profitability ROA of NBFCs-ND-SI increased to 2.5 per cent in September 2014 after remaining at around 2.3 percent in previous three quarters (Chart 5). 24 25 26 27 28 29 30 Jun-12 Sep-12 Dec-12 Mar-13 Jun-13 Sep-13 Dec-13 Mar-14 Jun-14 Sep-14 Percent Capital adequacy As of March 2014, by and large, the capital adequacy position of the NBFCs-ND-SI remained comfortable and was well above prudential norms. Nevertheless, CRAR of the NBFCs-ND-SI slipped from the peak of 29.0 per cent as of September 2013 to 27.8 per cent by the quarter ended September 2014 (Chart 6). Chart6: CRAR of NBFCS-ND-SI
  • 12.
    Performance of NonBank Financial Institutions(Cont..) > Deposit taking NBFCs (NBFCs-D) 0 1 2 3 4 5 6 Dec-12 Mar-13 Jun-13 Sep-13 Dec-13 Mar-14 Jun-14 Sep-14 Dec-14 Mar-15 Percent Net NPA to Total Advances Gross NPA to Total Advances y = 9E-14x5 - 2E-08x4 + 0.0015x3 - 61.131x2 + 1E+06x - 1E+10 R² = 0.61 y = 9E-14x5 - 2E-08x4 + 0.0015x3 - 61.131x2 + 1E+06x - 1E+10 R² = 0.61 0 0.5 1 1.5 2 2.5 Jun-12 Sep-12 Dec-12 Mar-13 Jun-13 Sep-13 Dec-13 Mar-14 Jun-14 Sep-14 Dec-14 Mar-15 Percent Return On Assets(ROA) Chart 7: Trend in Assets Quality of NBFCs-D Chart 8: Trends in Return on Assets of NBFC-D Source: COSMOS Section , DNBS Reserve Bank of India, Kanpur Asset quality Decrease in Net NPA to Total Advances and Gross NPA to Total Advances from 2.64 and 3.67 as on quarter ended December 2012 to 0.48 and 0.30 as on quarter ended March 2015.. Profitability ROA of NBFCs-D increased to 2.18 per cent in quarter ended March 2015 from 0.9 percent in quarter ended June 2012(Chart 8) .There is a polynomial trend in between this period.
  • 13.
    0 0.5 1 1.5 2 Jun-12 Sep-12 Dec-12 Mar-13 Jun-13 Sep-13 Dec-13 Mar-14 Jun-14 Sep-14 Dec-14 Mar-15 Percent Net Interest Margin(NIM) NetInterest Margin (NIM) The Net Interest Margin of NBFCs-D has considerably increased from 0.12 percent as on quarter ended June 2012 to 1.66 percent as on quarter ended March 2015(Chart 9).There is a polynomial trend followed by NIM in between this period. Chart 10: Trends in Cost Income Ratio of NBFCS-D 0 20 40 60 80 100 120 Jun-12 Sep-12 Dec-12 Mar-13 Jun-13 Sep-13 Dec-13 Mar-14 Jun-14 Sep-14 Dec-14 Mar-15 Percent Cost Income Ratio Cost Income Ratio (CIR) CIR is maintained around 55 percent between the Quarter ended September 2012 and quarter ended June 2012(Chart 10).The highest Cost Income Ratio(CIR) in the time period from quarter ended June 2012 till quarter ended March 2015 was recorded as 109.18 percent in quarter ended September 2014. > Deposit taking NBFCs (NBFCs-D) (Cont..) Chart 9 Trends in Net Interest Margin of NBFCs-D Source: COSMOS Section , DNBS Reserve Bank of India, Kanpur
  • 14.
    Determinants of Profitabilityof NBFCs-D Some of the commonly used accounting measures/ratios for an analysis of efficiency/profitability are cost- to-income ratio (CI), net interest margin (NIM), and return on assets (ROA). Chart 11: Trends in Accounting Measures reflecting Efficiency -20.0000 0.0000 20.0000 40.0000 60.0000 80.0000 100.0000 2011-2012 2012-2013 2013-2014 2014-2015 Percentage Financial Year ROA NIM CIR Source: COSMOS Section , DNBS, Reserve Bank of India, Kanpur Dependent Variables Definition Source CIR Cost-to-Income ratio : (operating costs(including provisions and contingencies ) /Total Income) * 100 Operations and Performance of Commercial Banks”, Trend and Progress of Banking in India(2012- 2013)NIM Net interest margin : (net interest income / Total assets )*100 ROA Return on Assets: (net profit/Total assets)*100
  • 15.
    Criterion of Selectionof Independent Variables Dependent Variables Definition Source NII Net Interest Income= Interest Earned - Interest Paid Research Papers:“Determinants of Profitability of Banks In India” (B.S.Badola and Richa Verma) and “Determinants of Profitability of Non Bank Financial Institutions’ in a developing country :Evidence from Bangladesh” (Md.Sogir Hossain Khandoker et.al) NONII Non-Interest Income= Total Income - Interest Income Loans Total Loans and Advances Deposits Total Deposits NPA Non-performing Assets as percentage to Net Advances PC Provision and Contingencies (P&C) OE Operating Expenses : Includes establishment expenditure, salary expenditure and –expenditure on technology up gradation NOF Net Owned Fund GDP Gross Domestic Product Own Interest CRAR Capital Risk Adequacy Ratio
  • 16.
    Description of data Paneldata of 254 NBFCs –Deposit taking is collected for this study. In econometrics, the term panel data refers to multi-dimensional data frequently involving measurements over time. This data is generated by pooling time-series observations from 2011 to 2014 across 254 Deposit taking NBFCs. Country : India Panel Data of NBFCs –D Collected by: COSMOS Section, DNBS,RBI Kanpur Years Available: 2011,2012,2013,2014 (of 4 quarters each) Data Description: This data is of different deposit taking NBFCs present in all the regions (AHM,BAN,CAL,CHA,CHE,DEL,HYD,J AI,JAM,LUC,MUM,PAT,THI) in India. Variables Net Interest Income(NII), Non-Interest Income (NONII), NPA as percentage to Net Advances (NPA), Provision and Contingencies (P&C), Operating Expenses (OE), NET owned Fund (NOF) ,cost-to-income ratio(CIR) ,Net interest margin (NIM), Return on assets (ROA),Total Loans and Advances, Investments ,Deposits, and Borrowings of the different companies**AHM,BAN,CAL,CHA,CHE,DEL,HYD,JAI,JAM,LUC, MUM,PAT and THI stands for Ahmedabad, Bangalore, Kolkata, Chandigarh, Chennai, Delhi, Hyderabad, Jaipur, Jammu, Lucknow, Mumbai, Patna and Thiruvananthpuram.
  • 17.
    Used statistical softwareR and SPSS for analysis .  Scaling of data Since some variables like NII, NONII, NPA, PC, OE, NOF, NIM, Total Loans and Advances, and Deposits are divided by the corresponding total assets size of the companies so that the proper weight age can be given to each company.  Multicollinearity The variables causing multicollinearity are dropped from the model by using Akaike Information Criterion in order to identify the variables that have high explanatory powers and are, therefore, more important in managing the operations of a NBFCs. . Data Analysis & Presentation Technique
  • 18.
    Data Analysis Description ofModels Since analysis is based on panel data. So we are considering three different models :Ordinary least Squares regression model (OLS), fixed and random regression models. Assumptions Normality of errors is expected to follow according to central limit theorem. Heteroscedasticity is assumed. Cross-sectional dependence is a problem in macro panels with long time series*. Here we have micro panel data i.e. only four year data quarter wise. *Ref : “Getting Started in Fixed/Random Effects Models using R (ver. 0.1-Draft)”, available at http://dss.princeton.edu/training/, retrieved on June 30th ,2015
  • 19.
    Different Models ConsideringROA as Profitability Indicator  Independent variables : NII,NONII,NPA , PC, OE, NOF , Loans, Deposits.  Dependent variable. :Return on assets (ROA)  There is no multicollinearity in the model. Hence the models fitted using Return on Assets (ROA) as dependent variable are described below : ROA OLS regression Within or Fixed Effects Random Effects GDP -0.03 -0.0647 -0.07 NONII 37.53* 8.38* 7.73* NII 49.42* 8.61* 7.72* Loans -0.85* -0.147 -0.183 Deposits 1.30* 0.126 -0.325 OE -3.58* -7.865* -7.245* PC -1.54* -0.793 -1.003 NOF 0.828* -0.412* -0.212 CRAR -0.00003* -0.00001 -0.00002 NPA -0.00005* -0.00001 -0.000014 Adj R Sq. 0.74 0.49 0.52 F-Statistic 971.7 358.19 362.9 Note :The Asterisk (*) sign shows that the corresponding variable is significant at 5 % level of significance. Hausman test shows that the random model is best fitted to the data. Hence, NONII, NII and OE are coming out to be significant at 5 % level of significance. Results shows that the higher values of NONII and NII are associated with higher values of ROA for all estimators while OE has negative impact on ROA.
  • 20.
    Different Models ConsideringNIM as Profitability Indicator  Independent variables : NONII,GDP, NPA, PC, OE, NOF ,Loans, CRAR, Deposits  Dependent variable. : NIM  Multicollinearity in the model is removed using AIC technique. Hence the models fitted using Net Interest Margin (NIM) as dependent variable are described below : NIM OLS regression Within or Fixed Effects Random Effects GDP 0.403* -0.0775 -0.0686 NONII -70.78* -70.41* -70.39* OE 67.49* 66.89* 66.85* NPA 0.000003* 0.00012* 0.00012* Loans 3.412* -2.8617* -2.576* NOF -0.823* -1.401* -1.552* Deposits -2.93* 1.085 1.129 PC -2.371 -0.282 -2.873 Adj R Sq 0.99 0.994 0.99 F-statistic 2.11E+05 65871.5 67735.4 Note :The Asterisk (*) sign shows that the corresponding variable is significant at 5 % level of significance. Hausman test shows that the fixed effect model is better fitted but both the models random and fixed are providing the same results. Hence, NONII, OE, NPA, Loans and NOF are coming out to be significant at 5 % level of significance. Result shows that the higher values of Loans, NOF and NONII leads to decrease in NIM while higher values of NPA and OE are associated with increase in NIM for all estimators.
  • 21.
    Different Models ConsideringCIR as Profitability Indicator  Independent variables : NII, NONII,GDP, NPA, PC, OE, NOF ,Loans, CRAR, Deposits  Dependent variable. : CIR  Multicollinearity in the model is removed using AIC technique. Hence the models fitted using Cost Income Ratio (CIR) as dependent variable are described below : CIR OLS regression NOF 66.7* GDP 7.38* NPA 0.0028* Loans -36.27* Deposits -51.85 Adj R Sq 0.06089 F-statistic 43.13 Note :The Asterisk (*) sign shows that the corresponding variable is significant at 5 % level of significance. Results show that the NOF, GDP, NPA, and Loans are coming out to be significant at 5 % level of significance. Higher values of loans results in decrease in CIR. On the same lines, the Comparison of Kanpur Regional Office with Other Regional Offices is done
  • 22.
    Conclusions  The overallsummary of Different Models Considering ROA, NIM and CIR as Profitability Indicators separately for Kanpur Regional office and other regional offices which includes AHM,BAN,CAL,CHA,CHE,DEL,HYD,JAI,JAM,LUC,MUM,PAT,THI is given below : Comparison of the profitability indicators of NBFC-D of Kanpur-RO with that of the other regional offices: Profitability Indicators Region NONII NII Loans OE NOF CRAR NPA ROA LUC *(+) *(+) *(-) OTHER *(+) *(+) *(-) *(-) NIM LUC *(-) *(+) *(+) OTHER *(-) *(-) *(+) *(-) CIR LUC *(+) OTHER *(+) ROA: In Kanpur RO, Decrease in OE and Increase in NONII and Loans leads to increase in ROA while in other RO’s, instead of Loans, increase in NII and decrease in NPA leads to ROA’s increase. NIM: In Kanpur RO, Increase in NONII and decrease in Loans and OE leads to decrease in NIM while in other RO’s, increase in NONII, Loans and NOF and decrease in OE leads to NIM’s decrease. CIR: In Kanpur RO, decrease in CRAR leads to decrease in CIR while in other RO ’s , decrease in NPA leads to CIR’s decrease.
  • 23.
    Conclusions(Cont..) Influential factors behindthe NBFC Deposit taking industry’s profitability: Profitability Indicators GDP NONII NII Loans OE NOF NPA ROA *(+) *(+) *(-) NIM *(-) *(-) *(+) *(-) *(+) CIR *(+) *(-) *(+) Fee based income i.e. Non Interest Income, Net Interest Income and Operating expenditure are main determinants of ROA.Therefore In general, For increasing Returns on Asset (ROA) , NBFCs-D may increase their lines of credit and increase their Fee based income business apart from focusing on their main line of business which will improve their Margins too if they can simultaneously control their Operating expenses (OE). For decreasing NIM, they have to increase NONII, NOF and Loans while need to decrease OE and NPA. NBFCs -D should look for improving capital base i.e. Net Owned Fund (NOF) so that they can implement their IT infrastructure smoothly since it involves huge cost. Increase in deployment of Loans and improvement in the Asset Quality leads to obtain a optimum level of CIR.
  • 24.
    Recommendations:  NBFCs shouldincrease their NOF :NBFCs may face decline in their profitability indicators in the short run but in the longer run it will benefit them. Since introduction of new small and payment banks will increase competition in this sector catering the same customer base and will pose a tough challenge to these NBFCs.  Improvement in CRAR will lead to increase in the loss absorbing capacity of the company; increase in capital will help them in improving the market perception of their financial soundness. This may lead to ease in raising their resources and funds to shore up their NOF. With higher NOF and income, companies will be in better position to implement IT infrastructure which initially requires high cost but after reaching break even it can reduce their operation costs and thus leading to improvement in Cost to income ratios too.  Since this data is of much use subject to its reliability and availability and this study leaves room for further study in different areas of NBFI functions such as products of productivity analysis, Data Envelopment Analysis (DEA).
  • 25.
    Limitations Although this studywas carefully prepared, I am still aware of its limitations and shortcomings.  Time Period: In this study, it would have been better if a larger time period was covered. It'd have given a better picture of the NBFCs sector in India.  The project is done on few variables affecting the profitability. There are bound to be other variables which may considerably affect the profitability of banks.
  • 26.