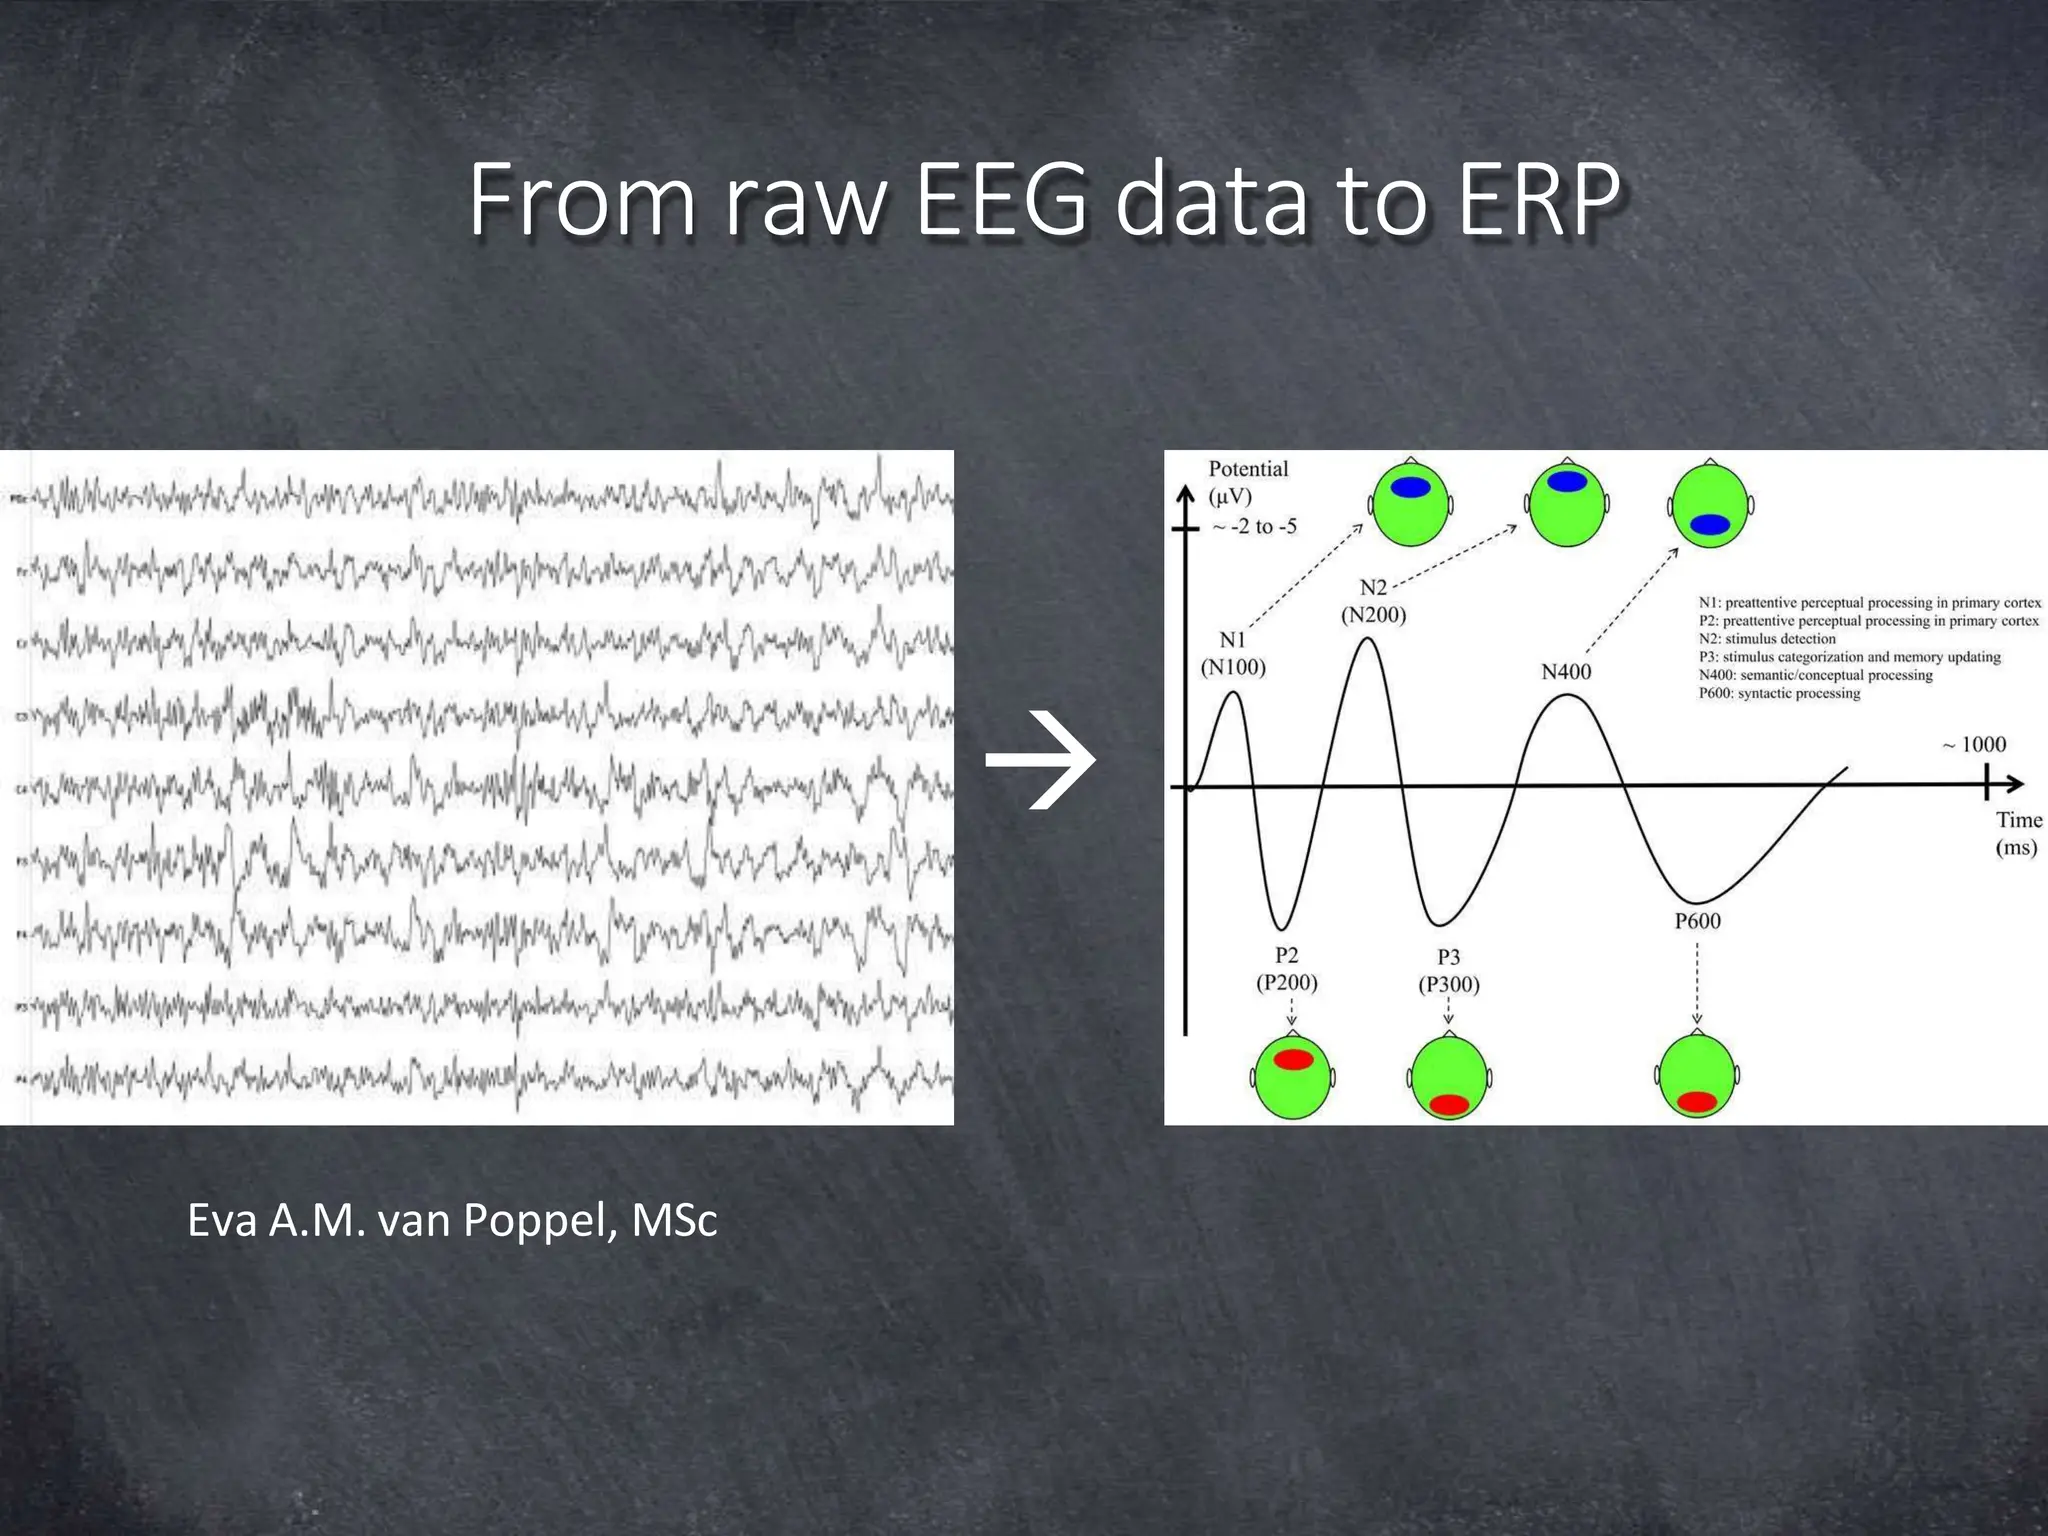
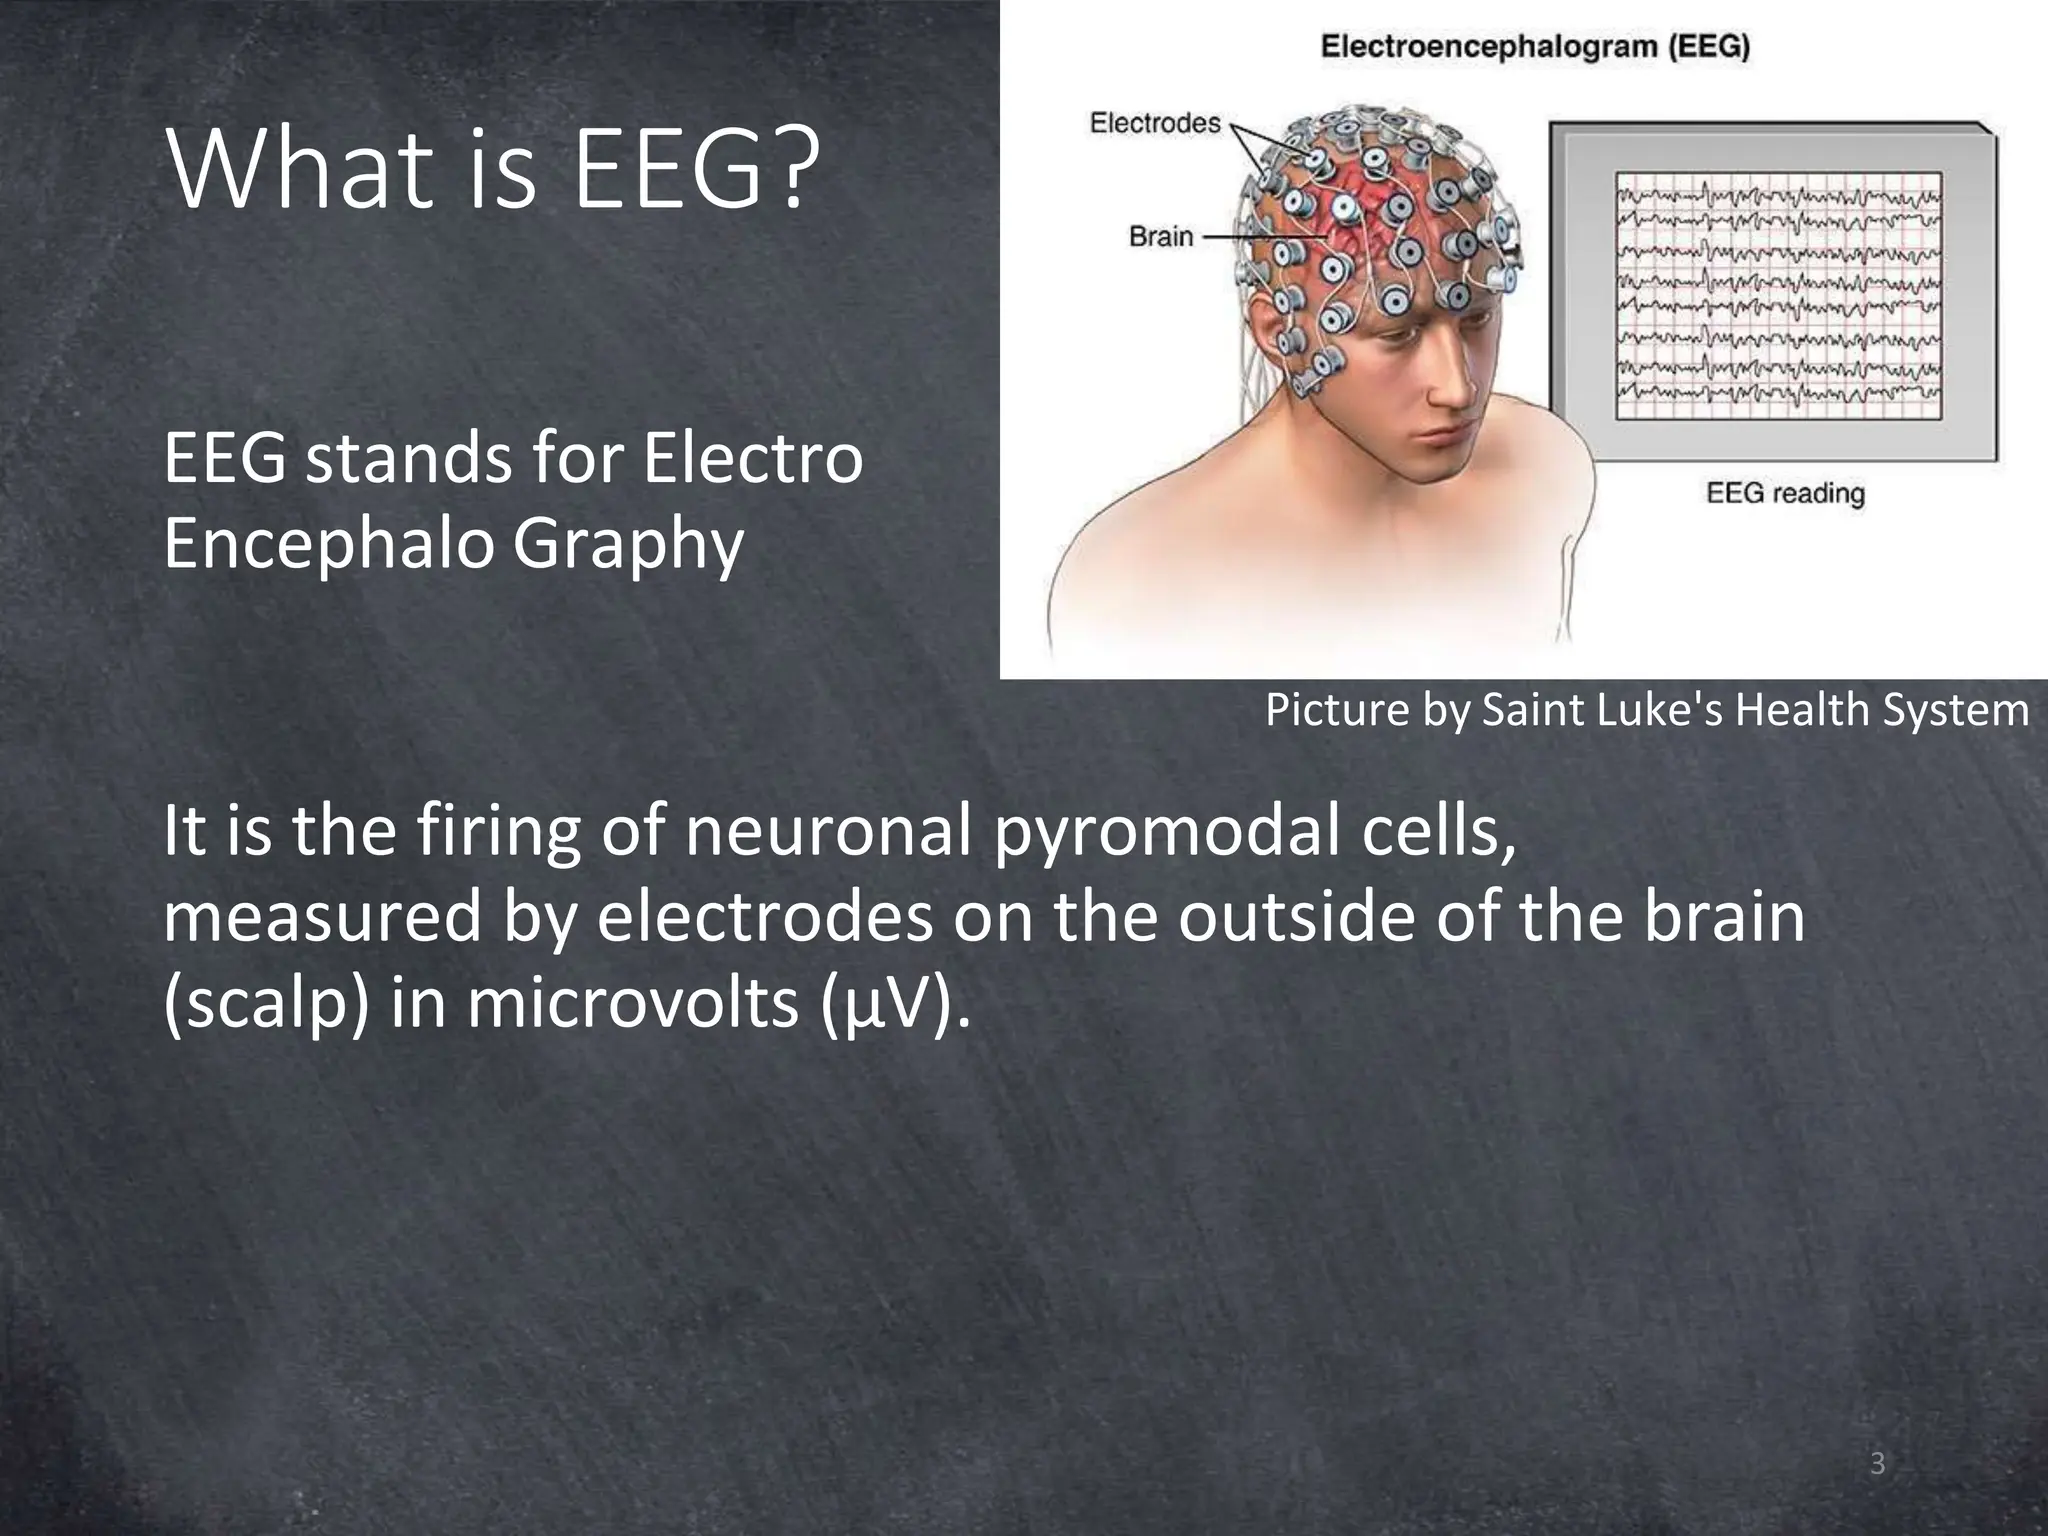
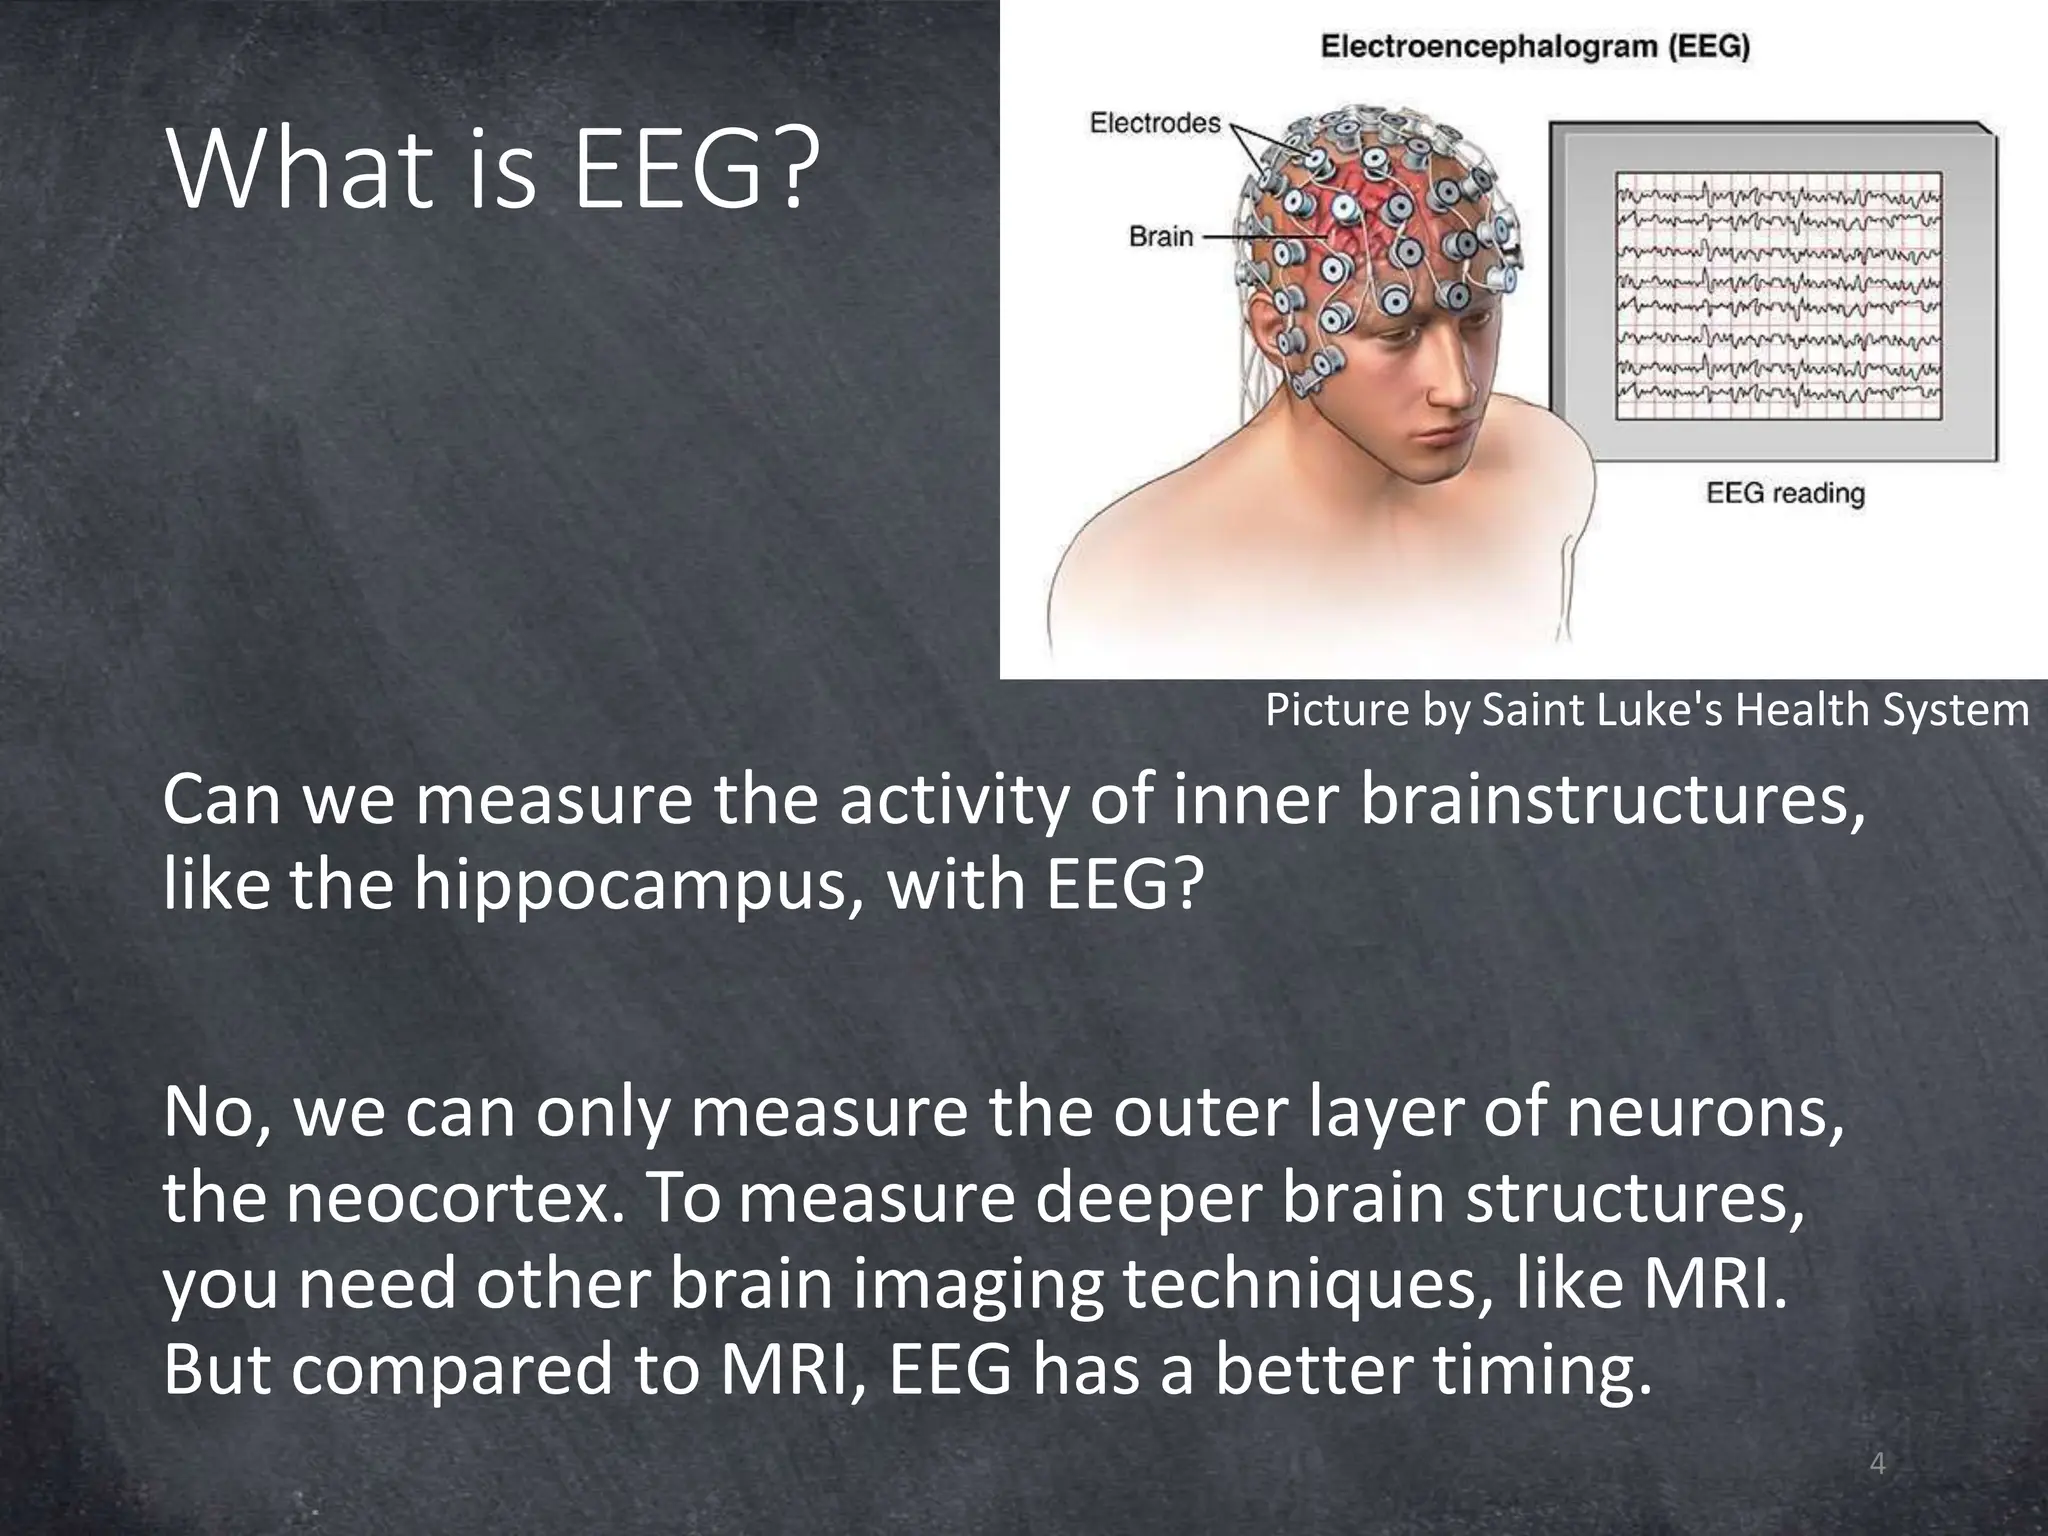
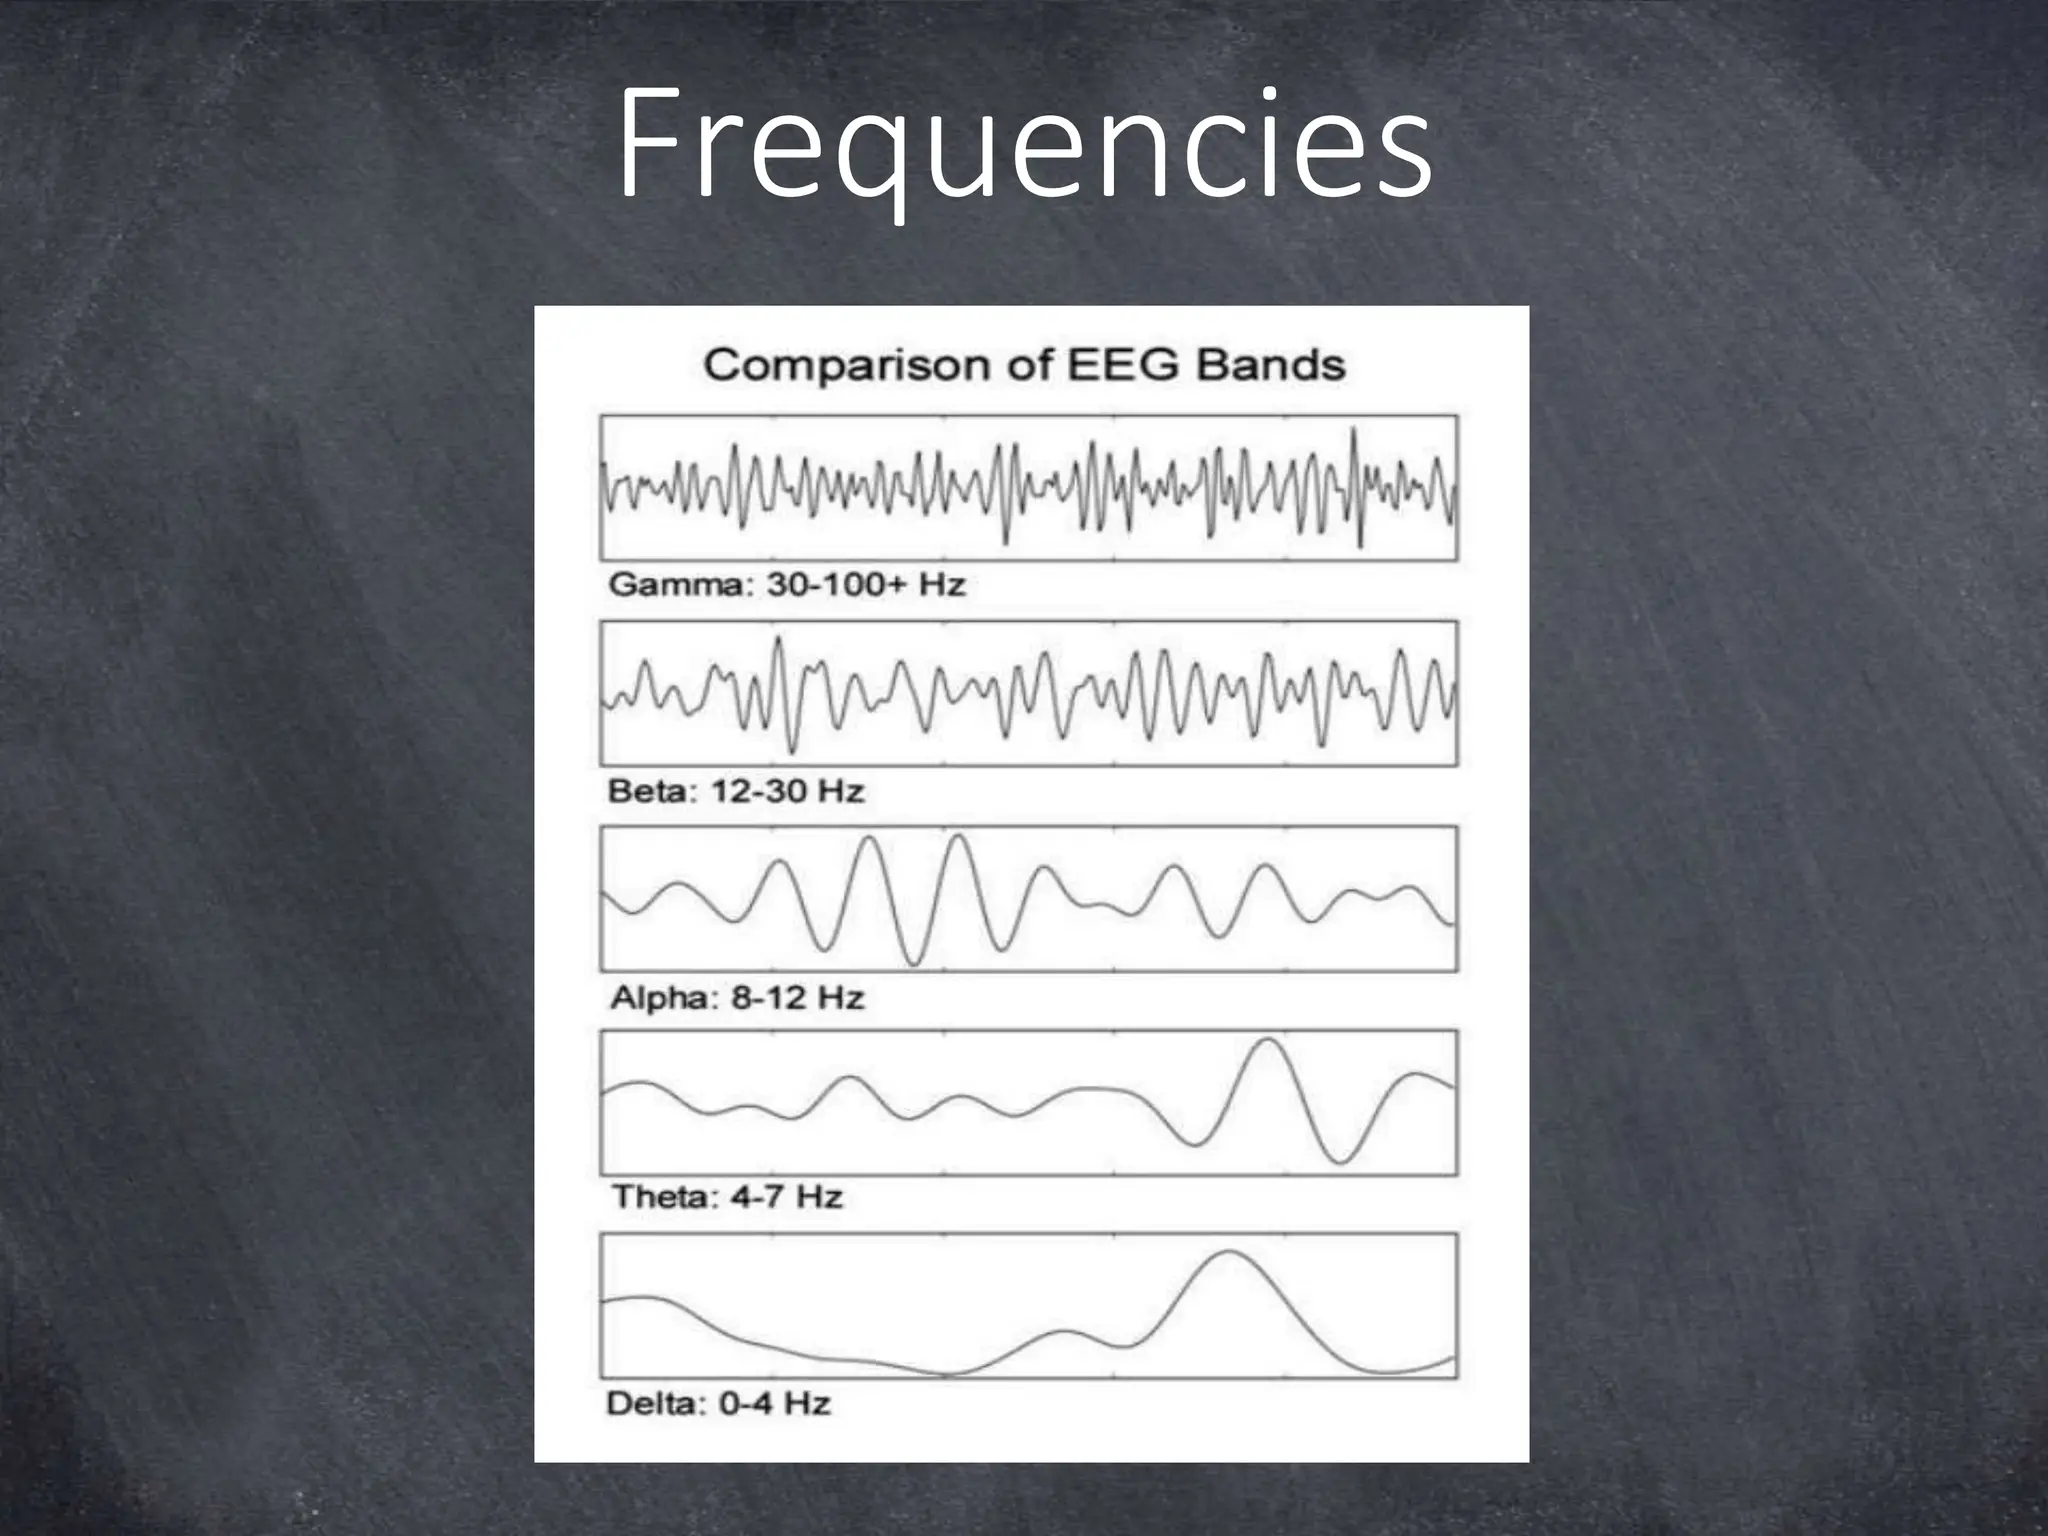
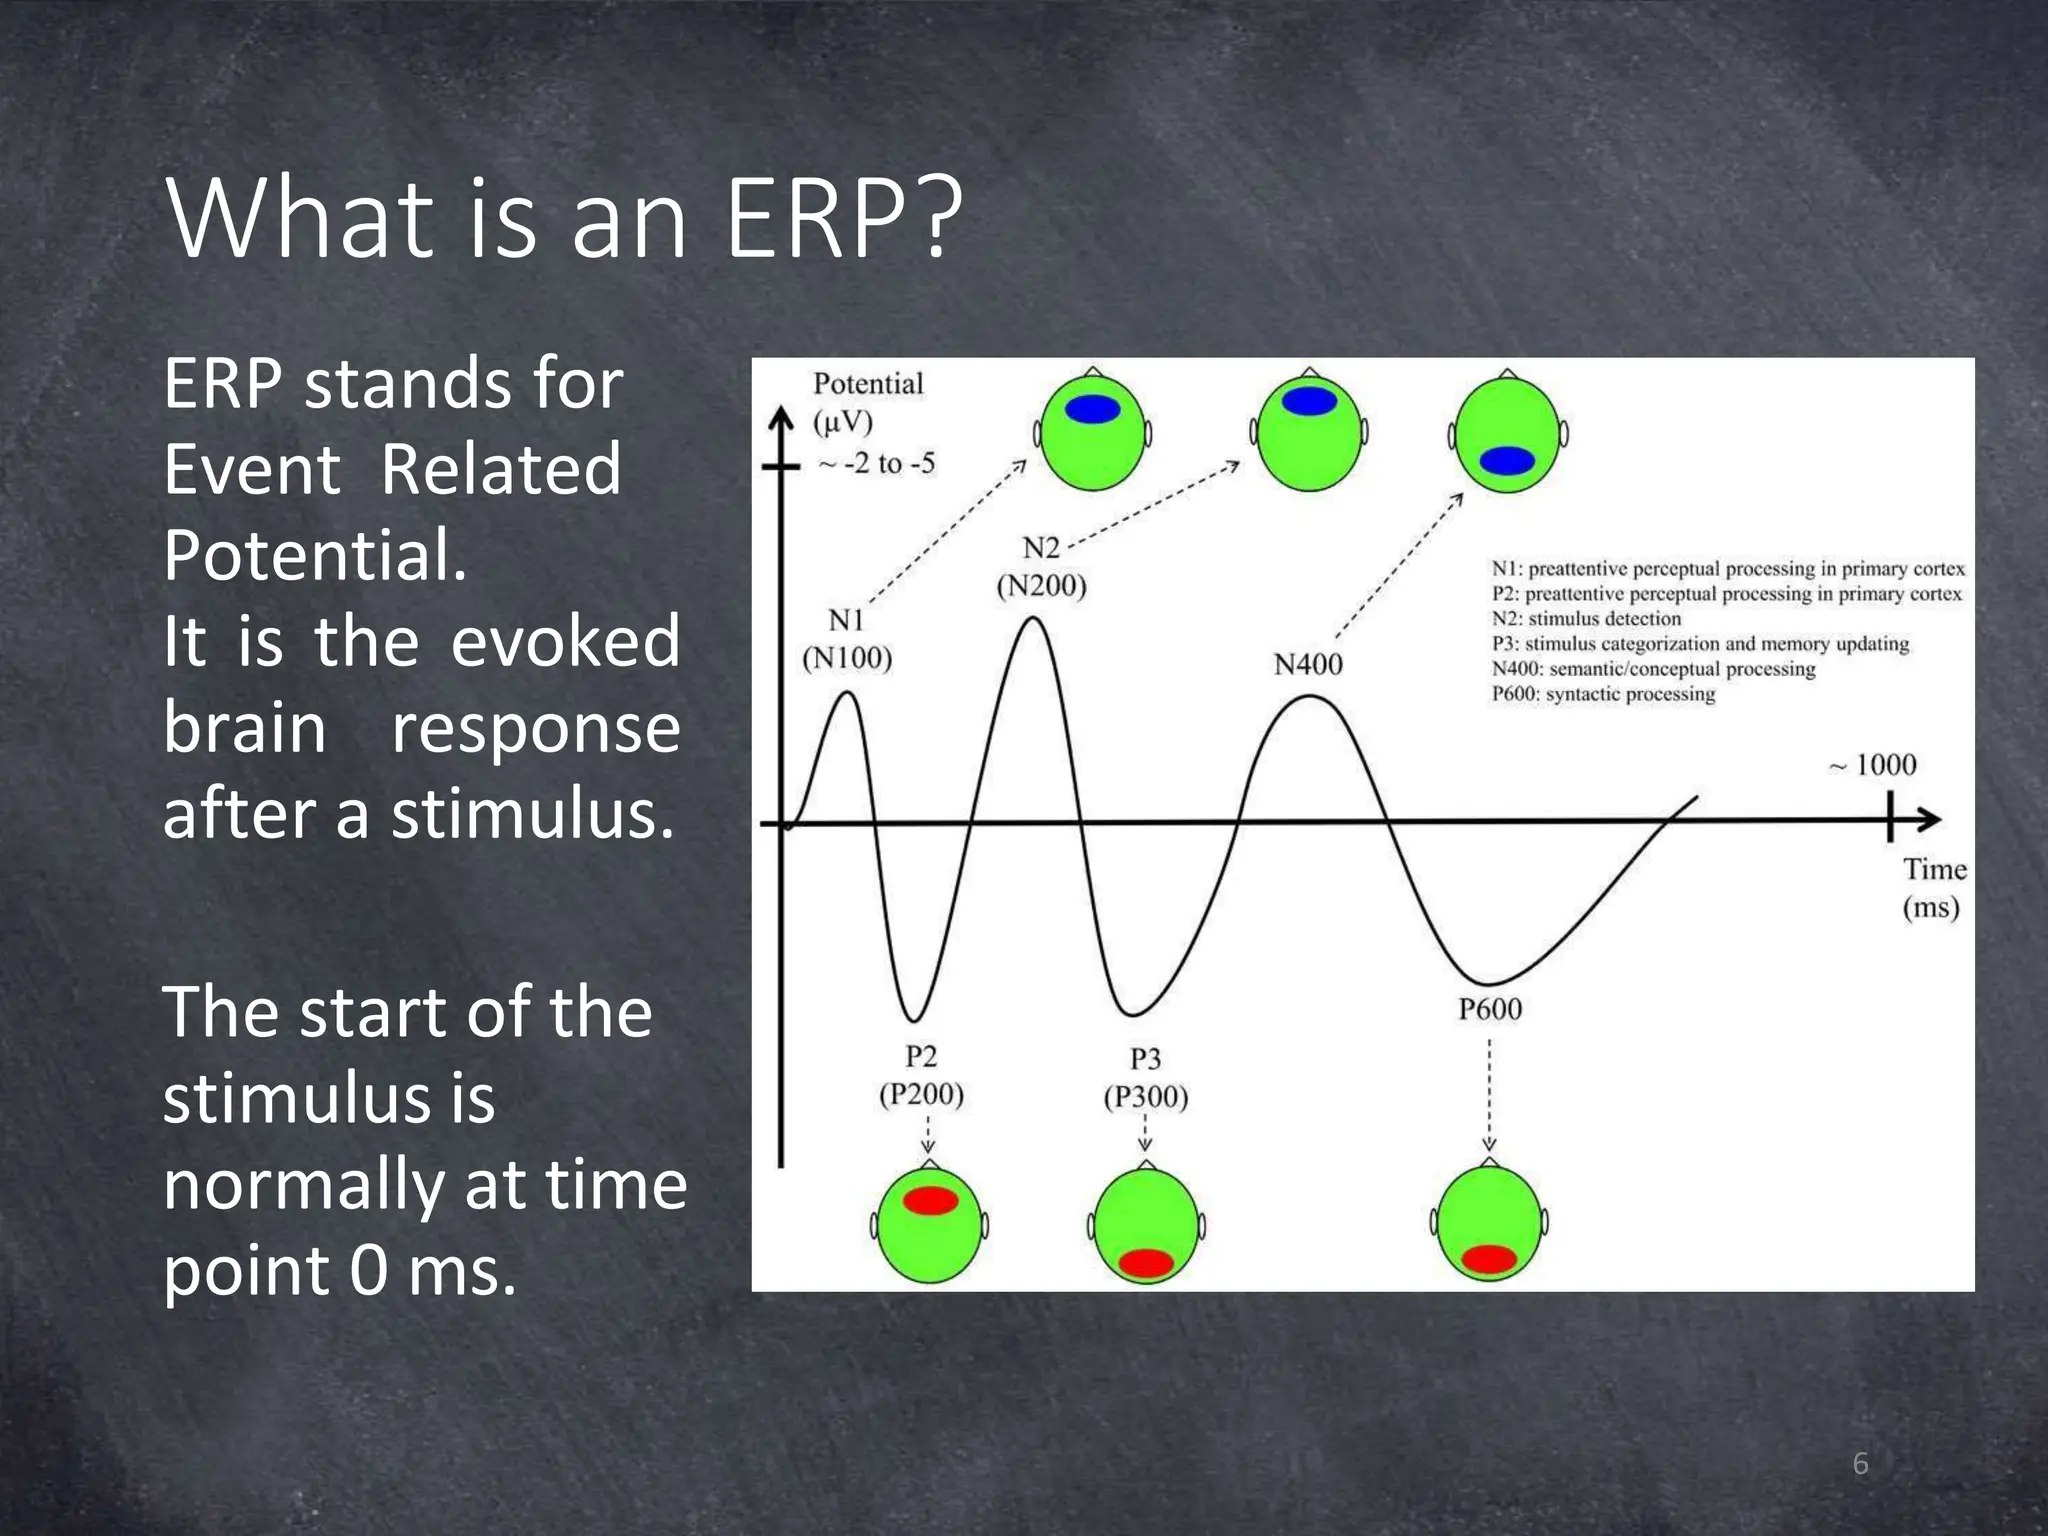
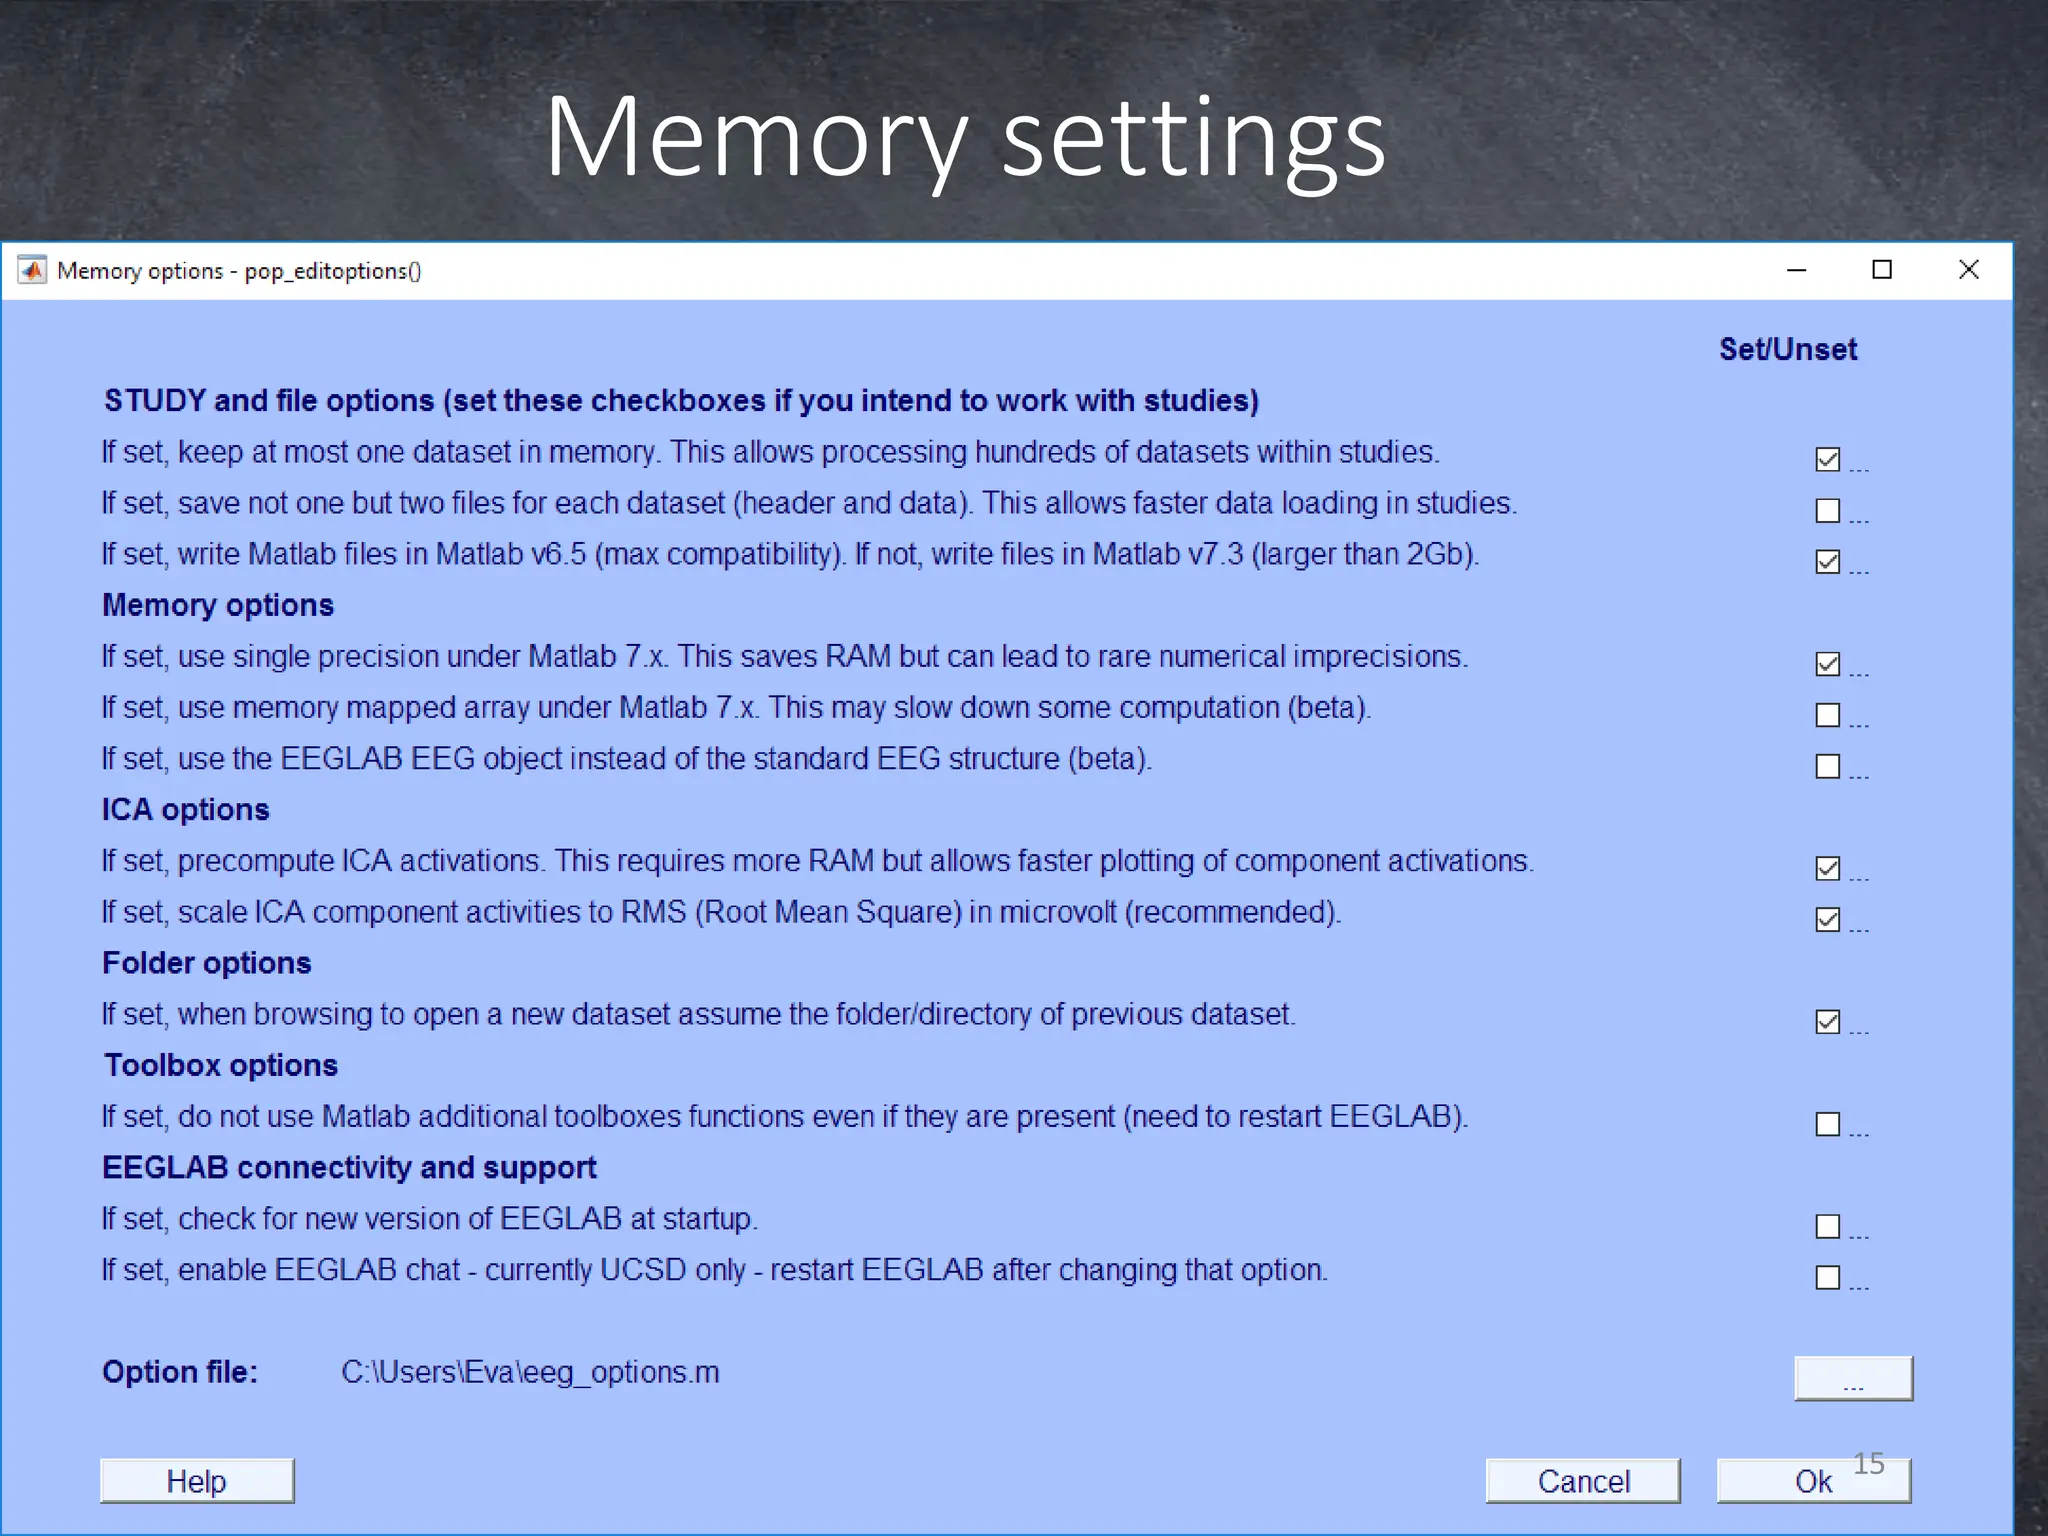
This document provides an overview of electroencephalography (EEG) and event-related potentials (ERPs). It explains that EEG measures neuronal activity from the scalp, while ERPs measure evoked brain responses to stimuli over time. The document then introduces MATLAB and demonstrates how to import raw EEG data, re-reference it, filter, epoch, and create ERPs in the EEGLAB toolbox to analyze brain responses. Statistical analysis can then be performed using Fieldtrip.
![Introduction to MATLAB
7
• MATLAB stands for Matrix Laboratory
• First of all, it is a calculator. For example, type 5 +
8*5 and press Enter
• A Matrix is an array (series) of data, stored in rows
and columns (2D). For example, type [1:5;6:10] and
press Enter.
• Variable is the way MATLAB stores data in the
working memory (workspace). Press arrow up and
make it A= [1:5;6:10]
Variable A now contains your matrix. Note that
variable ans will be overwritten.](https://image.slidesharecdn.com/analysingeegdatausingmatlab-1708222058184-1-240119191811-6e5f67bd/75/analysingeeg-datausing-matlab-ppt-7-2048.jpg)
![Transpose and Text
9
• Type E=D’
• Transpose ‘
• T = ‘Text’;
• Price = ‘10CHF’
• randn function makes a vector with normally
distributed random numbers, which are the same on
each Matlab start up.
• X=randn(5)
• Y=[1:2:10]
• Y = [1:2:10;2:3:15]](https://image.slidesharecdn.com/analysingeegdatausingmatlab-1708222058184-1-240119191811-6e5f67bd/75/analysingeeg-datausing-matlab-ppt-9-2048.jpg)
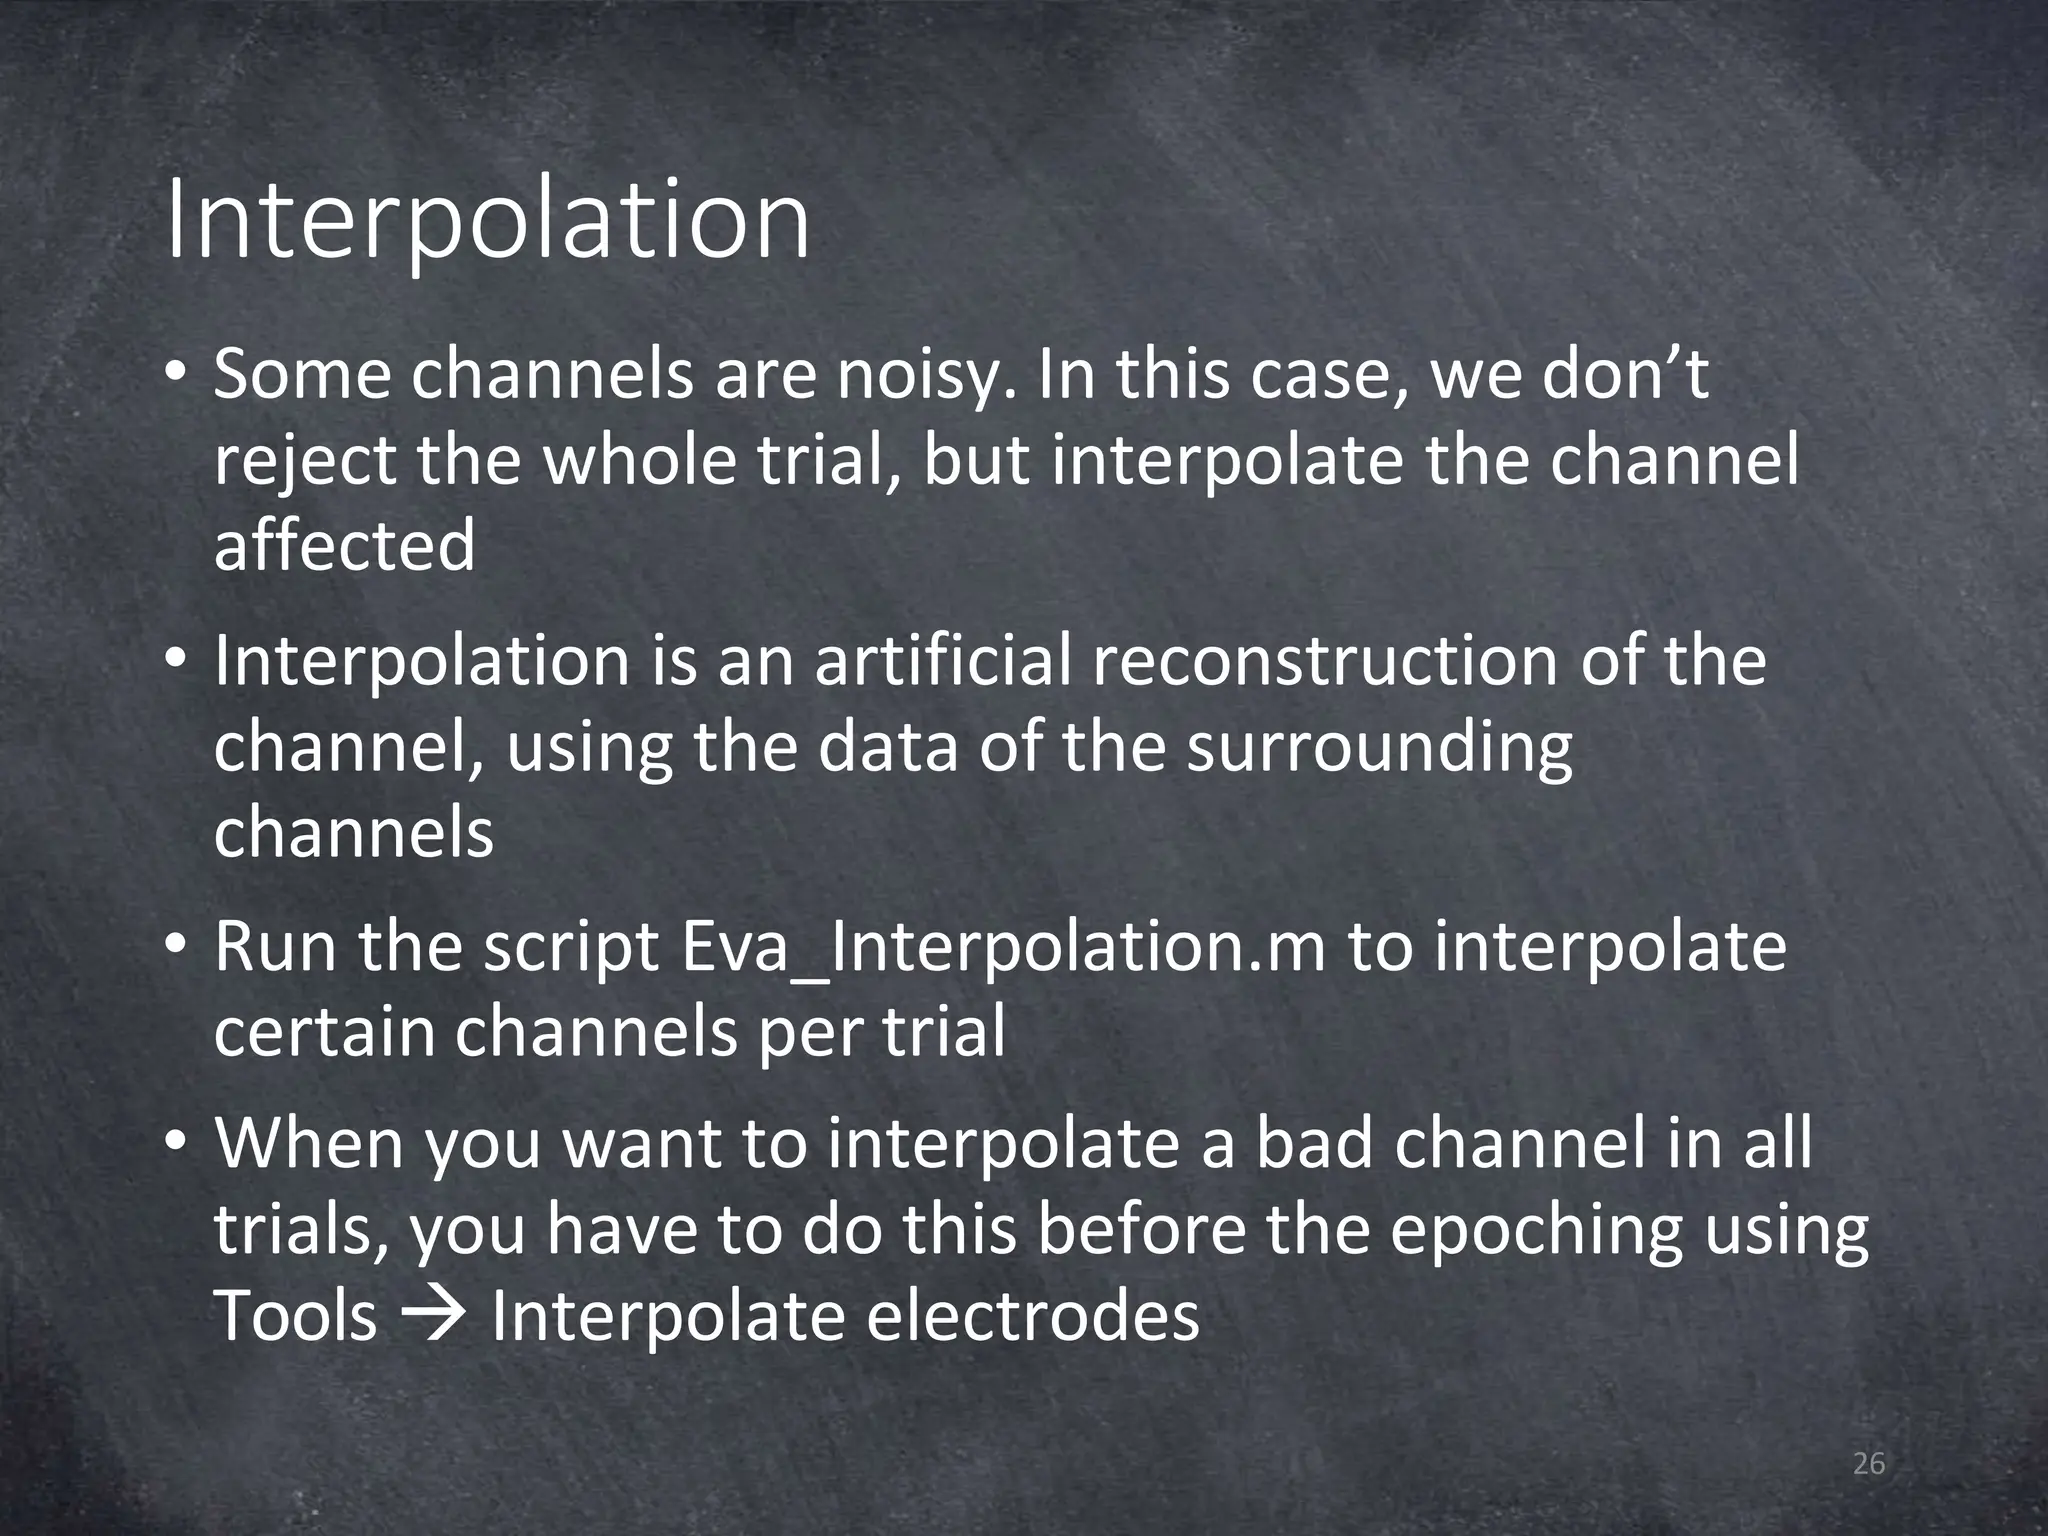
![Final datasets
27
• When you interpolated bad channels, you can
delete the trials containing artefacts
• In EEGLAB: Edit Select data Epoch range fill in
trials to reject e.g. [1 10] Click remove these and ok
• Save as P5_Final.set](https://image.slidesharecdn.com/analysingeegdatausingmatlab-1708222058184-1-240119191811-6e5f67bd/75/analysingeeg-datausing-matlab-ppt-27-2048.jpg)


![[DSC Europe 25] Ivan Peric - Intelligence Swarm Logic and Techno-Functional M...](https://cdn.slidesharecdn.com/ss_thumbnails/7my7c97fsduiccadgavw-2-251212103249-5a03f7c6-thumbnail.jpg?width=640&height=640&fit=bounds)


![[DSC Europe 25] Milan Zdravkovic - The road less traveled in District Heating...](https://cdn.slidesharecdn.com/ss_thumbnails/nfaboniqwsz4ucyctnmy-2-milan-zdravkovic-dsc2025-the-road-less-traveled-in-district-heating-operation-251208151905-f56388a5-thumbnail.jpg?width=640&height=640&fit=bounds)
![[DSC Europe 25] Kaja Kandare - LLM as a judge.pptx](https://cdn.slidesharecdn.com/ss_thumbnails/arxyccaxsdsd1ba99wjw-7-251212104007-2b4e3f64-thumbnail.jpg?width=640&height=640&fit=bounds)
![[DSC Europe 25] Jovan Bogicevic - Legacy to AI-Driven Defense: Transforming D...](https://cdn.slidesharecdn.com/ss_thumbnails/rsarluadt563hntyfc8q-3-251211083849-3e7bc4c0-thumbnail.jpg?width=640&height=640&fit=bounds)
![[DSC Europe 25] Behzad Hosseini - AI Agents in the Wild: Deploying Models tha...](https://cdn.slidesharecdn.com/ss_thumbnails/3qtejajvsjqrzwfept2c-10-251212103250-7f2b1068-thumbnail.jpg?width=640&height=640&fit=bounds)
![[DSC Europe 25] Nikolay Burlutskiy - Best Practices for Building Enterprise M...](https://cdn.slidesharecdn.com/ss_thumbnails/uirvaiuvq8y1w8hzd9tx-7-251212103249-2619edb4-thumbnail.jpg?width=640&height=640&fit=bounds)
![[DSC Europe 25] Vladimir Jelic - The AI-Driven Security Shift From Reactive D...](https://cdn.slidesharecdn.com/ss_thumbnails/6g5gj25mtjwayniqem1t-6-251209104645-7a5a5fc6-thumbnail.jpg?width=640&height=640&fit=bounds)


![[DSC Europe 25] Marija Vlajkovic & Andrea Radonjanin - Integration of AI tool...](https://cdn.slidesharecdn.com/ss_thumbnails/qf1jrglttoc3bm8s3aop-final-integration-of-ai-tools-251208151905-394f3a6a-thumbnail.jpg?width=640&height=640&fit=bounds)
![[DSC Europe 25] Sara Polak - The Archaeology of Innovation: AI as the Next Cr...](https://cdn.slidesharecdn.com/ss_thumbnails/7ecbscdnt8mlcuqbd2ln-2-sara-polak-ai-creative-industries-251208152533-aa1fcf54-thumbnail.jpg?width=640&height=640&fit=bounds)

![[DSC Europe 25] Branko Dzakula - From Defense to Attack: How AI Redefines Cyb...](https://cdn.slidesharecdn.com/ss_thumbnails/80bdzdxpr3ky2g0qvyk9-8-251211083048-ce5fc1ee-thumbnail.jpg?width=640&height=640&fit=bounds)
![[DSC Europe 25] Hans Kleinsman - The Compliance Gearbox: How Tax Tech Mediate...](https://cdn.slidesharecdn.com/ss_thumbnails/dxdytie1toel0hr90bjs-2-251212103250-174fdbe7-thumbnail.jpg?width=640&height=640&fit=bounds)
![[DSC Europe 25] Debmalya Biswas - Agentification: the art of transforming man...](https://cdn.slidesharecdn.com/ss_thumbnails/r5azlggvtqiaiiusrqdr-4-251212103249-5a12c89b-thumbnail.jpg?width=640&height=640&fit=bounds)