Download to read offline


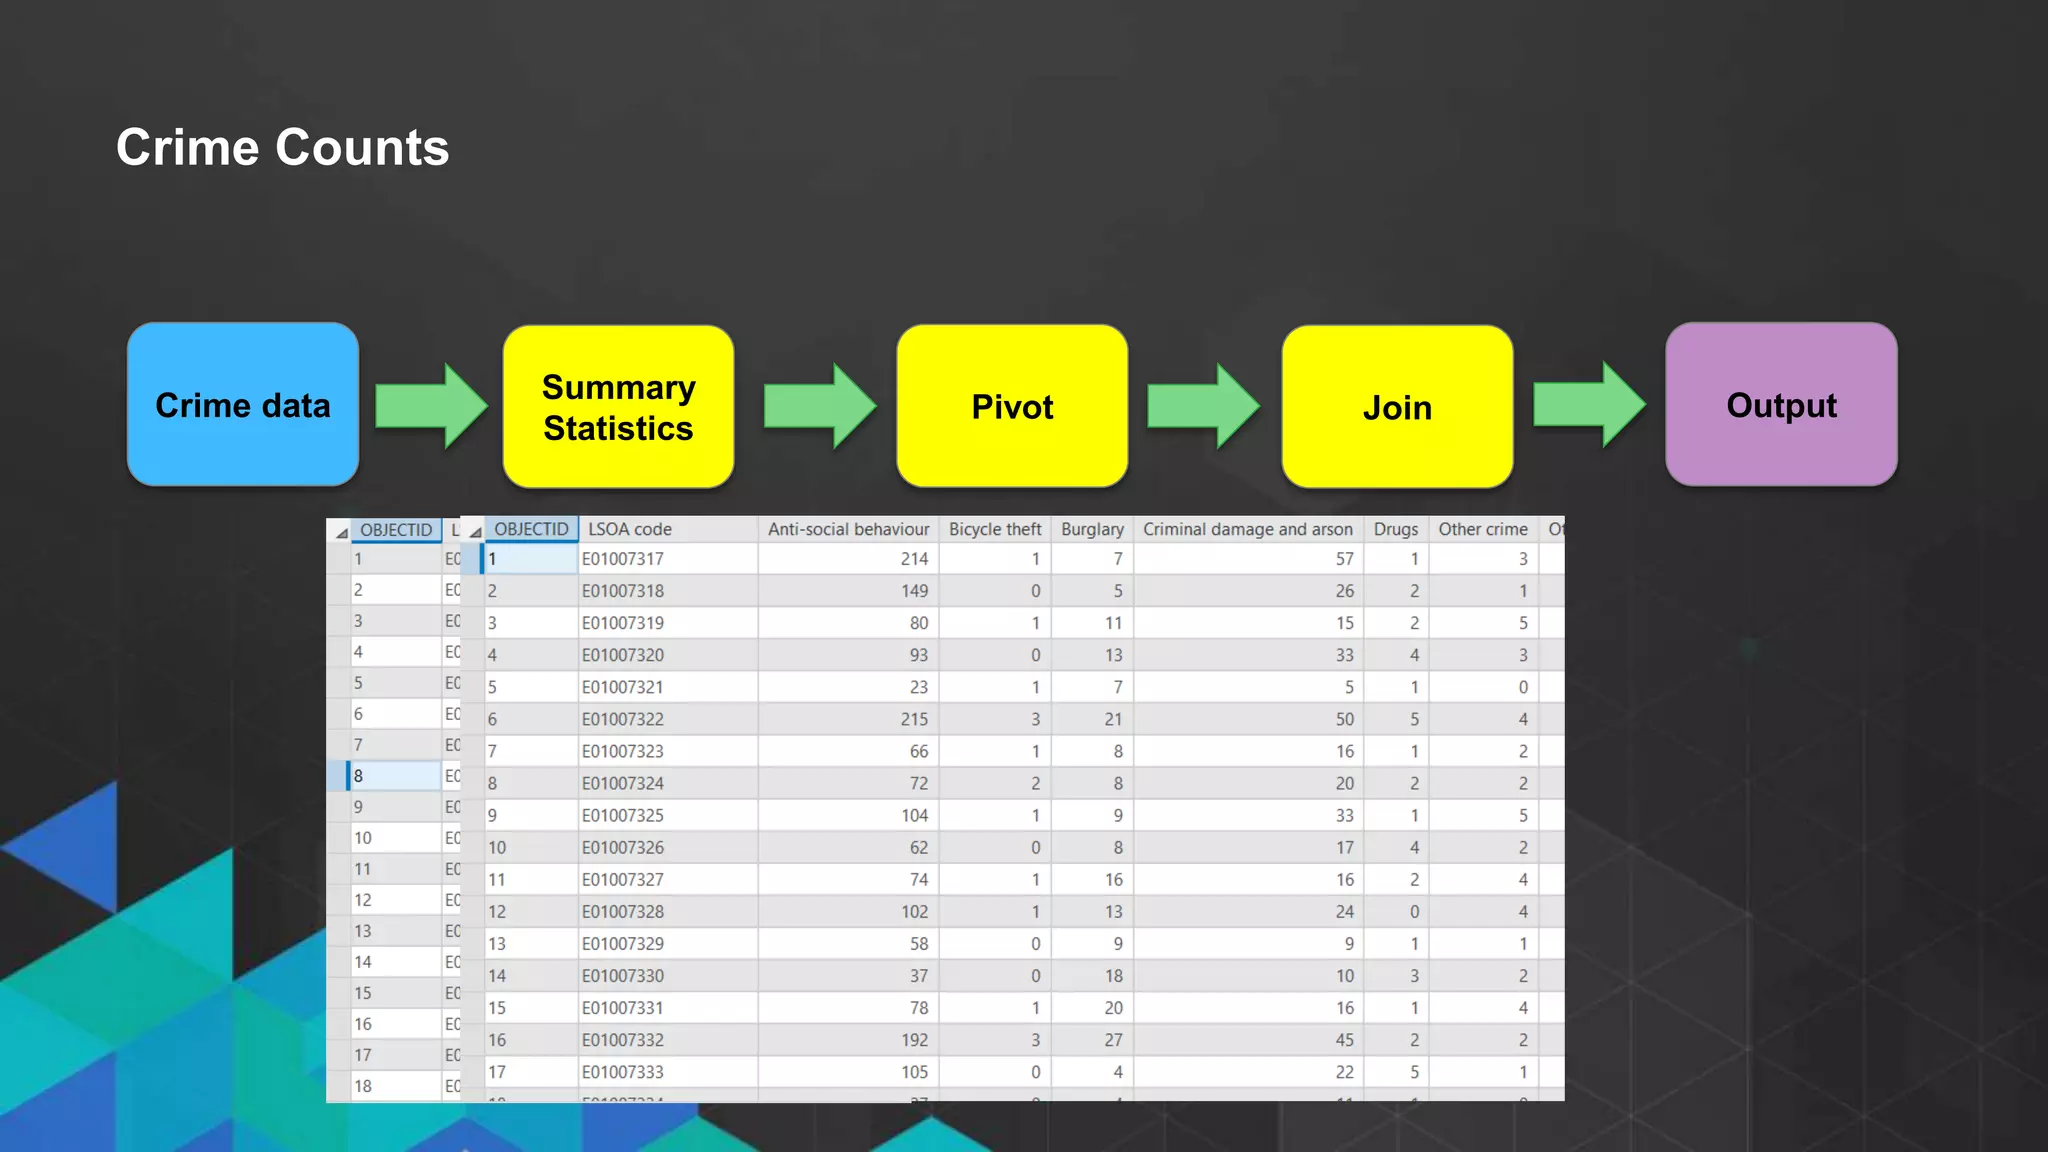
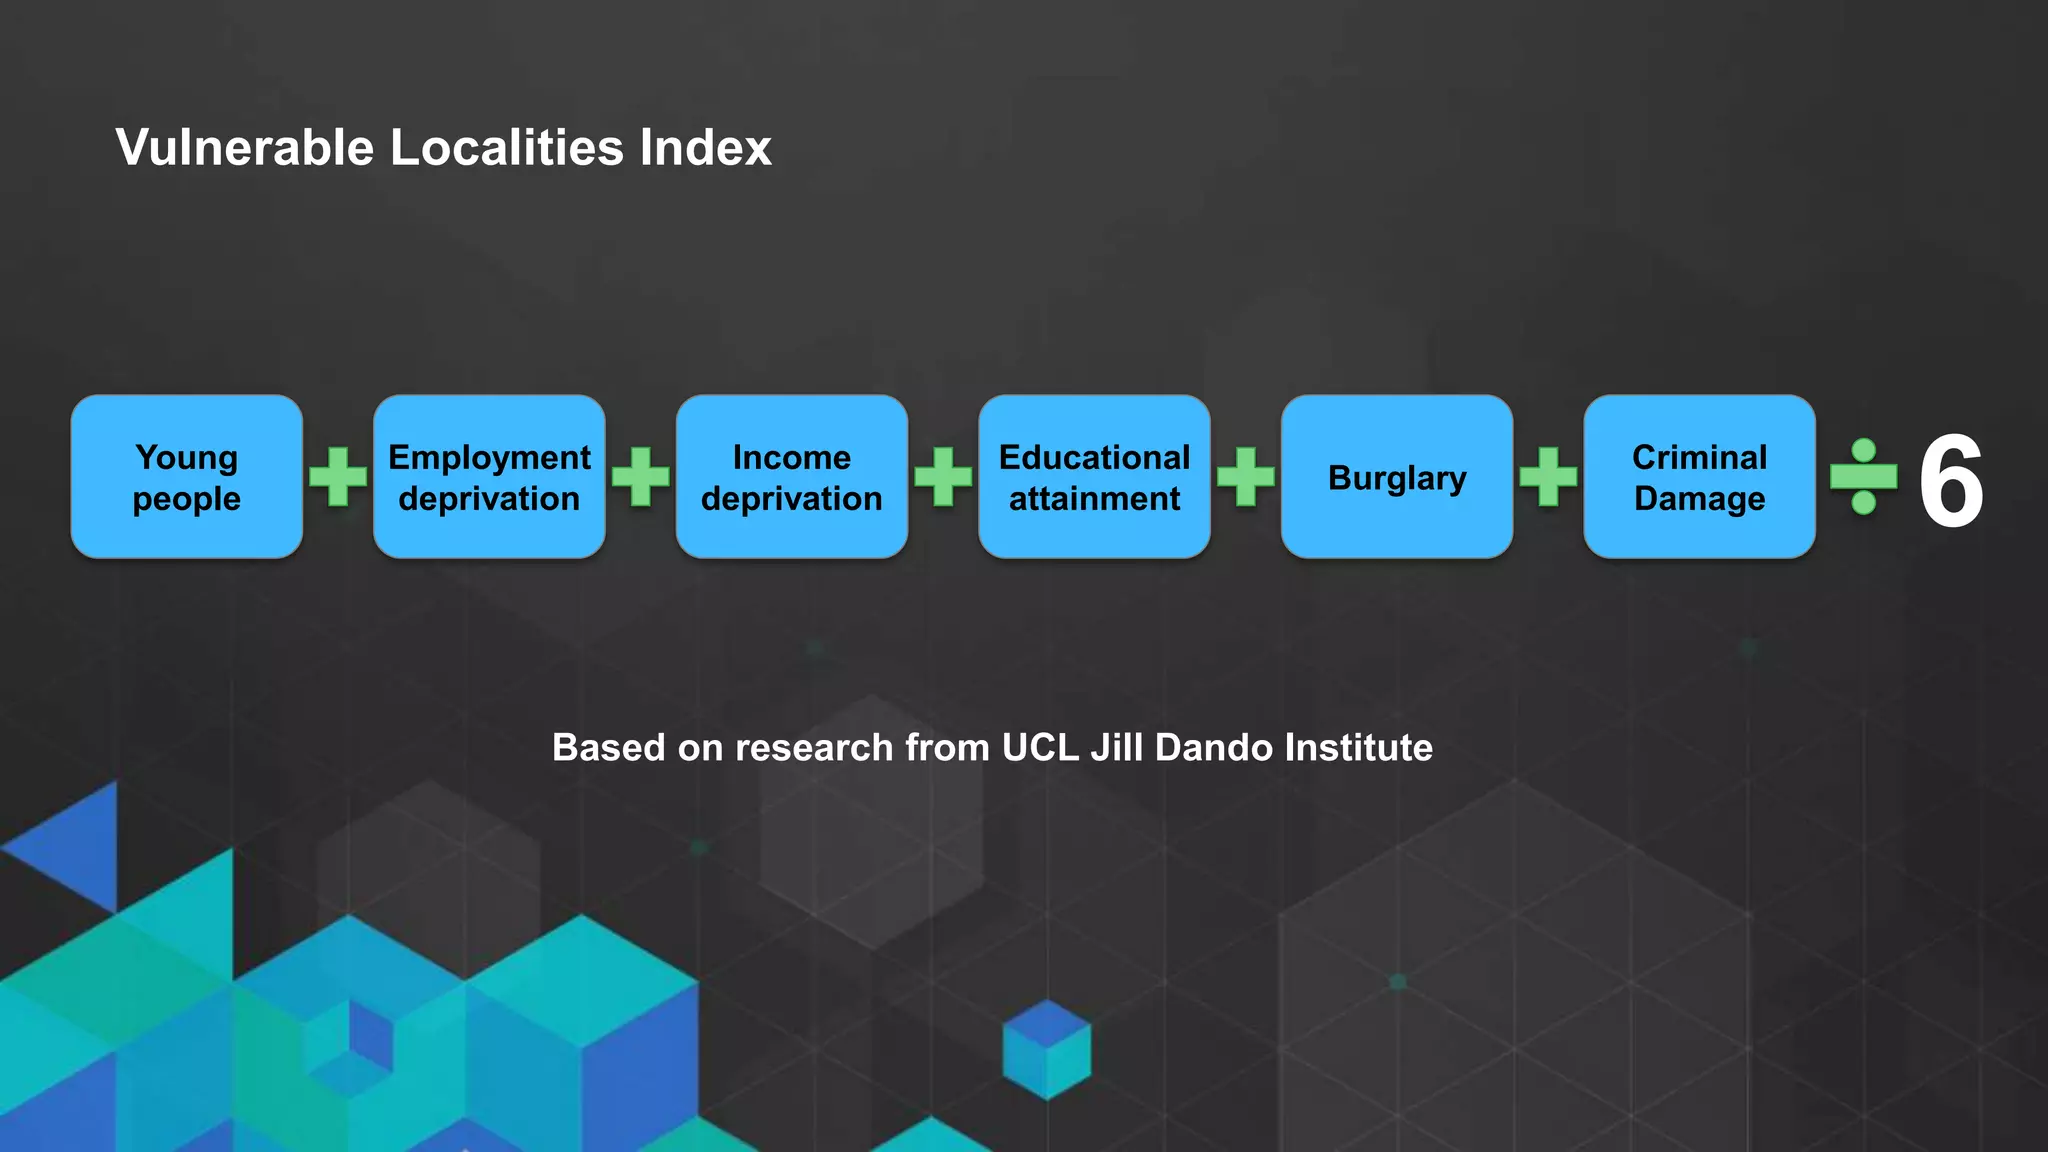
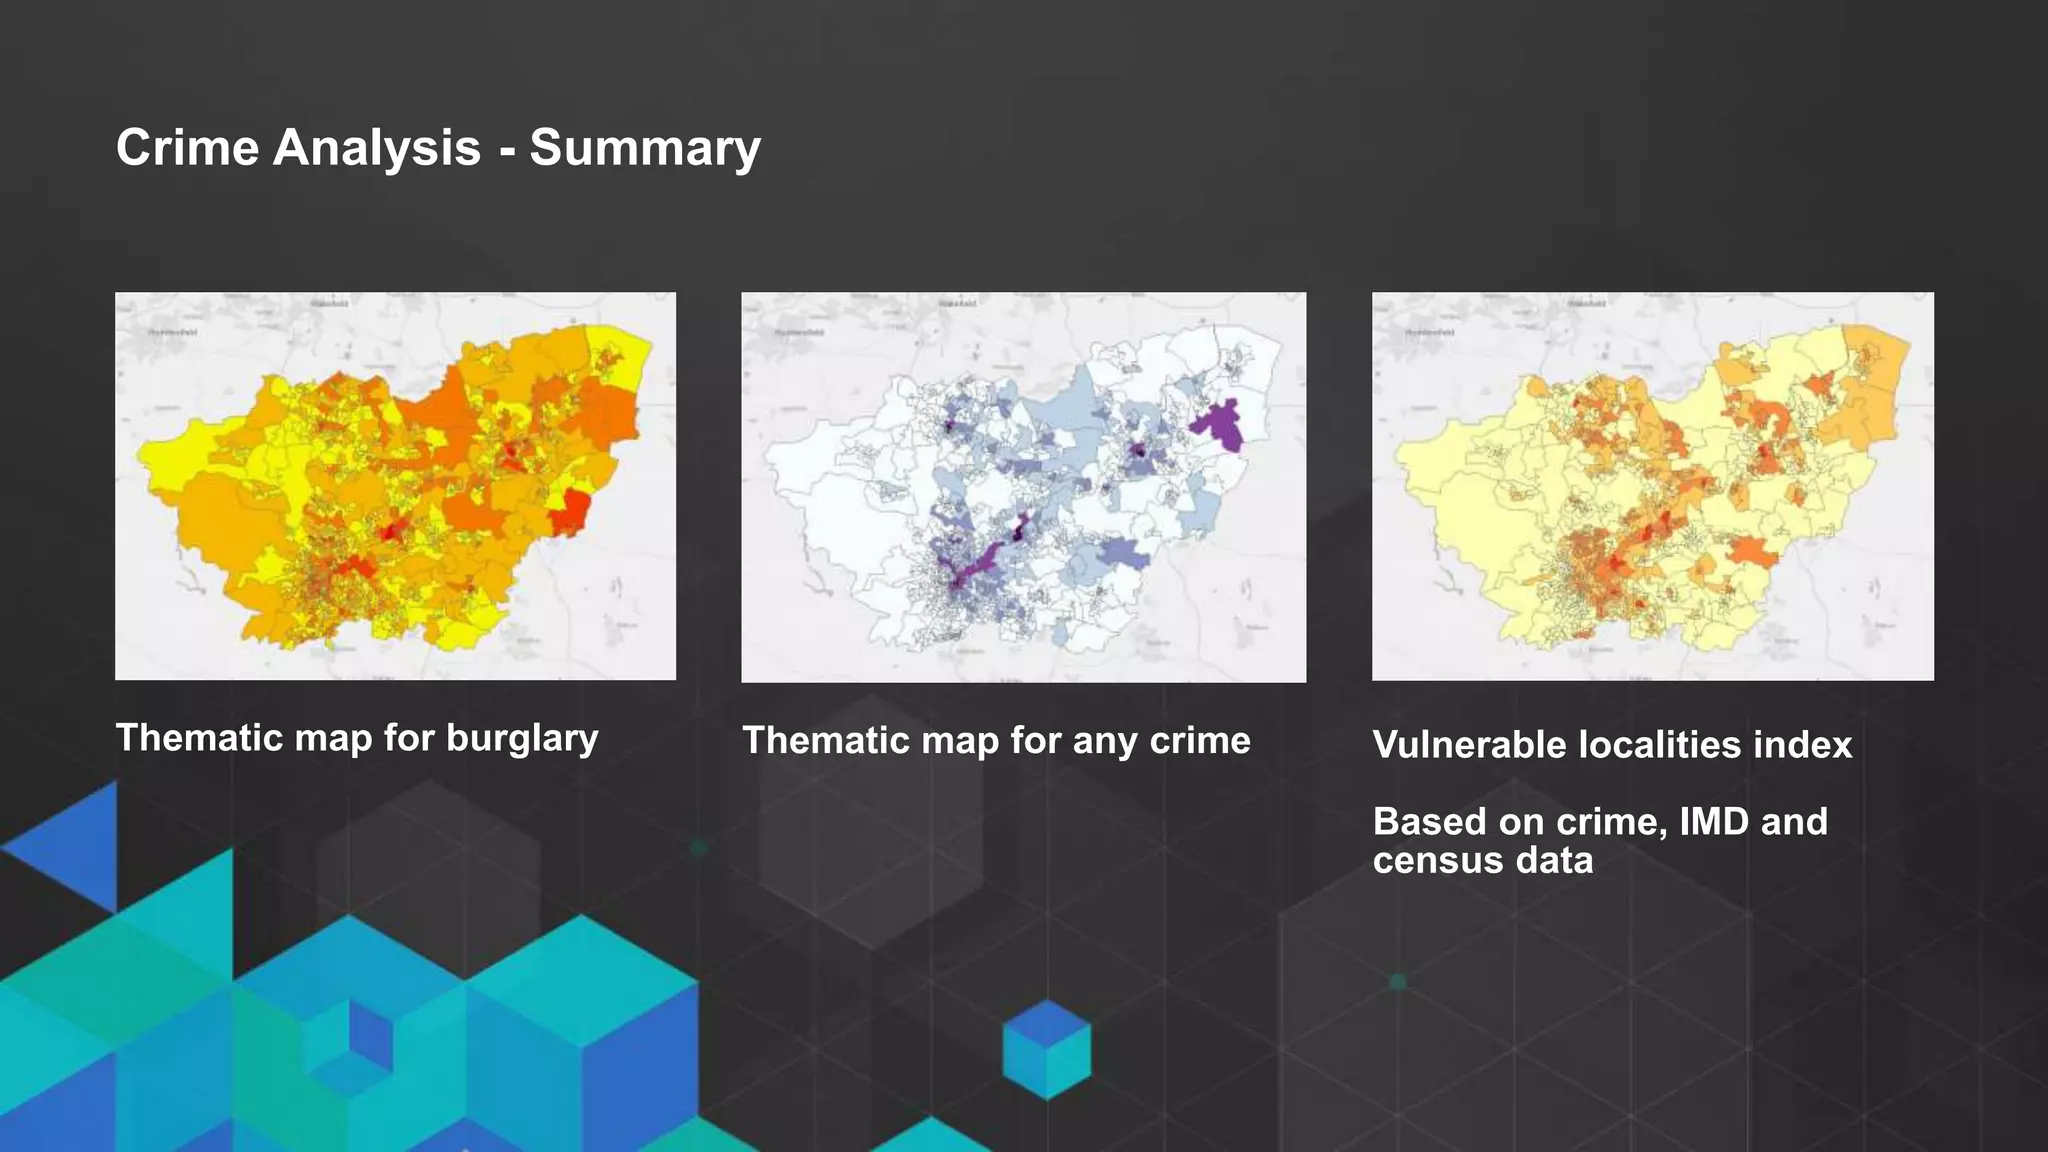


This document provides an overview of crime analysis tools and techniques in ArcGIS Pro including symbology, geoprocessing, model builder, and network analysis. It also summarizes methods for analyzing crime data through statistics, thematic mapping of burglary and other crimes, and a vulnerable localities index based on factors like employment, income, education, and youth populations. Resources for getting started with ArcGIS Pro and geoprocessing are also referenced.