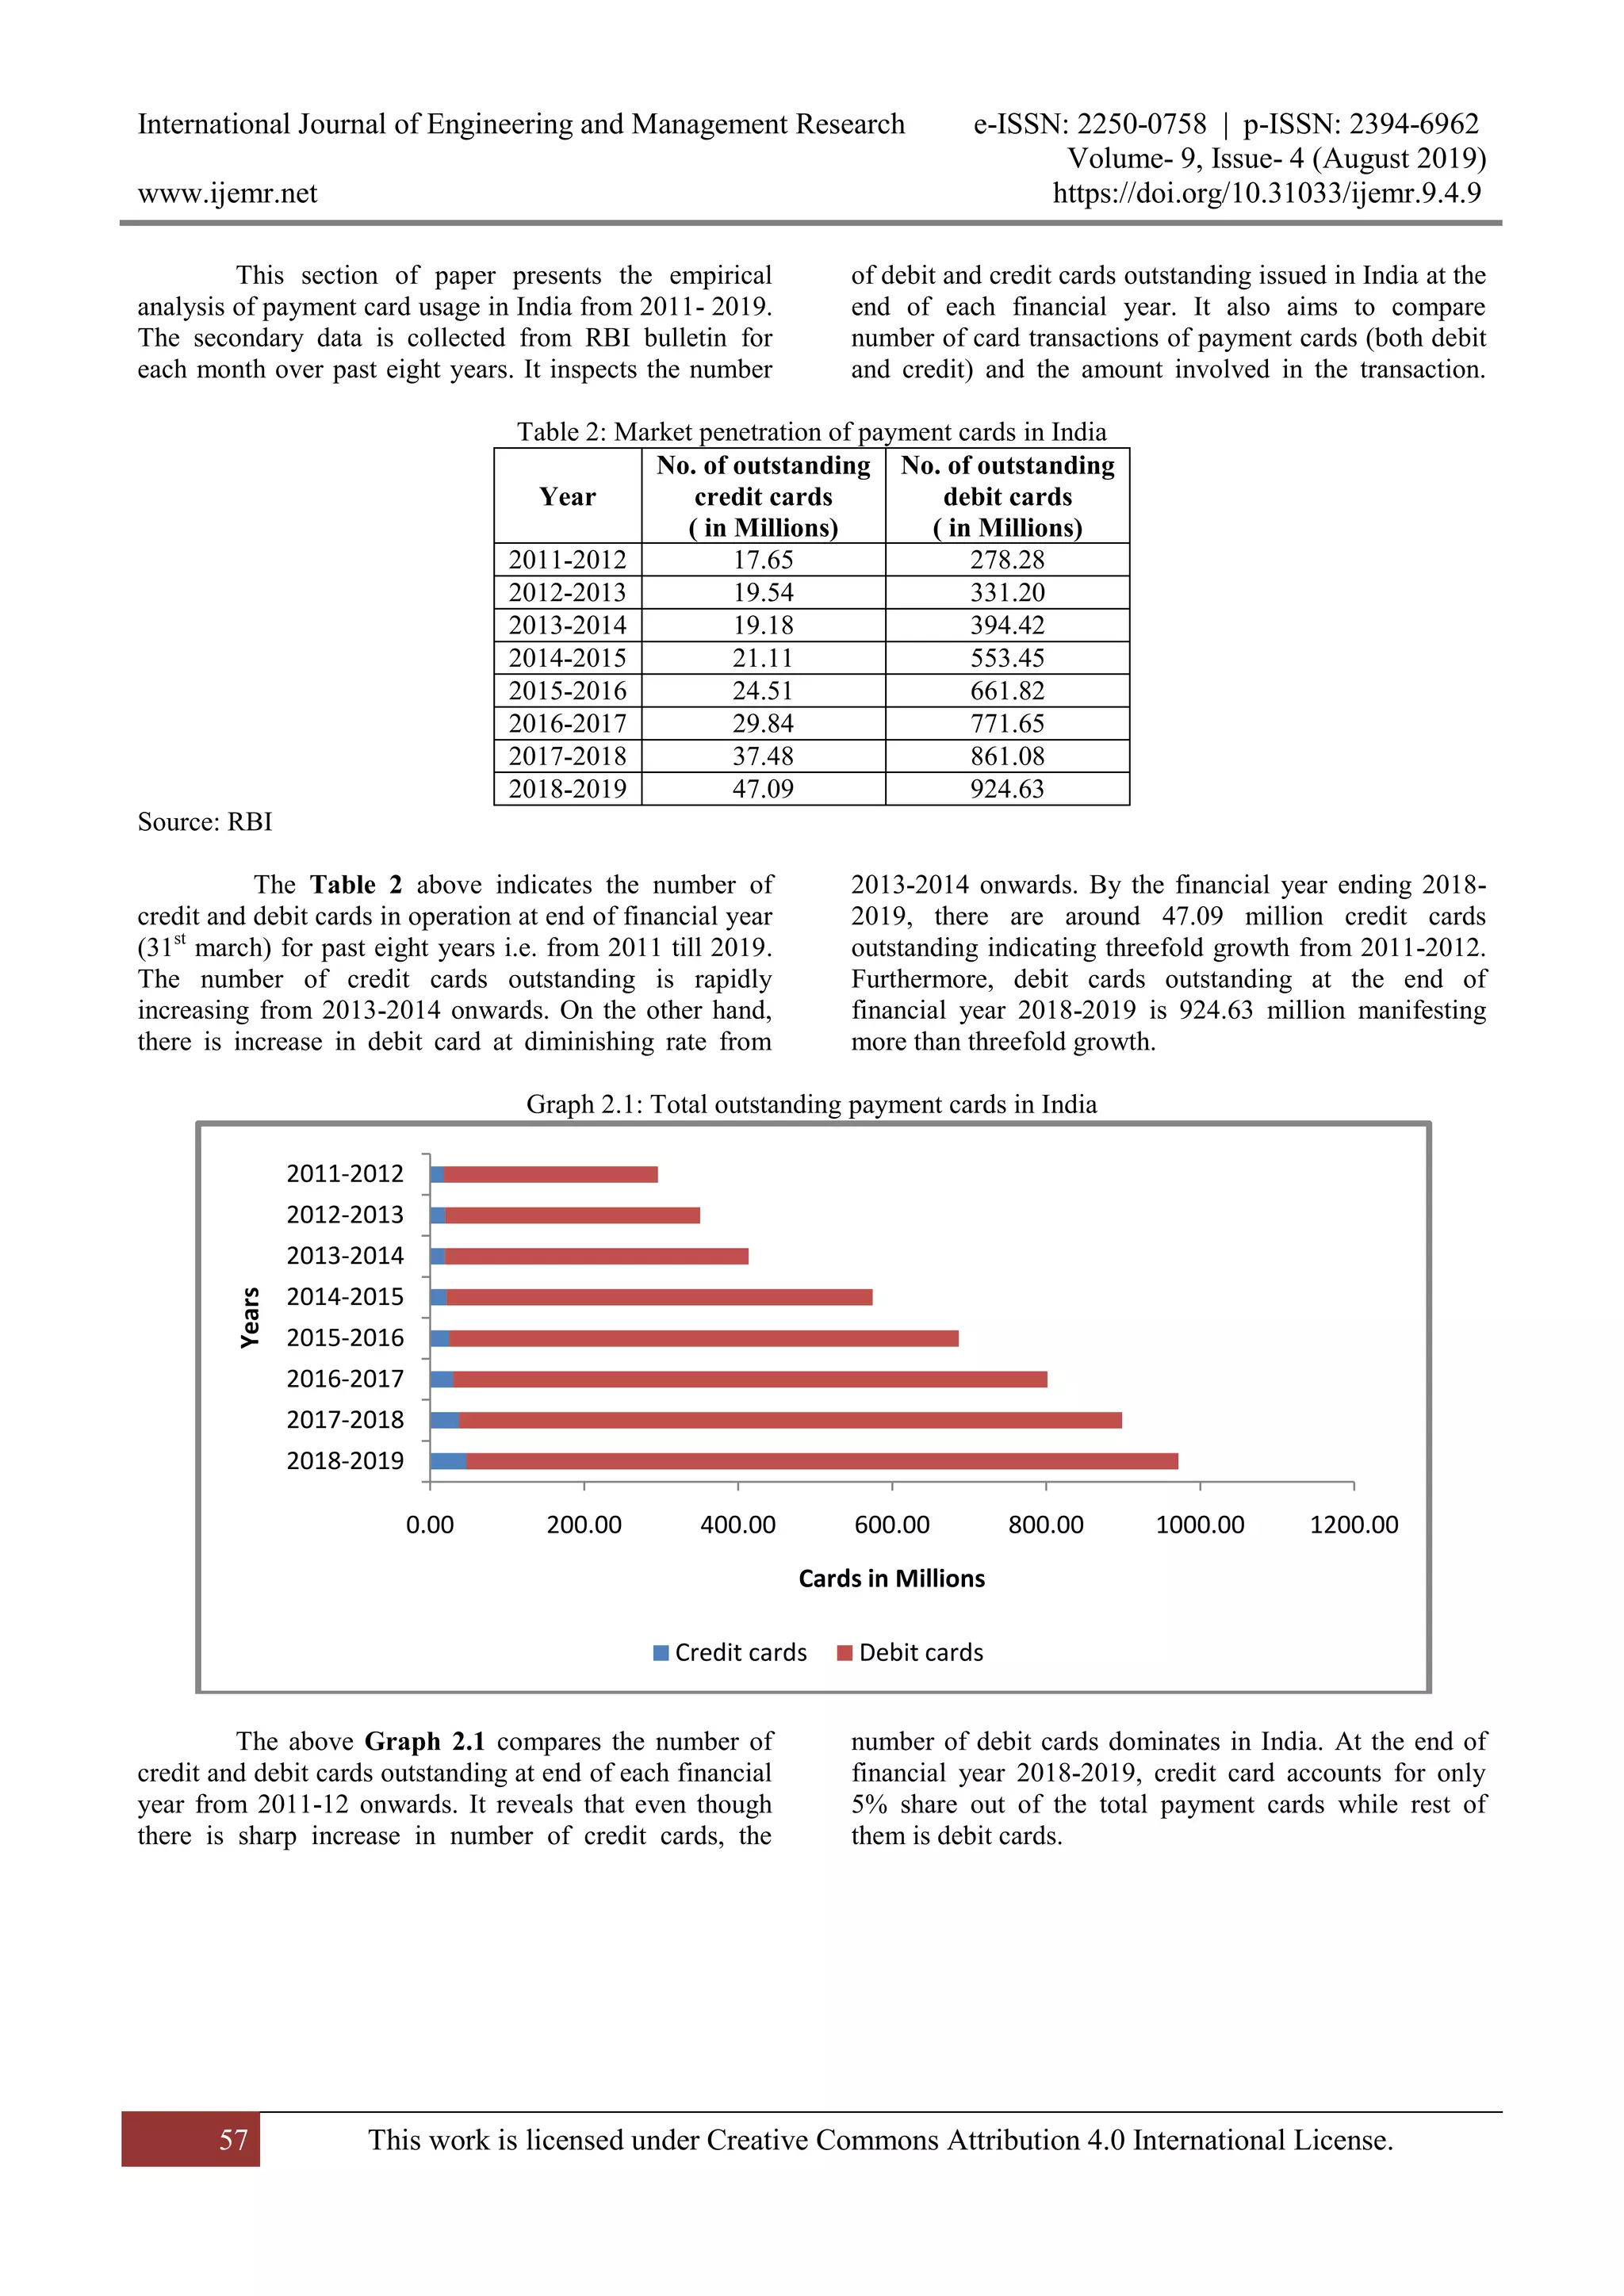
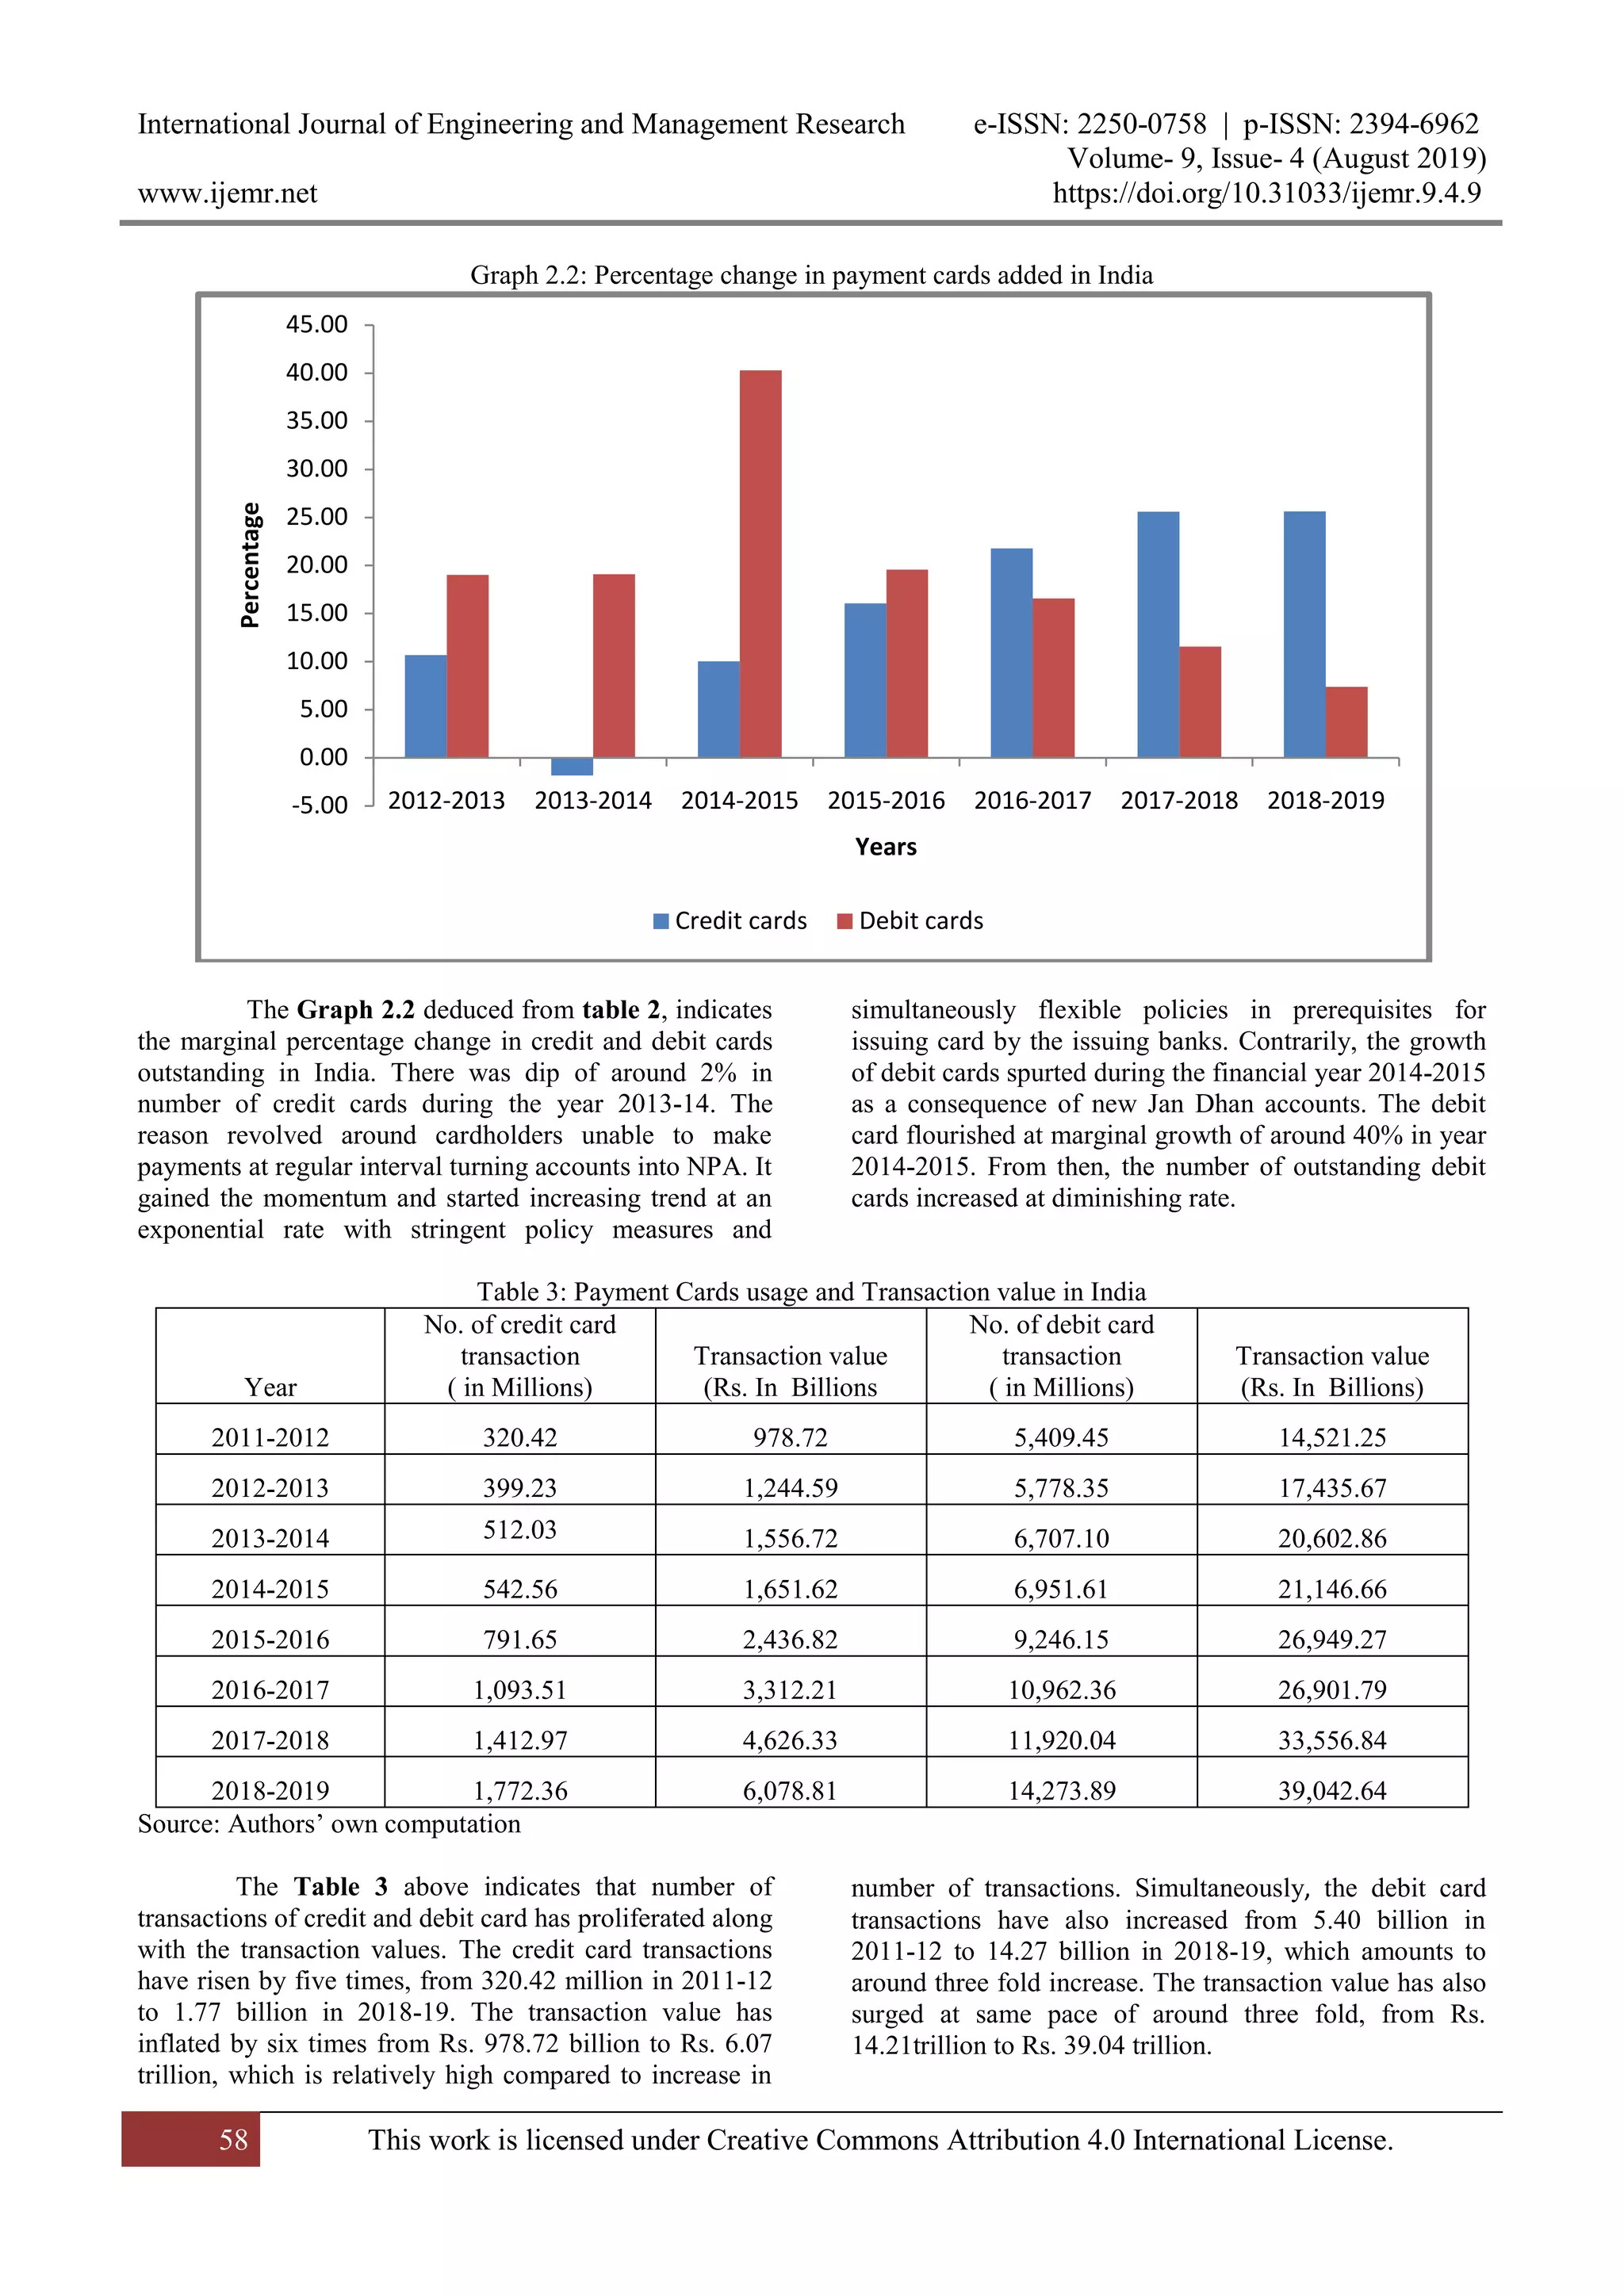
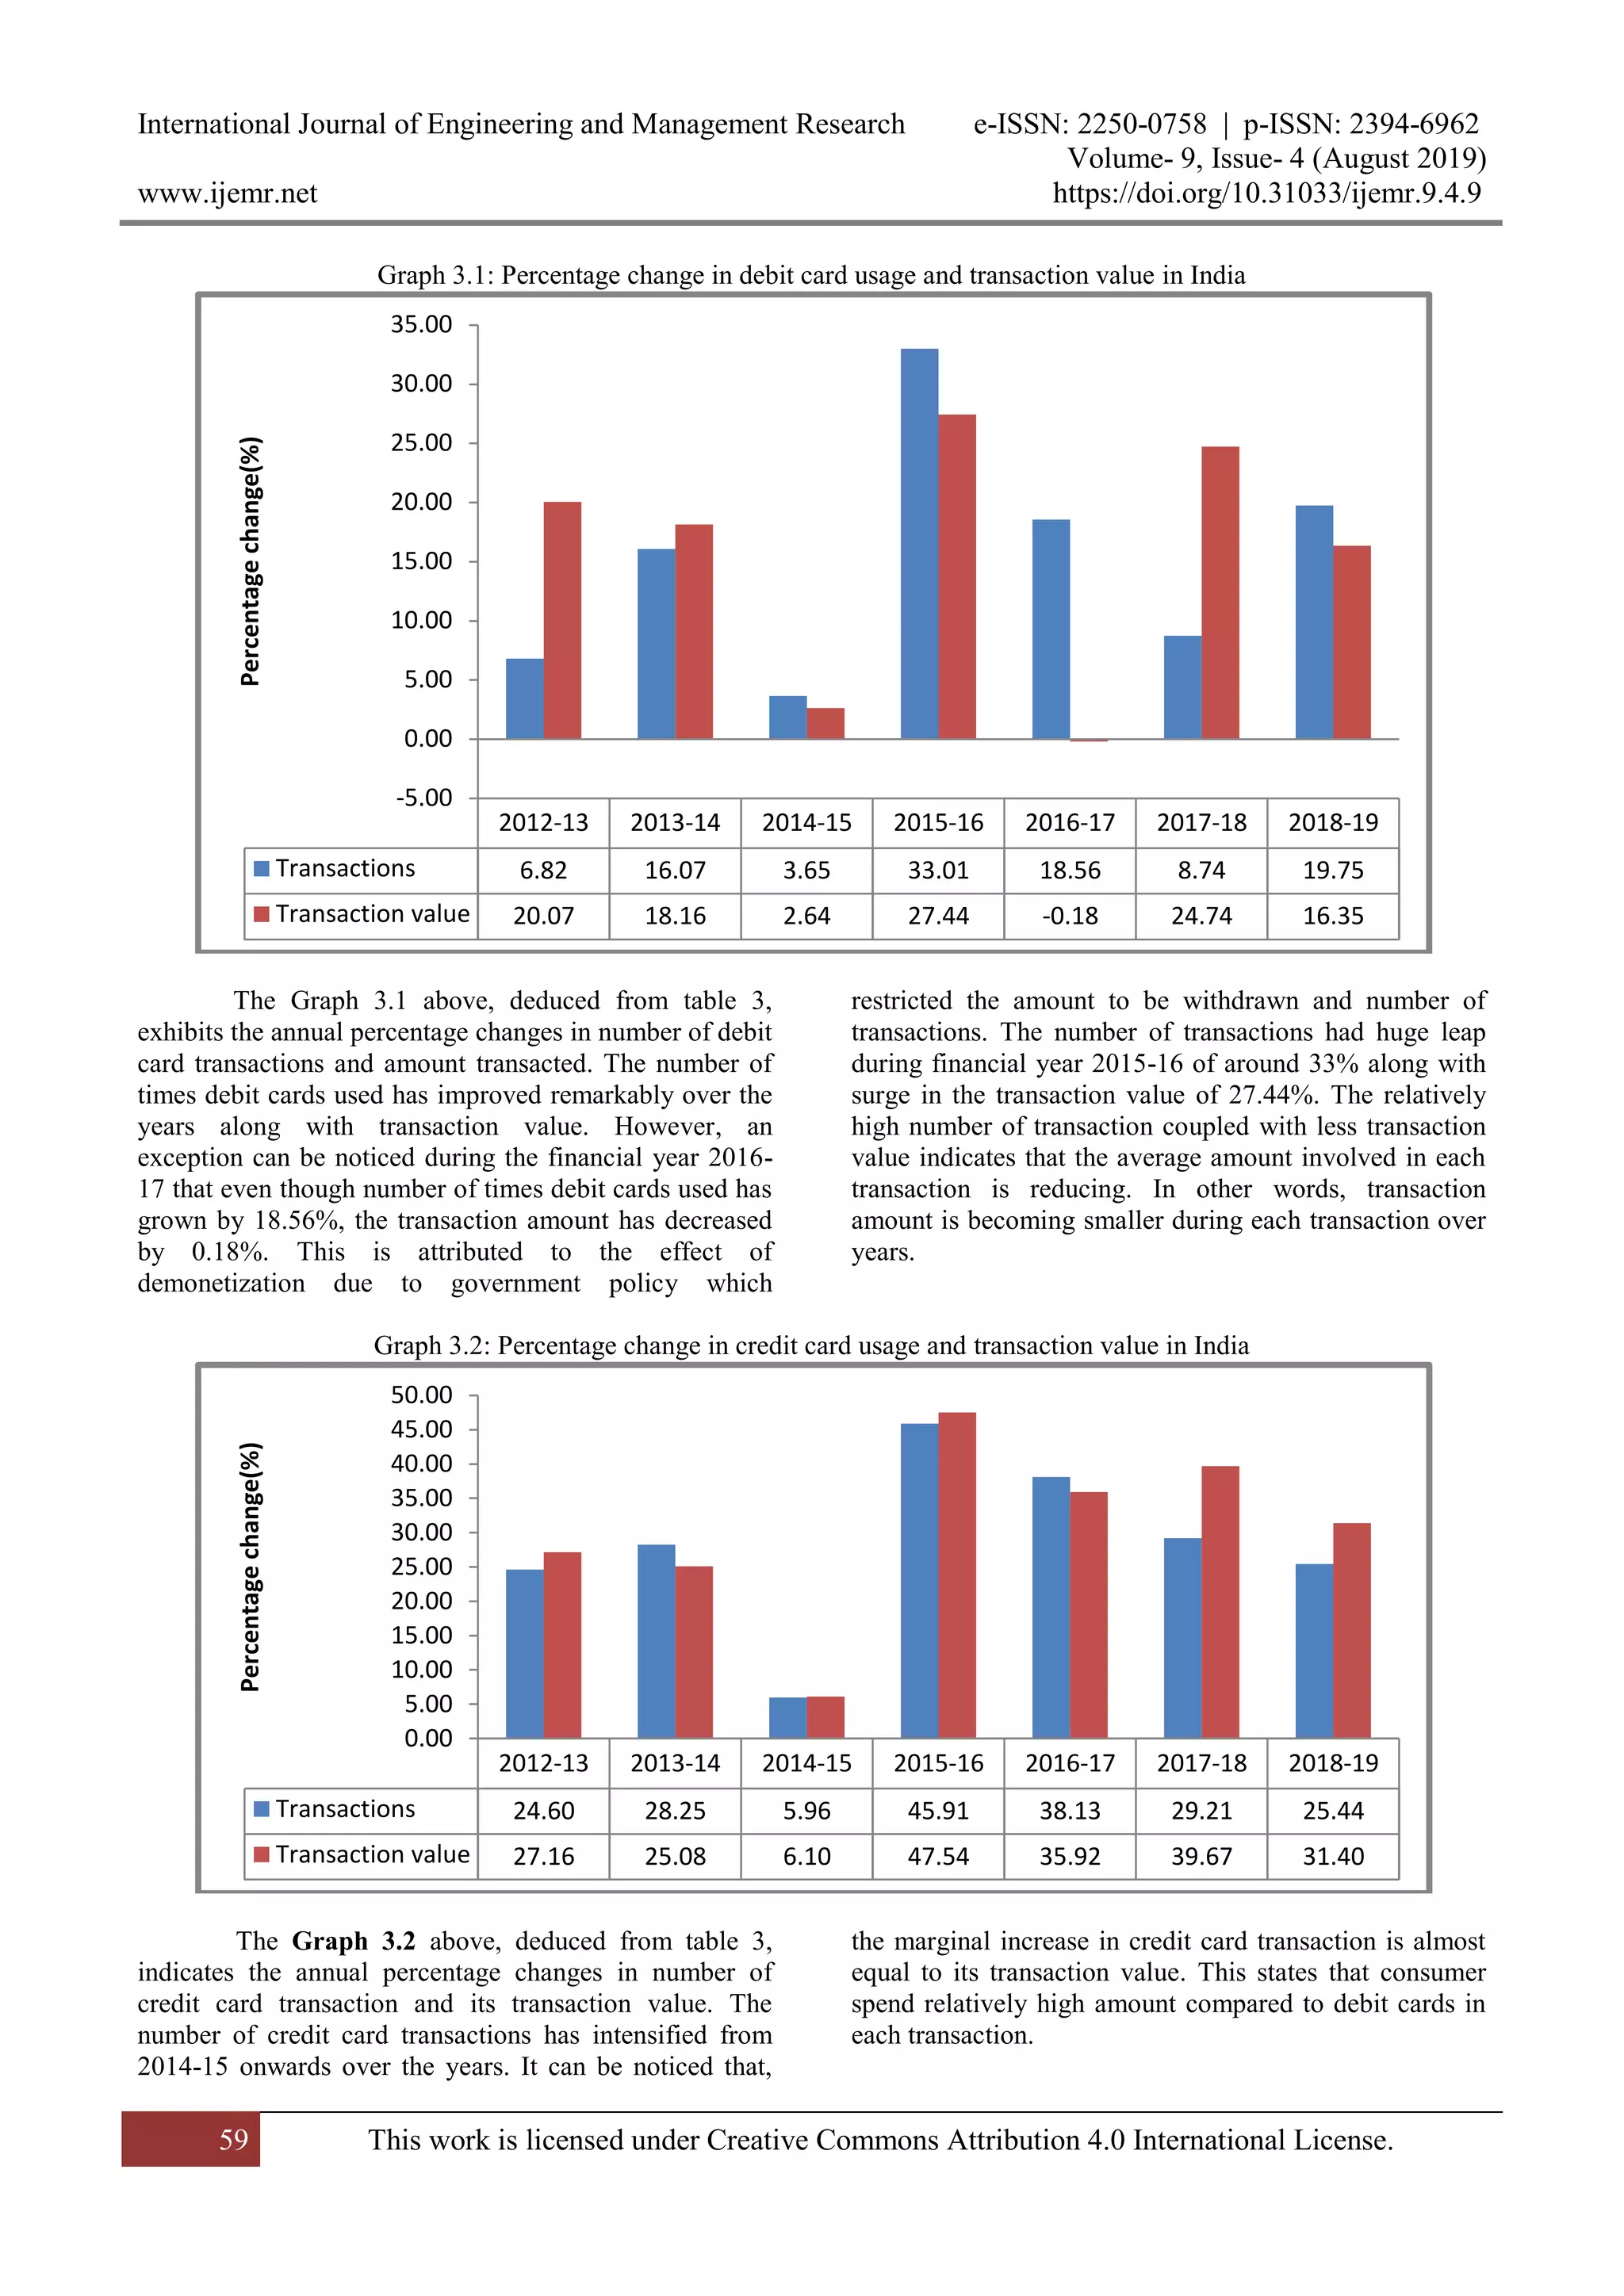
International Journal of Engineering and Management Research e-ISSN: 2250-0758 | p-ISSN: 2394-6962
Volume- 9, Issue- 4 (August 2019)
www.ijemr.net https://doi.org/10.31033/ijemr.9.4.9
54 This work is licensed under Creative Commons Attribution 4.0 International License.
An Empirical Analysis of Payment Card Usage in India
Shilpa N.C.1
and Dr. Amulya M.2
1
Research Scholar (UGC-SRF), B. N. Bahadur Institute of Management Sciences, University of Mysore, Manasagangothri,
Mysore, INDIA
2
Assistant Professor, B.N. Bahadur Institute of Management Sciences, University of Mysore, Manasagangothri, Mysore,
INDIA
1
Corresponding Author: shilpa_nc86@yahoo.co.in
ABSTRACT
A paradigm shift in the modus operandi of
commerce across the globe has been significantly influenced
by the payment card industry with brisk strides in digital
technology. The blooming payment card industry has
escorted the prosperity in economic growth of most of the
countries. Besides, there exists a divergent level in
subsuming card payment by different countries due to
distinct social, economic and cultural background. In India,
excessive use cash payments are due to offbeat business
models and varied distinction in literacy levels. This paper
aims to analyse outstanding payment cards in India by
examining the number of cards in operation and the value of
transaction in the past decade. Data from RBI source is
collected to analyse for a period of eight years (2011-2019).
The research finds that credit card penetration has
increased by threefold with average growth of 15% YoY
and debit cards increased by more than threefold with
average growth of 19% YoY during the period of analysis.
Yet, asymmetry between debit cards holders and credit card
holders exists in India indicating credit card is still niche
product. This provides platform for the payment card
industry to unleash the potential to tap market in India.
Keywords-- Electronic Payments, Payment Cards,
Economic Growth
I. INTRODUCTION
Electronic payments enhance economic
efficiencies by making payments conveniently and
reducing time thus imparting further economic and social
development. In developed countries, there exists high
penetration of payment cards resulting in paperless
transactions. On the other hand, for developing countries,
the benefits will be notable by increasing penetration.
Nevertheless, repercussion will build upon the present
situation of the payments infrastructure, government
regulation, consumer education, and competition within
the Industry. India, which was predominantly a cash
economy, is slowly adopting digital banking. According
to MasterCard Advisors report (2013), 98% of all its
economic transactions are done through cash payments in
India. In recent past, there is rapid expansion in payment
card consumers, thereby slowly moving towards cashless
society.
With the objective to curtail money laundering
and terror financing, Indian government on November 8,
2016 announced demonetization of high value notes.
Significant reforms in economy were expected by
economists, business leaders, professionals, and bankers
across the world. According to NPCI reports, India has
witnessed a four-fold growth in digital transaction from
145.46 million in December 2017 to 620.17 million
transactions worth Rs 1,02,59.48 billion in December
2018. This is the highest number of transactions and
amount recorded since the inception of UPI back in
August 2016. According to Mckinsey’s report of world
payments report (2017), Asia-Pacific region accounts for
nearly three-quarters of global payment transactions. It
forecasts that Asia-Pacific cash-intensive economies
(India and China) will undergo robust growth in digital
transactions.
The digital payments usage across the world was
conducted by Fintech futures considering twenty
developed markets. The study took into consideration
number of debit and credit cards issued per capita, usage
of cashless methods, growth of cashless payments, and
customers availing mobile payment services. The rank
computed based on the above stated metrics is exhibited
in Table 1.
Table 1: Forex Cashless rank for countries
Rank Country
Growth (%)
over past five
years
Cards in issue
(%)
Debit Cards per
Capita
Credit Cards per
Capita
1 Canada 16 26 0.7 2.16
2 Sweden 13 25 0.98 1.04
3 United Kingdom 15 41 1.48 0.88
4 France 14 39 0.65 0.1
International Journal of Engineering and Management Research e-ISSN: 2250-0758 | p-ISSN: 2394-6962
Volume- 9, Issue- 4 (August 2019)
www.ijemr.net https://doi.org/10.31033/ijemr.9.4.9
55 This work is licensed under Creative Commons Attribution 4.0 International License.
5 United States 12 23 0.94 2.9
6 China 100 56 3.28 0.33
7 Australia 10 39 1.75 1.0
8 Germany 10 26 1.25 0.06
9 Japan 12 26 3.3 0.67
10 Russia 22 18 1.35 0.22
Source: Fintech futures report
From the Graph 1 below, it is evident that
China has reported highest growth of 100% in payment
cards in past five years. The country has around 3 debit
cards per person which is in par with Japan. On the other
hand, United States reports highest credit cards of around
3 per person. Also, China has got highest cards in issue
compared to rest of the countries.
Graph 1: Snapshot of top countries with digital payments
The aim of the research is to analyse the
payment card usage trends in India over past eight years.
This paper is organised as follows: Section II presents
literature review; Section III explains the digital
payments available in India. Section IV analyses the
Payment card industry in India, followed by Summary
and conclusion presented in Section V.
II. LITERATURE REVIEW
Literature review has been conducted on various
aspects of payment cards at different periods and different
countries.
Maji et. al. (2019) desired to gain insights into
market share of payment cards, position in market with
respect to card payments, geographic location-wise
business profiling, competitor’s customer segmentation
based on monthly card usage, monthly amount spent and
much more. Hence they came up with framework of
analytical processing which are useful for business. They
suggested storing transactional data and constructed data
warehouse to POS provider is useful for business gain.
Dimitriadis et. al. (2018) scrutinised 321 bank
customers by classifying them into groups based on
discriminant analysis and decision tree models to
discover the inclination of usage of payment means.
Results indicate that, by using discriminant analysis to
classify the customers in a more effective way than the
decision tree method.
Ding and Wright (2017) investigated the price
discrimination among payment service providers in
European countries. They conclude that there is
0
1
2
3
4
5
6
7
8
9
10
0
20
40
60
80
100
120
Cardspercapita
Percentage
Growth (%) over past five years Cards in issue (%)
Debit Cards per Capita Credit Cards per Capita
International Journal of Engineering and Management Research e-ISSN: 2250-0758 | p-ISSN: 2394-6962
Volume- 9, Issue- 4 (August 2019)
www.ijemr.net https://doi.org/10.31033/ijemr.9.4.9
56 This work is licensed under Creative Commons Attribution 4.0 International License.
discrimination in price and fees based on card usage by
provider, besides there is cards bias on fee and rewards
based on type of retailer that the consumers transact with.
This helps in choosing type of card by consumers.
Koulayev et. al. (2016) develops model to
explain adoption and use of payment cards by card
holders in U.S. due to changing patterns of payment
choices. They claim that it is important to understand
these issues from policy aspect.
Arango et. al. (2015) reports that cash
transactions are still high for low value transactions in
Canada. They performed survey from shopping diaries
and deduce the reasons as speed, ease of use and
extensive acceptance among merchants compared to other
alternatives.
Bagnall et. al. (2014) conducted survey on
consumer payment methods at seven countries (Canada,
Australia, Austria, France, Germany, Netherlands and
United States) during different time periods. They found
that there is usage of cash at different levels based on
transaction size, demographics, merchant card acceptance
and point-of sale characteristics.
Kosse and Jansen (2013) inspect payment choice
of Dutch and migrants of Netherlands to Dutch. They
observe the cash payment still dominates in first
generation migrants. The payment behaviour is
influenced by host country habits and transferred between
generations.
Carbo-Valverde and Linares-Zegarra (2011)
evaluates the strategic reward programs by card issuers to
increase the transactions of electronic payment through
cards in Spain. The paper reveals that incentives vary
across merchants and is more effective for debit
cardholders.
Amromin and Chakravorti (2009) argue that there is
expansion in merchant card acceptance and rewards
provided for payment through cards. This has ushered
customers to make electronic payment through payment
cards.
Borzekowski et. al. (2008) concludes that cash
transactions are complemented by debit cards compared
to credit cards in United States. They used open ended
questions and found that convenience is the prime reason
for using debit cards and the probability of using debit
cards elevates with educational qualification and
diminishes with age.
Rysman (2007) conducts empirical analysis on
the payment card industry in U.S. He establishes the fact
that consumers concentrate their spending on a single
payment card and keep unused cards that allow the ability
to use multiple network.
III. DIGITAL PAYMENTS AVAILABLE
IN INDIA
The Digital India Initiative was launched under
the flagship of Government of India in 2015. The mission
is to transform India into a digitally empowered society
and knowledge economy. Following are the different
methods of digital payments available in India.
Banking cards:
It includes debit cards, credit cards, pre-paid
cards and travel cards or international cards.
Unstructured Supplementary Service Data (USSD)
Channel:
This service allows access to mobile banking
services through basic feature mobile phone. There is no
need to have mobile internet data facility for using
USSD-based mobile banking. The customers can avail
the service by dialling *99# Balance Enquiry.
Aadhaar Enabled Payment System (AEPS):
It allows online interoperable financial
transaction at POS (Point of Sale) through the Business
Correspondent (BC)/Bank Mitra of any bank using the
Aadhaar authentication.
Unified Payments Interface (UPI):
It is a system which combines multiple bank
accounts into a single mobile application seamless into
one. Each Bank provides its own UPI App for Android,
Windows and iOS mobile platform(s).
Mobile Wallet:
It is a way to carry cash in digital format. The
card (credit or debit) information can be linked in mobile
device to mobile wallet application or money can be
transferred online to mobile wallet. Payments can be
made through Smartphone and tablet instead of using
your physical plastic card to make purchases.
A Point of Sale (POS):
Also called as point of purchase, is the place
where sales are made and customer completes a
transaction, such as a checkout counter. It can be Physical
POS and mobile POS.
National Electronic Fund Transfer (NEFT):
It is a scheme offered to Customers for
electronically transferring funds from any bank branch to
any individual having an account with any other bank
branch in the country in batches.
Real Time Gross Settlement (RTGS):
It is similar to NEFT of electronically
transferring funds. However, there is gross settlement
where the transaction is settled on an instruction by
instruction basis mostly used for high value transactions.
Electronic Clearing System (ECS):
It is an electronic mode of funds transfer from
one bank account to another used by institutions for
periodic payments.
Immediate Payment Service (IMPS):
It is an instant real-time inter-bank electronic
funds transfer system which offers service through
mobile phones. Hence the service is available 24/7
throughout the year including bank holidays unlike NEFT
or RTGS.
IV. RESULTS AND INTERPRETATION
International Journal of Engineering and Management Research e-ISSN: 2250-0758 | p-ISSN: 2394-6962
Volume- 9, Issue- 4 (August 2019)
www.ijemr.net https://doi.org/10.31033/ijemr.9.4.9
57 This work is licensed under Creative Commons Attribution 4.0 International License.
This section of paper presents the empirical
analysis of payment card usage in India from 2011- 2019.
The secondary data is collected from RBI bulletin for
each month over past eight years. It inspects the number
of debit and credit cards outstanding issued in India at the
end of each financial year. It also aims to compare
number of card transactions of payment cards (both debit
and credit) and the amount involved in the transaction.
Table 2: Market penetration of payment cards in India
Year
No. of outstanding
credit cards
( in Millions)
No. of outstanding
debit cards
( in Millions)
2011-2012 17.65 278.28
2012-2013 19.54 331.20
2013-2014 19.18 394.42
2014-2015 21.11 553.45
2015-2016 24.51 661.82
2016-2017 29.84 771.65
2017-2018 37.48 861.08
2018-2019 47.09 924.63
Source: RBI
The Table 2 above indicates the number of
credit and debit cards in operation at end of financial year
(31st
march) for past eight years i.e. from 2011 till 2019.
The number of credit cards outstanding is rapidly
increasing from 2013-2014 onwards. On the other hand,
there is increase in debit card at diminishing rate from
2013-2014 onwards. By the financial year ending 2018-
2019, there are around 47.09 million credit cards
outstanding indicating threefold growth from 2011-2012.
Furthermore, debit cards outstanding at the end of
financial year 2018-2019 is 924.63 million manifesting
more than threefold growth.
Graph 2.1: Total outstanding payment cards in India
The above Graph 2.1 compares the number of
credit and debit cards outstanding at end of each financial
year from 2011-12 onwards. It reveals that even though
there is sharp increase in number of credit cards, the
number of debit cards dominates in India. At the end of
financial year 2018-2019, credit card accounts for only
5% share out of the total payment cards while rest of
them is debit cards.
0.00 200.00 400.00 600.00 800.00 1000.00 1200.00
2018-2019
2017-2018
2016-2017
2015-2016
2014-2015
2013-2014
2012-2013
2011-2012
Cards in Millions
Years
Credit cards Debit cards
International Journal of Engineering and Management Research e-ISSN: 2250-0758 | p-ISSN: 2394-6962
Volume- 9, Issue- 4 (August 2019)
www.ijemr.net https://doi.org/10.31033/ijemr.9.4.9
58 This work is licensed under Creative Commons Attribution 4.0 International License.
Graph 2.2: Percentage change in payment cards added in India
The Graph 2.2 deduced from table 2, indicates
the marginal percentage change in credit and debit cards
outstanding in India. There was dip of around 2% in
number of credit cards during the year 2013-14. The
reason revolved around cardholders unable to make
payments at regular interval turning accounts into NPA. It
gained the momentum and started increasing trend at an
exponential rate with stringent policy measures and
simultaneously flexible policies in prerequisites for
issuing card by the issuing banks. Contrarily, the growth
of debit cards spurted during the financial year 2014-2015
as a consequence of new Jan Dhan accounts. The debit
card flourished at marginal growth of around 40% in year
2014-2015. From then, the number of outstanding debit
cards increased at diminishing rate.
Table 3: Payment Cards usage and Transaction value in India
Year
No. of credit card
transaction
( in Millions)
Transaction value
(Rs. In Billions
No. of debit card
transaction
( in Millions)
Transaction value
(Rs. In Billions)
2011-2012 320.42 978.72 5,409.45 14,521.25
2012-2013 399.23 1,244.59 5,778.35 17,435.67
2013-2014 512.03 1,556.72 6,707.10 20,602.86
2014-2015 542.56 1,651.62 6,951.61 21,146.66
2015-2016 791.65 2,436.82 9,246.15 26,949.27
2016-2017 1,093.51 3,312.21 10,962.36 26,901.79
2017-2018 1,412.97 4,626.33 11,920.04 33,556.84
2018-2019 1,772.36 6,078.81 14,273.89 39,042.64
Source: Authors’ own computation
The Table 3 above indicates that number of
transactions of credit and debit card has proliferated along
with the transaction values. The credit card transactions
have risen by five times, from 320.42 million in 2011-12
to 1.77 billion in 2018-19. The transaction value has
inflated by six times from Rs. 978.72 billion to Rs. 6.07
trillion, which is relatively high compared to increase in
number of transactions. Simultaneously, the debit card
transactions have also increased from 5.40 billion in
2011-12 to 14.27 billion in 2018-19, which amounts to
around three fold increase. The transaction value has also
surged at same pace of around three fold, from Rs.
14.21trillion to Rs. 39.04 trillion.
-5.00
0.00
5.00
10.00
15.00
20.00
25.00
30.00
35.00
40.00
45.00
2012-2013 2013-2014 2014-2015 2015-2016 2016-2017 2017-2018 2018-2019
Percentage
Years
Credit cards Debit cards
International Journal of Engineering and Management Research e-ISSN: 2250-0758 | p-ISSN: 2394-6962
Volume- 9, Issue- 4 (August 2019)
www.ijemr.net https://doi.org/10.31033/ijemr.9.4.9
59 This work is licensed under Creative Commons Attribution 4.0 International License.
Graph 3.1: Percentage change in debit card usage and transaction value in India
The Graph 3.1 above, deduced from table 3,
exhibits the annual percentage changes in number of debit
card transactions and amount transacted. The number of
times debit cards used has improved remarkably over the
years along with transaction value. However, an
exception can be noticed during the financial year 2016-
17 that even though number of times debit cards used has
grown by 18.56%, the transaction amount has decreased
by 0.18%. This is attributed to the effect of
demonetization due to government policy which
restricted the amount to be withdrawn and number of
transactions. The number of transactions had huge leap
during financial year 2015-16 of around 33% along with
surge in the transaction value of 27.44%. The relatively
high number of transaction coupled with less transaction
value indicates that the average amount involved in each
transaction is reducing. In other words, transaction
amount is becoming smaller during each transaction over
years.
Graph 3.2: Percentage change in credit card usage and transaction value in India
The Graph 3.2 above, deduced from table 3,
indicates the annual percentage changes in number of
credit card transaction and its transaction value. The
number of credit card transactions has intensified from
2014-15 onwards over the years. It can be noticed that,
the marginal increase in credit card transaction is almost
equal to its transaction value. This states that consumer
spend relatively high amount compared to debit cards in
each transaction.
2012-13 2013-14 2014-15 2015-16 2016-17 2017-18 2018-19
Transactions 6.82 16.07 3.65 33.01 18.56 8.74 19.75
Transaction value 20.07 18.16 2.64 27.44 -0.18 24.74 16.35
-5.00
0.00
5.00
10.00
15.00
20.00
25.00
30.00
35.00
Percentagechange(%)
2012-13 2013-14 2014-15 2015-16 2016-17 2017-18 2018-19
Transactions 24.60 28.25 5.96 45.91 38.13 29.21 25.44
Transaction value 27.16 25.08 6.10 47.54 35.92 39.67 31.40
0.00
5.00
10.00
15.00
20.00
25.00
30.00
35.00
40.00
45.00
50.00
Percentagechange(%)
International Journal of Engineering and Management Research e-ISSN: 2250-0758 | p-ISSN: 2394-6962
Volume- 9, Issue- 4 (August 2019)
www.ijemr.net https://doi.org/10.31033/ijemr.9.4.9
60 This work is licensed under Creative Commons Attribution 4.0 International License.
V. SUMMARY AND CONCLUSION
The study is aimed to analyse the trends of
payment card usage in India. The data was collected from
RBI website for period of eight years from 2011 to 2019.
By the financial year ending 2018-2019, there are around
47.09 million credit cards outstanding indicating
threefold growth and debit cards outstanding is 924.63
million manifesting more than threefold growth.
The number of outstanding credit cards is
expanding every year with liberal expansion of credit
limits and prerequisites by bank and stringent measures
by Government. CIBIL, a credit information company
operating in India, provides CIBIL score which is easily
accessible by citizens and credit card issuing institutions.
From the analysis it is evident that there are around 95%
debit cards holders and only 5% credit card holders in
India indicating it is still niche product.
Looking at the report, cardholders (credit and
debit card), transactions, and transaction value have
increased tremendously. The total transaction amount in
debit cards in 2018-19 is consolidated to Rs. 39.04 trillion
and credit cards are consolidated to Rs. 6.07 trillion. The
magnification of debit cards shot up by 40% in the year
2014-15 because of policy implication. The Government
of India undertook national mission of financial inclusion
by opening Jan Dhan accounts and issuing debit cards.
There was dip in transaction value to 0.18% in year 2016-
17, besides remarkable increase in number of operating
debit cards to 18.56%. This was the effect of policy of
restricting amount to be withdrawn and number of
transactions due to demonetization.
The Government of India reported the key
achievement of demonetisation as lower cash-to-GDP
ratio. The cash to GDP ratio is the ratio between the
public debts incurred by the government to its gross
domestic product. The ratio reduced from 12% to 8% due
to reduction of currency circulation to the extent of Rs
3.89 lakhs crore as claimed by Government of India.
According to Nasscom report, still less than 30% of
population in India are unbanked, and hence growth
opportunity is very high. Finally, the question boils down
whether to have cashless economy or less cash economy.
REFERENCES
[1] Agarwal, S., Chakravorti, S., & Lunn, A. (2010). Why
do banks reward their customers to use their credit
cards?. Available at:
https://www.aeaweb.org/conference/2011/retrieve.php?pd
fid=280.
[2] Amromin, G., & Chakravorti, S. (2009). Whither
loose change? The diminishing demand for small-
denomination currency. Journal of Money, Credit and
Banking, 41(2–3), 315–335.
[3] Arango, C. A., Hogg, D., & Lee, A. (2015). Why is
cash (still) so entrenched? Insights from Canadian
shopping diaries. Contemporary Economic Policy, 33(1),
141–158.
[4] Bagnall, J., Bounie, D., Huynh, K. P., Kosse, A.,
Schmidt, T., Schuh, S. D., & Stix, H. (2014). Consumer
cash usage: A cross-country comparison with payment
diary survey data. Available at:
https://www.ecb.europa.eu/pub/pdf/scpwps/ecbwp1685.p
df.
[5] Borzekowski, R., Elizabeth, K. K., & Shaista, A.
(2008). Consumers’ use of debit cards: Patterns,
preferences, and price response. Journal of Money, Credit
and Banking, 40(1), 149–172.
[6] Carbó-Valverde, S. & Liñares-Zegarra, J. M. (2011).
How effective are rewards programs in promoting
payment card usage? Empirical evidence. Journal of
Banking & Finance, 35(12), 3275–3291.
[7] Chase, M. A. (1991). The credit card industry: A
history. Available at:
https://www.jstor.org/stable/23859431?seq=1#page_scan
_tab_contents.
[8] Dimitriadis, S., Kyrezis, N., & Chalaris, M. (2018). A
comparison of two multivariate analysis methods for
segmenting users of alternative payment means.
International Journal of Bank Marketing, 36(2), 322-335.
[9] Ding, R. & Wright, J. (2017). Payment card
interchange fees and price discrimination. The Journal of
Industrial Economics, 65(1), 39-72.
[10] Evans, D. S. & Schmalensee, R. (2005). Paying with
plastic: The digital revolution in buying and borrowing.
UK: Mit Press.
[11] Kosse, A. & Jansen, D.-J. (2013). Choosing how to
pay: The influence of foreign backgrounds. Journal of
Banking & Finance, 37(3), 989–998.
[12] Koulayev, S., Rysman, M., Schuh, S., & Stavins, J.
(2016). Explaining adoption and use of payment
instruments by US consumers. The RAND Journal of
Economics, 47(2), 293–325.
[13] Maji, G. Dutta, L., & Sen, S. (2019).Targeted
marketing and market share analysis on POS payment
data using DW and OLAP. Emerging Technologies in
Data Mining and Information Security, Springer. DOI:
10.1007/978-981-13-1498-8_17
[14] Rysman, M. (2007). An empirical analysis of
payment card usage. The Journal of Industrial
Economics, 55(1), 1–36.

An Empirical Analysis of Payment Card Usage in India

  • 1.
    International Journal ofEngineering and Management Research e-ISSN: 2250-0758 | p-ISSN: 2394-6962 Volume- 9, Issue- 4 (August 2019) www.ijemr.net https://doi.org/10.31033/ijemr.9.4.9 54 This work is licensed under Creative Commons Attribution 4.0 International License. An Empirical Analysis of Payment Card Usage in India Shilpa N.C.1 and Dr. Amulya M.2 1 Research Scholar (UGC-SRF), B. N. Bahadur Institute of Management Sciences, University of Mysore, Manasagangothri, Mysore, INDIA 2 Assistant Professor, B.N. Bahadur Institute of Management Sciences, University of Mysore, Manasagangothri, Mysore, INDIA 1 Corresponding Author: shilpa_nc86@yahoo.co.in ABSTRACT A paradigm shift in the modus operandi of commerce across the globe has been significantly influenced by the payment card industry with brisk strides in digital technology. The blooming payment card industry has escorted the prosperity in economic growth of most of the countries. Besides, there exists a divergent level in subsuming card payment by different countries due to distinct social, economic and cultural background. In India, excessive use cash payments are due to offbeat business models and varied distinction in literacy levels. This paper aims to analyse outstanding payment cards in India by examining the number of cards in operation and the value of transaction in the past decade. Data from RBI source is collected to analyse for a period of eight years (2011-2019). The research finds that credit card penetration has increased by threefold with average growth of 15% YoY and debit cards increased by more than threefold with average growth of 19% YoY during the period of analysis. Yet, asymmetry between debit cards holders and credit card holders exists in India indicating credit card is still niche product. This provides platform for the payment card industry to unleash the potential to tap market in India. Keywords-- Electronic Payments, Payment Cards, Economic Growth I. INTRODUCTION Electronic payments enhance economic efficiencies by making payments conveniently and reducing time thus imparting further economic and social development. In developed countries, there exists high penetration of payment cards resulting in paperless transactions. On the other hand, for developing countries, the benefits will be notable by increasing penetration. Nevertheless, repercussion will build upon the present situation of the payments infrastructure, government regulation, consumer education, and competition within the Industry. India, which was predominantly a cash economy, is slowly adopting digital banking. According to MasterCard Advisors report (2013), 98% of all its economic transactions are done through cash payments in India. In recent past, there is rapid expansion in payment card consumers, thereby slowly moving towards cashless society. With the objective to curtail money laundering and terror financing, Indian government on November 8, 2016 announced demonetization of high value notes. Significant reforms in economy were expected by economists, business leaders, professionals, and bankers across the world. According to NPCI reports, India has witnessed a four-fold growth in digital transaction from 145.46 million in December 2017 to 620.17 million transactions worth Rs 1,02,59.48 billion in December 2018. This is the highest number of transactions and amount recorded since the inception of UPI back in August 2016. According to Mckinsey’s report of world payments report (2017), Asia-Pacific region accounts for nearly three-quarters of global payment transactions. It forecasts that Asia-Pacific cash-intensive economies (India and China) will undergo robust growth in digital transactions. The digital payments usage across the world was conducted by Fintech futures considering twenty developed markets. The study took into consideration number of debit and credit cards issued per capita, usage of cashless methods, growth of cashless payments, and customers availing mobile payment services. The rank computed based on the above stated metrics is exhibited in Table 1. Table 1: Forex Cashless rank for countries Rank Country Growth (%) over past five years Cards in issue (%) Debit Cards per Capita Credit Cards per Capita 1 Canada 16 26 0.7 2.16 2 Sweden 13 25 0.98 1.04 3 United Kingdom 15 41 1.48 0.88 4 France 14 39 0.65 0.1
  • 2.
    International Journal ofEngineering and Management Research e-ISSN: 2250-0758 | p-ISSN: 2394-6962 Volume- 9, Issue- 4 (August 2019) www.ijemr.net https://doi.org/10.31033/ijemr.9.4.9 55 This work is licensed under Creative Commons Attribution 4.0 International License. 5 United States 12 23 0.94 2.9 6 China 100 56 3.28 0.33 7 Australia 10 39 1.75 1.0 8 Germany 10 26 1.25 0.06 9 Japan 12 26 3.3 0.67 10 Russia 22 18 1.35 0.22 Source: Fintech futures report From the Graph 1 below, it is evident that China has reported highest growth of 100% in payment cards in past five years. The country has around 3 debit cards per person which is in par with Japan. On the other hand, United States reports highest credit cards of around 3 per person. Also, China has got highest cards in issue compared to rest of the countries. Graph 1: Snapshot of top countries with digital payments The aim of the research is to analyse the payment card usage trends in India over past eight years. This paper is organised as follows: Section II presents literature review; Section III explains the digital payments available in India. Section IV analyses the Payment card industry in India, followed by Summary and conclusion presented in Section V. II. LITERATURE REVIEW Literature review has been conducted on various aspects of payment cards at different periods and different countries. Maji et. al. (2019) desired to gain insights into market share of payment cards, position in market with respect to card payments, geographic location-wise business profiling, competitor’s customer segmentation based on monthly card usage, monthly amount spent and much more. Hence they came up with framework of analytical processing which are useful for business. They suggested storing transactional data and constructed data warehouse to POS provider is useful for business gain. Dimitriadis et. al. (2018) scrutinised 321 bank customers by classifying them into groups based on discriminant analysis and decision tree models to discover the inclination of usage of payment means. Results indicate that, by using discriminant analysis to classify the customers in a more effective way than the decision tree method. Ding and Wright (2017) investigated the price discrimination among payment service providers in European countries. They conclude that there is 0 1 2 3 4 5 6 7 8 9 10 0 20 40 60 80 100 120 Cardspercapita Percentage Growth (%) over past five years Cards in issue (%) Debit Cards per Capita Credit Cards per Capita
  • 3.
    International Journal ofEngineering and Management Research e-ISSN: 2250-0758 | p-ISSN: 2394-6962 Volume- 9, Issue- 4 (August 2019) www.ijemr.net https://doi.org/10.31033/ijemr.9.4.9 56 This work is licensed under Creative Commons Attribution 4.0 International License. discrimination in price and fees based on card usage by provider, besides there is cards bias on fee and rewards based on type of retailer that the consumers transact with. This helps in choosing type of card by consumers. Koulayev et. al. (2016) develops model to explain adoption and use of payment cards by card holders in U.S. due to changing patterns of payment choices. They claim that it is important to understand these issues from policy aspect. Arango et. al. (2015) reports that cash transactions are still high for low value transactions in Canada. They performed survey from shopping diaries and deduce the reasons as speed, ease of use and extensive acceptance among merchants compared to other alternatives. Bagnall et. al. (2014) conducted survey on consumer payment methods at seven countries (Canada, Australia, Austria, France, Germany, Netherlands and United States) during different time periods. They found that there is usage of cash at different levels based on transaction size, demographics, merchant card acceptance and point-of sale characteristics. Kosse and Jansen (2013) inspect payment choice of Dutch and migrants of Netherlands to Dutch. They observe the cash payment still dominates in first generation migrants. The payment behaviour is influenced by host country habits and transferred between generations. Carbo-Valverde and Linares-Zegarra (2011) evaluates the strategic reward programs by card issuers to increase the transactions of electronic payment through cards in Spain. The paper reveals that incentives vary across merchants and is more effective for debit cardholders. Amromin and Chakravorti (2009) argue that there is expansion in merchant card acceptance and rewards provided for payment through cards. This has ushered customers to make electronic payment through payment cards. Borzekowski et. al. (2008) concludes that cash transactions are complemented by debit cards compared to credit cards in United States. They used open ended questions and found that convenience is the prime reason for using debit cards and the probability of using debit cards elevates with educational qualification and diminishes with age. Rysman (2007) conducts empirical analysis on the payment card industry in U.S. He establishes the fact that consumers concentrate their spending on a single payment card and keep unused cards that allow the ability to use multiple network. III. DIGITAL PAYMENTS AVAILABLE IN INDIA The Digital India Initiative was launched under the flagship of Government of India in 2015. The mission is to transform India into a digitally empowered society and knowledge economy. Following are the different methods of digital payments available in India. Banking cards: It includes debit cards, credit cards, pre-paid cards and travel cards or international cards. Unstructured Supplementary Service Data (USSD) Channel: This service allows access to mobile banking services through basic feature mobile phone. There is no need to have mobile internet data facility for using USSD-based mobile banking. The customers can avail the service by dialling *99# Balance Enquiry. Aadhaar Enabled Payment System (AEPS): It allows online interoperable financial transaction at POS (Point of Sale) through the Business Correspondent (BC)/Bank Mitra of any bank using the Aadhaar authentication. Unified Payments Interface (UPI): It is a system which combines multiple bank accounts into a single mobile application seamless into one. Each Bank provides its own UPI App for Android, Windows and iOS mobile platform(s). Mobile Wallet: It is a way to carry cash in digital format. The card (credit or debit) information can be linked in mobile device to mobile wallet application or money can be transferred online to mobile wallet. Payments can be made through Smartphone and tablet instead of using your physical plastic card to make purchases. A Point of Sale (POS): Also called as point of purchase, is the place where sales are made and customer completes a transaction, such as a checkout counter. It can be Physical POS and mobile POS. National Electronic Fund Transfer (NEFT): It is a scheme offered to Customers for electronically transferring funds from any bank branch to any individual having an account with any other bank branch in the country in batches. Real Time Gross Settlement (RTGS): It is similar to NEFT of electronically transferring funds. However, there is gross settlement where the transaction is settled on an instruction by instruction basis mostly used for high value transactions. Electronic Clearing System (ECS): It is an electronic mode of funds transfer from one bank account to another used by institutions for periodic payments. Immediate Payment Service (IMPS): It is an instant real-time inter-bank electronic funds transfer system which offers service through mobile phones. Hence the service is available 24/7 throughout the year including bank holidays unlike NEFT or RTGS. IV. RESULTS AND INTERPRETATION
  • 4.
    International Journal ofEngineering and Management Research e-ISSN: 2250-0758 | p-ISSN: 2394-6962 Volume- 9, Issue- 4 (August 2019) www.ijemr.net https://doi.org/10.31033/ijemr.9.4.9 57 This work is licensed under Creative Commons Attribution 4.0 International License. This section of paper presents the empirical analysis of payment card usage in India from 2011- 2019. The secondary data is collected from RBI bulletin for each month over past eight years. It inspects the number of debit and credit cards outstanding issued in India at the end of each financial year. It also aims to compare number of card transactions of payment cards (both debit and credit) and the amount involved in the transaction. Table 2: Market penetration of payment cards in India Year No. of outstanding credit cards ( in Millions) No. of outstanding debit cards ( in Millions) 2011-2012 17.65 278.28 2012-2013 19.54 331.20 2013-2014 19.18 394.42 2014-2015 21.11 553.45 2015-2016 24.51 661.82 2016-2017 29.84 771.65 2017-2018 37.48 861.08 2018-2019 47.09 924.63 Source: RBI The Table 2 above indicates the number of credit and debit cards in operation at end of financial year (31st march) for past eight years i.e. from 2011 till 2019. The number of credit cards outstanding is rapidly increasing from 2013-2014 onwards. On the other hand, there is increase in debit card at diminishing rate from 2013-2014 onwards. By the financial year ending 2018- 2019, there are around 47.09 million credit cards outstanding indicating threefold growth from 2011-2012. Furthermore, debit cards outstanding at the end of financial year 2018-2019 is 924.63 million manifesting more than threefold growth. Graph 2.1: Total outstanding payment cards in India The above Graph 2.1 compares the number of credit and debit cards outstanding at end of each financial year from 2011-12 onwards. It reveals that even though there is sharp increase in number of credit cards, the number of debit cards dominates in India. At the end of financial year 2018-2019, credit card accounts for only 5% share out of the total payment cards while rest of them is debit cards. 0.00 200.00 400.00 600.00 800.00 1000.00 1200.00 2018-2019 2017-2018 2016-2017 2015-2016 2014-2015 2013-2014 2012-2013 2011-2012 Cards in Millions Years Credit cards Debit cards
  • 5.
    International Journal ofEngineering and Management Research e-ISSN: 2250-0758 | p-ISSN: 2394-6962 Volume- 9, Issue- 4 (August 2019) www.ijemr.net https://doi.org/10.31033/ijemr.9.4.9 58 This work is licensed under Creative Commons Attribution 4.0 International License. Graph 2.2: Percentage change in payment cards added in India The Graph 2.2 deduced from table 2, indicates the marginal percentage change in credit and debit cards outstanding in India. There was dip of around 2% in number of credit cards during the year 2013-14. The reason revolved around cardholders unable to make payments at regular interval turning accounts into NPA. It gained the momentum and started increasing trend at an exponential rate with stringent policy measures and simultaneously flexible policies in prerequisites for issuing card by the issuing banks. Contrarily, the growth of debit cards spurted during the financial year 2014-2015 as a consequence of new Jan Dhan accounts. The debit card flourished at marginal growth of around 40% in year 2014-2015. From then, the number of outstanding debit cards increased at diminishing rate. Table 3: Payment Cards usage and Transaction value in India Year No. of credit card transaction ( in Millions) Transaction value (Rs. In Billions No. of debit card transaction ( in Millions) Transaction value (Rs. In Billions) 2011-2012 320.42 978.72 5,409.45 14,521.25 2012-2013 399.23 1,244.59 5,778.35 17,435.67 2013-2014 512.03 1,556.72 6,707.10 20,602.86 2014-2015 542.56 1,651.62 6,951.61 21,146.66 2015-2016 791.65 2,436.82 9,246.15 26,949.27 2016-2017 1,093.51 3,312.21 10,962.36 26,901.79 2017-2018 1,412.97 4,626.33 11,920.04 33,556.84 2018-2019 1,772.36 6,078.81 14,273.89 39,042.64 Source: Authors’ own computation The Table 3 above indicates that number of transactions of credit and debit card has proliferated along with the transaction values. The credit card transactions have risen by five times, from 320.42 million in 2011-12 to 1.77 billion in 2018-19. The transaction value has inflated by six times from Rs. 978.72 billion to Rs. 6.07 trillion, which is relatively high compared to increase in number of transactions. Simultaneously, the debit card transactions have also increased from 5.40 billion in 2011-12 to 14.27 billion in 2018-19, which amounts to around three fold increase. The transaction value has also surged at same pace of around three fold, from Rs. 14.21trillion to Rs. 39.04 trillion. -5.00 0.00 5.00 10.00 15.00 20.00 25.00 30.00 35.00 40.00 45.00 2012-2013 2013-2014 2014-2015 2015-2016 2016-2017 2017-2018 2018-2019 Percentage Years Credit cards Debit cards
  • 6.
    International Journal ofEngineering and Management Research e-ISSN: 2250-0758 | p-ISSN: 2394-6962 Volume- 9, Issue- 4 (August 2019) www.ijemr.net https://doi.org/10.31033/ijemr.9.4.9 59 This work is licensed under Creative Commons Attribution 4.0 International License. Graph 3.1: Percentage change in debit card usage and transaction value in India The Graph 3.1 above, deduced from table 3, exhibits the annual percentage changes in number of debit card transactions and amount transacted. The number of times debit cards used has improved remarkably over the years along with transaction value. However, an exception can be noticed during the financial year 2016- 17 that even though number of times debit cards used has grown by 18.56%, the transaction amount has decreased by 0.18%. This is attributed to the effect of demonetization due to government policy which restricted the amount to be withdrawn and number of transactions. The number of transactions had huge leap during financial year 2015-16 of around 33% along with surge in the transaction value of 27.44%. The relatively high number of transaction coupled with less transaction value indicates that the average amount involved in each transaction is reducing. In other words, transaction amount is becoming smaller during each transaction over years. Graph 3.2: Percentage change in credit card usage and transaction value in India The Graph 3.2 above, deduced from table 3, indicates the annual percentage changes in number of credit card transaction and its transaction value. The number of credit card transactions has intensified from 2014-15 onwards over the years. It can be noticed that, the marginal increase in credit card transaction is almost equal to its transaction value. This states that consumer spend relatively high amount compared to debit cards in each transaction. 2012-13 2013-14 2014-15 2015-16 2016-17 2017-18 2018-19 Transactions 6.82 16.07 3.65 33.01 18.56 8.74 19.75 Transaction value 20.07 18.16 2.64 27.44 -0.18 24.74 16.35 -5.00 0.00 5.00 10.00 15.00 20.00 25.00 30.00 35.00 Percentagechange(%) 2012-13 2013-14 2014-15 2015-16 2016-17 2017-18 2018-19 Transactions 24.60 28.25 5.96 45.91 38.13 29.21 25.44 Transaction value 27.16 25.08 6.10 47.54 35.92 39.67 31.40 0.00 5.00 10.00 15.00 20.00 25.00 30.00 35.00 40.00 45.00 50.00 Percentagechange(%)
  • 7.
    International Journal ofEngineering and Management Research e-ISSN: 2250-0758 | p-ISSN: 2394-6962 Volume- 9, Issue- 4 (August 2019) www.ijemr.net https://doi.org/10.31033/ijemr.9.4.9 60 This work is licensed under Creative Commons Attribution 4.0 International License. V. SUMMARY AND CONCLUSION The study is aimed to analyse the trends of payment card usage in India. The data was collected from RBI website for period of eight years from 2011 to 2019. By the financial year ending 2018-2019, there are around 47.09 million credit cards outstanding indicating threefold growth and debit cards outstanding is 924.63 million manifesting more than threefold growth. The number of outstanding credit cards is expanding every year with liberal expansion of credit limits and prerequisites by bank and stringent measures by Government. CIBIL, a credit information company operating in India, provides CIBIL score which is easily accessible by citizens and credit card issuing institutions. From the analysis it is evident that there are around 95% debit cards holders and only 5% credit card holders in India indicating it is still niche product. Looking at the report, cardholders (credit and debit card), transactions, and transaction value have increased tremendously. The total transaction amount in debit cards in 2018-19 is consolidated to Rs. 39.04 trillion and credit cards are consolidated to Rs. 6.07 trillion. The magnification of debit cards shot up by 40% in the year 2014-15 because of policy implication. The Government of India undertook national mission of financial inclusion by opening Jan Dhan accounts and issuing debit cards. There was dip in transaction value to 0.18% in year 2016- 17, besides remarkable increase in number of operating debit cards to 18.56%. This was the effect of policy of restricting amount to be withdrawn and number of transactions due to demonetization. The Government of India reported the key achievement of demonetisation as lower cash-to-GDP ratio. The cash to GDP ratio is the ratio between the public debts incurred by the government to its gross domestic product. The ratio reduced from 12% to 8% due to reduction of currency circulation to the extent of Rs 3.89 lakhs crore as claimed by Government of India. According to Nasscom report, still less than 30% of population in India are unbanked, and hence growth opportunity is very high. Finally, the question boils down whether to have cashless economy or less cash economy. REFERENCES [1] Agarwal, S., Chakravorti, S., & Lunn, A. (2010). Why do banks reward their customers to use their credit cards?. Available at: https://www.aeaweb.org/conference/2011/retrieve.php?pd fid=280. [2] Amromin, G., & Chakravorti, S. (2009). Whither loose change? The diminishing demand for small- denomination currency. Journal of Money, Credit and Banking, 41(2–3), 315–335. [3] Arango, C. A., Hogg, D., & Lee, A. (2015). Why is cash (still) so entrenched? Insights from Canadian shopping diaries. Contemporary Economic Policy, 33(1), 141–158. [4] Bagnall, J., Bounie, D., Huynh, K. P., Kosse, A., Schmidt, T., Schuh, S. D., & Stix, H. (2014). Consumer cash usage: A cross-country comparison with payment diary survey data. Available at: https://www.ecb.europa.eu/pub/pdf/scpwps/ecbwp1685.p df. [5] Borzekowski, R., Elizabeth, K. K., & Shaista, A. (2008). Consumers’ use of debit cards: Patterns, preferences, and price response. Journal of Money, Credit and Banking, 40(1), 149–172. [6] Carbó-Valverde, S. & Liñares-Zegarra, J. M. (2011). How effective are rewards programs in promoting payment card usage? Empirical evidence. Journal of Banking & Finance, 35(12), 3275–3291. [7] Chase, M. A. (1991). The credit card industry: A history. Available at: https://www.jstor.org/stable/23859431?seq=1#page_scan _tab_contents. [8] Dimitriadis, S., Kyrezis, N., & Chalaris, M. (2018). A comparison of two multivariate analysis methods for segmenting users of alternative payment means. International Journal of Bank Marketing, 36(2), 322-335. [9] Ding, R. & Wright, J. (2017). Payment card interchange fees and price discrimination. The Journal of Industrial Economics, 65(1), 39-72. [10] Evans, D. S. & Schmalensee, R. (2005). Paying with plastic: The digital revolution in buying and borrowing. UK: Mit Press. [11] Kosse, A. & Jansen, D.-J. (2013). Choosing how to pay: The influence of foreign backgrounds. Journal of Banking & Finance, 37(3), 989–998. [12] Koulayev, S., Rysman, M., Schuh, S., & Stavins, J. (2016). Explaining adoption and use of payment instruments by US consumers. The RAND Journal of Economics, 47(2), 293–325. [13] Maji, G. Dutta, L., & Sen, S. (2019).Targeted marketing and market share analysis on POS payment data using DW and OLAP. Emerging Technologies in Data Mining and Information Security, Springer. DOI: 10.1007/978-981-13-1498-8_17 [14] Rysman, M. (2007). An empirical analysis of payment card usage. The Journal of Industrial Economics, 55(1), 1–36.