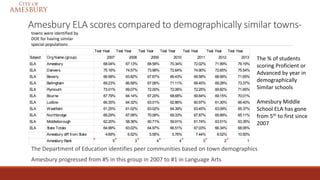
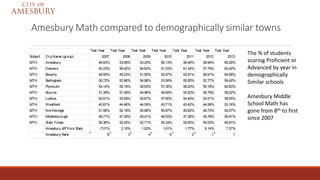
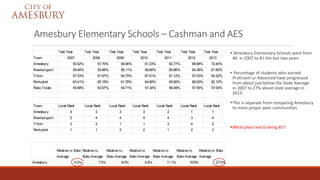
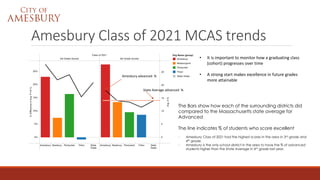
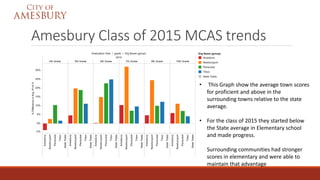
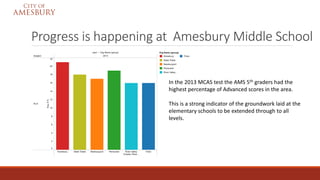
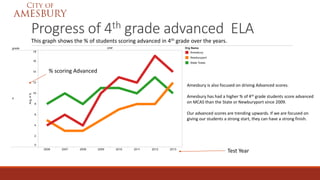
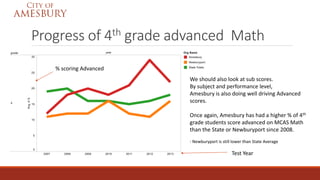
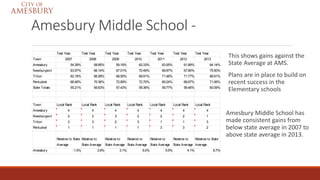
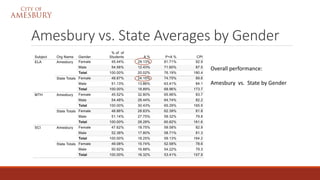
Amesbury Schools Overview
Prepared by Rob Chamberlain –
School questions
What are the right benchmarks?
◦ Comparison of Amesbury’s MCAS to surrounding towns are frequently used
◦ Shouldn’t we compare to demographically similar communities?
◦ Do demographics have an impact on what the standardized test measures?
What are the true budget drivers
◦ Do we know the rate of increase on budget on SPED as a percentage of the Amesbury budget?
In spite of cuts to programming, the schools are showing results
There have been steady gains against state averages
Amesbury Elementary schools had the highest MCAS scores in the area for the last two years
 This is up from the bottom scores in the area in 2007
A strong start will lead to continued excellence as students move the grades.
 For example - Last years 5th grade had the highest % of Advanced scores in the area on last
year’s MCAS
Analysis Approach
•It is important to look at MCAS as one piece of data. There are other feedback
measures to support planning and improvement across all student groups.
• It is critical to look at details:
• The specifics of various subgroup performances against each specific goal.
• The performance of a class (cohort) as they move through the grades.
• Performance by subject level.
• A comprehensive approach is the best way to help our students reach excellence.
Thoughtful analysis will support better planning
• Areas of excellence and specific areas or groups that need additional focus for
improvement.
Success in Middle School and High School starts in Elementary
Significant and steady progress has been made in Amesbury over the last
7 years
Amesbury has had the top scores of all elementary schools in the area for
the last two years
 This year’s 6th graders had the most Advanced scores in 5th grade ELA in
the region
All Amesbury schools have made consistent progress vs. demographically
similar districts
In 2013 Amesbury had the top scores vs. similar districts identified by the
DESE
Segments - subgroups, cohorts, high needs?
It is important to look at scores by segments and to follow trends over time by each category.
Segments are way to break down scores by different characteristics which make analysis more
meaningful. There are consistent performance gaps between subgroups so understanding the
makeup of each population and how each group is performing relative to peer groups and goals
is important.
Segments where there are consistent performance differences include:
1. Gender – boys score lower than girls on MCAS – fairly consistent test gap
2. Income – Lower Income correlates strongly to lower test scores
3. ELL – English Language Learners
4. Race
5. Special Needs
Demographic overviews
T itle
% of Amesbury
District
% of
Newburyport
% of State
Low-income 23.6 9.3 37
Students W ith
Disabilities
19 14.7 17
Free Lunch 18.4 7.7 32.1
Reduced Lunch 5.3 1.7 4.9
High Needs 35.6 21.6 47.9
Amesbury's demographics drive improvement goals
Amesbury should look at each group when it is analyzing and planning improvements
Why this population difference is important
• Across all districts in the state Females outperform Males on MCAS scores
• In the 2013 test 24.6% Females scored advanced on MCAS vs. 20.1% of Males.
• Amesbury has a higher population of boys that will impact any simple comparison to districts with a different % of boys vs. girls
• This holds true for other subgroups – SPED, Low Income, High Needs, etc. where Amesbury has a higher share of students in those
groups than surrounding communities
• Looking at scores generically as the Daily News does, isn’t best practice.
Amesbury Amesbury % Newburyport Newburyport % State State %
Male 1,237 53% 1,174 50% 489,289 51%
Female 1,100 47% 1,175 50% 465,484 49%
Total 2,337 100% 2,349 100% 954,773 100%
Enrollment by Gender (2012-13)
Amesbury ELA scores compared to demographically similar towns-
The Department of Education identifies peer communities based on town demographics
Amesbury progressed from #5 in this group in 2007 to #1 in Language Arts
Test Year Test Year Test Year Test Year Test Year Test Year Test Year
Subject Org Name (group) 2007 2008 2009 2010 2011 2012 2013
ELA Amesbury 68.04% 67.13% 68.58% 70.34% 72.02% 71.99% 76.19%
ELA Danvers 75.16% 74.57% 73.98% 72.64% 74.90% 72.65% 75.54%
ELA Beverly 66.58% 63.82% 67.87% 69.43% 69.58% 68.56% 71.65%
ELA Bellingham 69.23% 66.58% 67.06% 71.11% 69.45% 69.28% 73.37%
ELA Plymouth 73.01% 69.07% 72.00% 72.06% 72.25% 69.82% 71.65%
ELA Bourne 67.79% 64.14% 67.20% 68.68% 69.84% 69.15% 70.01%
ELA Ludlow 66.35% 64.32% 63.01% 62.86% 60.97% 61.30% 66.40%
ELA Westfield 61.25% 61.02% 63.02% 64.39% 63.45% 63.09% 65.37%
ELA Northbridge 69.29% 67.08% 70.08% 69.33% 67.87% 65.99% 65.11%
ELA Middleborough 62.20% 58.36% 60.71% 59.91% 61.74% 63.51% 63.35%
ELA State Totals 64.99% 63.02% 64.97% 66.51% 67.03% 66.34% 68.95%
Amesbury diff from State 4.69% 6.52% 5.56% 5.76% 7.44% 8.52% 10.50%
Amesbury Rank 5 3 4 4 3 2 1
towns were identified by
DOE for having similar
special populations
The % of students
scoring Proficient or
Advanced by year in
demographically
Similar schools
Amesbury Middle
School ELA has gone
from 5th to first since
2007
Amesbury Math compared to demographically similar towns
Test Year Test Year Test Year Test Year Test Year Test Year Test Year
Subject Org Name (group) 2007 2008 2009 2010 2011 2012 2013
MTH Amesbury 46.83% 53.58% 53.25% 56.13% 56.48% 58.94% 65.29%
MTH Danvers 50.23% 56.42% 54.62% 61.03% 61.34% 57.79% 63.42%
MTH Beverly 49.55% 49.23% 51.50% 52.97% 53.91% 56.91% 64.68%
MTH Bellingham 50.72% 52.86% 54.98% 53.59% 55.55% 52.77% 59.42%
MTH Plymouth 54.14% 55.19% 55.63% 57.38% 56.20% 56.18% 60.83%
MTH Bourne 51.39% 51.59% 49.96% 56.69% 55.52% 56.79% 59.22%
MTH Ludlow 50.91% 53.09% 50.67% 47.60% 54.40% 52.51% 58.55%
MTH Westfield 40.81% 44.46% 44.09% 43.71% 43.42% 44.58% 53.16%
MTH Northbridge 51.58% 52.18% 50.86% 50.87% 49.62% 46.73% 50.07%
MTH Middleborough 46.71% 47.28% 45.41% 46.53% 47.26% 45.78% 50.91%
MTH State Totals 50.36% 52.45% 52.71% 55.24% 55.50% 55.53% 60.81%
Amesbury diff from State -7.01% 2.15% 1.02% 1.61% 1.77% 6.14% 7.37%
Amesbury Rank 8 3 4 4 2 1 1
The % of students
scoring Proficient or
Advanced by year in
demographically
Similar schools
Amesbury Middle
School Math has
gone from 8th to first
since 2007
Relative to State
Average
Relative to
State Average
Relative to
State Average
Relative to
State Average
Relative to
State Average
Relative to
State Average
Relative to State
Average
Amesbury -0.3% 7.5% 8.0% 6.8% 11.1% 19.9% 27.0%
Amesbury Elementary Schools – Cashman and AES
 Amesbury Elementary Schools went from
#4 in 2007 to #1 the last two years
 Percentage of students who earned
Proficient or Advanced have progressed
from about just below the State Average
in 2007 to 27% above state average in
2013
This is separate from comparing Amesbury
to more proper peer communities
What plans led to being #1?
Test Year Test Year Test Year Test Year Test Year Test Year Test Year
Town 2007 2008 2009 2010 2011 2012 2013
Amesbury 55.52% 57.70% 59.06% 61.23% 62.77% 68.98% 72.45%
Newburyport 59.46% 53.66% 56.11% 58.66% 60.86% 64.38% 61.90%
Triton 57.33% 61.97% 64.70% 67.51% 61.12% 57.53% 64.32%
Pentucket 63.41% 65.18% 61.78% 64.80% 65.06% 68.00% 62.12%
State Totals 55.68% 53.67% 54.71% 57.34% 56.49% 57.55% 57.04%
Town Local Rank Local Rank Local Rank Local Rank Local Rank Local Rank Local Rank
Amesbury 4 3 3 3 2 1 1
Newburyport 2 4 4 4 4 3 4
Triton 3 2 1 1 3 4 2
Pentucket 1 1 2 2 1 2 3
Amesbury Class of 2021 MCAS trends
• It is important to monitor how a graduating class
(cohort) progresses over time
• A strong start makes excellence in future grades
more attainable
The Bars show how each of the surrounding districts did
compared to the Massachusetts state average for
Advanced
The line indicates % of students who score excellent
- Amesbury Class of 2021 had the highest scores in the area in 3rd grade and
4th grade.
- Amesbury is the only school district in the area to have the % of advanced
students higher than the State Average in 4th grade last year.
State Average advanced %
Amesbury advanced %
Amesbury Class of 2015 MCAS trends
• This Graph show the average town scores
for proficient and above in the
surrounding towns relative to the state
average.
• For the class of 2015 they started below
the State average in Elementary school
and made progress.
Surrounding communities had stronger
scores in elementary and were able to
maintain that advantage
Progress is happening at Amesbury Middle School
In the 2013 MCAS test the AMS 5th graders had the
highest percentage of Advanced scores in the area.
This is a strong indicator of the groundwork laid at the
elementary schools to be extended through to all
levels.
Progress of 4th grade advanced ELA
Amesbury is also focused on driving Advanced scores.
Amesbury has had a higher % of 4th grade students score advanced
on MCAS than the State or Newburyport since 2009.
Our advanced scores are trending upwards. If we are focused on
giving our students a strong start, they can have a strong finish.
This graph shows the % of students scoring advanced in 4th grade over the years.
% scoring Advanced
Test Year
Progress of 4th grade advanced Math
We should also look at sub scores.
By subject and performance level,
Amesbury is also doing well driving Advanced
scores.
Once again, Amesbury has had a higher % of 4th
grade students score advanced on MCAS Math
than the State or Newburyport since 2008.
- Newburyport is still lower than State Average
% scoring Advanced
Test Year
Amesbury Middle School -
This shows gains against the
State Average at AMS.
Plans are in place to build on
recent success in the
Elementary schools
Amesbury Middle School has
made consistent gains from
below state average in 2007 to
above state average in 2013.
Test Year Test Year Test Year Test Year Test Year Test Year Test Year
Town 2007 2008 2009 2010 2011 2012 2013
Amesbury 54.39% 58.85% 59.19% 62.33% 63.05% 61.89% 64.14%
Newburyport 63.57% 66.14% 67.01% 70.49% 69.87% 67.80% 75.50%
Triton 62.18% 66.08% 68.55% 69.91% 71.48% 71.77% 68.91%
Pentucket 68.46% 70.36% 72.89% 72.70% 69.24% 66.67% 71.06%
State Totals 55.21% 56.63% 57.43% 59.36% 59.77% 59.46% 60.09%
Town Local Rank Local Rank Local Rank Local Rank Local Rank Local Rank Local Rank
Amesbury 4 4 4 4 4 4 4
Newburyport 2 2 3 2 2 2 1
Triton 3 3 2 3 1 1 3
Pentucket 1 1 1 1 3 3 2
Relative to State
Average
Relative to
State Average
Relative to
State Average
Relative to
State Average
Relative to
State Average
Relative to
State Average
Relative to State
Average
Amesbury -1.5% 3.9% 3.1% 5.0% 5.5% 4.1% 6.7%
Amesbury vs. State Averages by Gender
Overall performance:
Amesbury vs. State by Gender
School Investment trends
• Schools are the largest local cost
• Chapter 70, the main form of state reimbursement, hasn’t kept pace with needs or mandates
• Sped costs are accelerating as a % of the budget
• Investment is needed to maintain positive growth
School Investment Summary
• The increases in local spending are largely driven by gaps in Chapter 70 aid and increases in special
education costs
• The schools have been working hard to maintain a positive trend vs local communities and demographic
peers.
• At the same time, the schools have seen significant reductions in program offerings.
.
Trend Budget and State Revenue
• No other city or town that received
a similar amount of Chapter 70
money in 2000 is receiving less aid
in 2013 except for Amesbury
• These deficits shift the financial
burden to the local tax base.
• Maintaining staff and programming
costs money the state isn't
providing.
• To offset losses from the state,
Amesbury has mad significant cuts
to programming over the last ten
years.
Per Pupil costs
Your District: Amesbury
Comparable District: Newburyport
Year Pupils (FTE) Total Per Pupil Pupils (FTE) Total Per Pupil Pupils (FTE) Total Per Pupil
FY07 2,648.7 $29.1M $10,973 2,594.1 $29.7M $11,458 994,069.2 $11.8B $11,858
FY08 2,621.0 $30.3M $11,568 2,538.3 $31.0M $12,199 989,656.7 $12.3B $12,448
FY09 2,535.4 $30.8M $12,154 2,507.6 $31.4M $12,523 985,165.3 $12.8B $13,006
FY10 2,571.0 $31.8M $12,384 2,499.1 $32.3M $12,938 986,207.9 $12.9B $13,053
FY11 2,535.2 $32.9M $12,966 2,509.8 $33.6M $13,369 984,581.9 $13.2B $13,361
Total Per Pupil Expenditures
Newburyport StateAmesbury
Expenditures Expenditures Expenditures
$0
$2,000
$4,000
$6,000
$8,000
$10,000
$12,000
$14,000
$16,000
$18,000
$20,000
$22,000
$24,000
$26,000
$28,000
$30,000
FY07 FY08 FY09 FY10 FY11
Avg Teacher Salaries
Average Teacher Salaries
Year Total Avg Total Avg Total Avg
FY07 198.8 $10.9M $54,914 212.9 $11.4M $53,499 73,759.5 $4.3B $58,258
FY08 167.0 $10.3M $61,540 159.0 $10.8M $67,884 69,331.4 $4.4B $64,164
FY09 171.5 $11.2M $65,260 167.5 $11.8M $70,349 68,289.5 $4.6B $67,572
FY10 168.1 $10.9M $65,040 169.4 $12.6M $74,245 67,747.0 $4.7B $68,781
FY11 163.4 $11.5M $70,341 170.1 $12.3M $72,536 66,882.2 $4.7B $70,340
Amesbury Newburyport State
Teachers
(FTE)
Salaries Teachers
(FTE)
Salaries Teachers
(FTE)
Salaries
$30K
$40K
$50K
$60K
$70K
$80K
$90K
$100K
FY07 FY08 FY09 FY10 FY11
How are we spending compared to
foundation budgets
Percent Net School Spending above Foundation Budget
Year
Foundation
Budget
Actual
Spending
%
Foundation
Budget
Actual
Spending
%
Foundation
Budget
Actual
Spending
%
FY07 $19.5M $23.3M 16% $17.4M $24.8M 30% $8.0B $9.5B 16%
FY08 $19.8M $25.2M 21% $18.1M $25.4M 29% $8.4B $10.0B 16%
FY09 $20.8M $24.5M 15% $19.0M $26.5M 28% $8.8B $10.1B 12%
FY10 $21.2M $26.0M 18% $19.3M $26.6M 28% $9.1B $10.4B 13%
FY11 $21.2M $26.4M 20% $19.0M $27.7M 32% $8.9B $10.6B 16%
Amesbury Newburyport State
-60%
-50%
-40%
-30%
-20%
-10%
0%
10%
20%
30%
40%
50%
60%
FY07 FY08 FY09 FY10 FY11
Is Amesbury investing enough?
Year Required
Spending
Actual
Spending %
Required
Spending
Actual
Spending %
Required
Spending
Actual
Spending %
FY07 $21.4M $23.3M 8% $21.5M $24.8M 13% $8.4B $9.5B 12%
FY08 $21.9M $25.2M 13% $21.4M $25.4M 16% $8.7B $10.0B 13%
FY09 $21.7M $24.5M 11% $20.8M $26.5M 21% $8.7B $10.1B 14%
FY10 $22.5M $26.0M 14% $21.1M $26.6M 21% $9.1B $10.4B 12%
FY11 $22.0M $26.4M 17% $20.6M $27.7M 26% $9.2B $10.6B 13%
Amesbury Newburyport State
Percent Actual Net School Spending above Required Net School Spending
-50%
-40%
-30%
-20%
-10%
0%
10%
20%
30%
40%
50%
FY07 FY08 FY09 FY10 FY11
We've seen some of the success stories of what our teachers and students have been able to do with less. But at
what cost? Questions left to answer: If our scores are growing, why are families choosing to leave Amesbury
schools? How many students can we afford to lose? If more of our regular ed students go to other schools and our
SPED ratio increases, what will the impact be?

Amesbury schools overview april 2014b

  • 1.
    Amesbury Schools Overview Preparedby Rob Chamberlain –
  • 2.
    School questions What arethe right benchmarks? ◦ Comparison of Amesbury’s MCAS to surrounding towns are frequently used ◦ Shouldn’t we compare to demographically similar communities? ◦ Do demographics have an impact on what the standardized test measures? What are the true budget drivers ◦ Do we know the rate of increase on budget on SPED as a percentage of the Amesbury budget?
  • 3.
    In spite ofcuts to programming, the schools are showing results There have been steady gains against state averages Amesbury Elementary schools had the highest MCAS scores in the area for the last two years  This is up from the bottom scores in the area in 2007 A strong start will lead to continued excellence as students move the grades.  For example - Last years 5th grade had the highest % of Advanced scores in the area on last year’s MCAS
  • 4.
    Analysis Approach •It isimportant to look at MCAS as one piece of data. There are other feedback measures to support planning and improvement across all student groups. • It is critical to look at details: • The specifics of various subgroup performances against each specific goal. • The performance of a class (cohort) as they move through the grades. • Performance by subject level. • A comprehensive approach is the best way to help our students reach excellence. Thoughtful analysis will support better planning • Areas of excellence and specific areas or groups that need additional focus for improvement.
  • 5.
    Success in MiddleSchool and High School starts in Elementary Significant and steady progress has been made in Amesbury over the last 7 years Amesbury has had the top scores of all elementary schools in the area for the last two years  This year’s 6th graders had the most Advanced scores in 5th grade ELA in the region All Amesbury schools have made consistent progress vs. demographically similar districts In 2013 Amesbury had the top scores vs. similar districts identified by the DESE
  • 6.
    Segments - subgroups,cohorts, high needs? It is important to look at scores by segments and to follow trends over time by each category. Segments are way to break down scores by different characteristics which make analysis more meaningful. There are consistent performance gaps between subgroups so understanding the makeup of each population and how each group is performing relative to peer groups and goals is important. Segments where there are consistent performance differences include: 1. Gender – boys score lower than girls on MCAS – fairly consistent test gap 2. Income – Lower Income correlates strongly to lower test scores 3. ELL – English Language Learners 4. Race 5. Special Needs
  • 7.
    Demographic overviews T itle %of Amesbury District % of Newburyport % of State Low-income 23.6 9.3 37 Students W ith Disabilities 19 14.7 17 Free Lunch 18.4 7.7 32.1 Reduced Lunch 5.3 1.7 4.9 High Needs 35.6 21.6 47.9
  • 8.
    Amesbury's demographics driveimprovement goals Amesbury should look at each group when it is analyzing and planning improvements Why this population difference is important • Across all districts in the state Females outperform Males on MCAS scores • In the 2013 test 24.6% Females scored advanced on MCAS vs. 20.1% of Males. • Amesbury has a higher population of boys that will impact any simple comparison to districts with a different % of boys vs. girls • This holds true for other subgroups – SPED, Low Income, High Needs, etc. where Amesbury has a higher share of students in those groups than surrounding communities • Looking at scores generically as the Daily News does, isn’t best practice. Amesbury Amesbury % Newburyport Newburyport % State State % Male 1,237 53% 1,174 50% 489,289 51% Female 1,100 47% 1,175 50% 465,484 49% Total 2,337 100% 2,349 100% 954,773 100% Enrollment by Gender (2012-13)
  • 9.
    Amesbury ELA scorescompared to demographically similar towns- The Department of Education identifies peer communities based on town demographics Amesbury progressed from #5 in this group in 2007 to #1 in Language Arts Test Year Test Year Test Year Test Year Test Year Test Year Test Year Subject Org Name (group) 2007 2008 2009 2010 2011 2012 2013 ELA Amesbury 68.04% 67.13% 68.58% 70.34% 72.02% 71.99% 76.19% ELA Danvers 75.16% 74.57% 73.98% 72.64% 74.90% 72.65% 75.54% ELA Beverly 66.58% 63.82% 67.87% 69.43% 69.58% 68.56% 71.65% ELA Bellingham 69.23% 66.58% 67.06% 71.11% 69.45% 69.28% 73.37% ELA Plymouth 73.01% 69.07% 72.00% 72.06% 72.25% 69.82% 71.65% ELA Bourne 67.79% 64.14% 67.20% 68.68% 69.84% 69.15% 70.01% ELA Ludlow 66.35% 64.32% 63.01% 62.86% 60.97% 61.30% 66.40% ELA Westfield 61.25% 61.02% 63.02% 64.39% 63.45% 63.09% 65.37% ELA Northbridge 69.29% 67.08% 70.08% 69.33% 67.87% 65.99% 65.11% ELA Middleborough 62.20% 58.36% 60.71% 59.91% 61.74% 63.51% 63.35% ELA State Totals 64.99% 63.02% 64.97% 66.51% 67.03% 66.34% 68.95% Amesbury diff from State 4.69% 6.52% 5.56% 5.76% 7.44% 8.52% 10.50% Amesbury Rank 5 3 4 4 3 2 1 towns were identified by DOE for having similar special populations The % of students scoring Proficient or Advanced by year in demographically Similar schools Amesbury Middle School ELA has gone from 5th to first since 2007
  • 10.
    Amesbury Math comparedto demographically similar towns Test Year Test Year Test Year Test Year Test Year Test Year Test Year Subject Org Name (group) 2007 2008 2009 2010 2011 2012 2013 MTH Amesbury 46.83% 53.58% 53.25% 56.13% 56.48% 58.94% 65.29% MTH Danvers 50.23% 56.42% 54.62% 61.03% 61.34% 57.79% 63.42% MTH Beverly 49.55% 49.23% 51.50% 52.97% 53.91% 56.91% 64.68% MTH Bellingham 50.72% 52.86% 54.98% 53.59% 55.55% 52.77% 59.42% MTH Plymouth 54.14% 55.19% 55.63% 57.38% 56.20% 56.18% 60.83% MTH Bourne 51.39% 51.59% 49.96% 56.69% 55.52% 56.79% 59.22% MTH Ludlow 50.91% 53.09% 50.67% 47.60% 54.40% 52.51% 58.55% MTH Westfield 40.81% 44.46% 44.09% 43.71% 43.42% 44.58% 53.16% MTH Northbridge 51.58% 52.18% 50.86% 50.87% 49.62% 46.73% 50.07% MTH Middleborough 46.71% 47.28% 45.41% 46.53% 47.26% 45.78% 50.91% MTH State Totals 50.36% 52.45% 52.71% 55.24% 55.50% 55.53% 60.81% Amesbury diff from State -7.01% 2.15% 1.02% 1.61% 1.77% 6.14% 7.37% Amesbury Rank 8 3 4 4 2 1 1 The % of students scoring Proficient or Advanced by year in demographically Similar schools Amesbury Middle School Math has gone from 8th to first since 2007
  • 11.
    Relative to State Average Relativeto State Average Relative to State Average Relative to State Average Relative to State Average Relative to State Average Relative to State Average Amesbury -0.3% 7.5% 8.0% 6.8% 11.1% 19.9% 27.0% Amesbury Elementary Schools – Cashman and AES  Amesbury Elementary Schools went from #4 in 2007 to #1 the last two years  Percentage of students who earned Proficient or Advanced have progressed from about just below the State Average in 2007 to 27% above state average in 2013 This is separate from comparing Amesbury to more proper peer communities What plans led to being #1? Test Year Test Year Test Year Test Year Test Year Test Year Test Year Town 2007 2008 2009 2010 2011 2012 2013 Amesbury 55.52% 57.70% 59.06% 61.23% 62.77% 68.98% 72.45% Newburyport 59.46% 53.66% 56.11% 58.66% 60.86% 64.38% 61.90% Triton 57.33% 61.97% 64.70% 67.51% 61.12% 57.53% 64.32% Pentucket 63.41% 65.18% 61.78% 64.80% 65.06% 68.00% 62.12% State Totals 55.68% 53.67% 54.71% 57.34% 56.49% 57.55% 57.04% Town Local Rank Local Rank Local Rank Local Rank Local Rank Local Rank Local Rank Amesbury 4 3 3 3 2 1 1 Newburyport 2 4 4 4 4 3 4 Triton 3 2 1 1 3 4 2 Pentucket 1 1 2 2 1 2 3
  • 12.
    Amesbury Class of2021 MCAS trends • It is important to monitor how a graduating class (cohort) progresses over time • A strong start makes excellence in future grades more attainable The Bars show how each of the surrounding districts did compared to the Massachusetts state average for Advanced The line indicates % of students who score excellent - Amesbury Class of 2021 had the highest scores in the area in 3rd grade and 4th grade. - Amesbury is the only school district in the area to have the % of advanced students higher than the State Average in 4th grade last year. State Average advanced % Amesbury advanced %
  • 13.
    Amesbury Class of2015 MCAS trends • This Graph show the average town scores for proficient and above in the surrounding towns relative to the state average. • For the class of 2015 they started below the State average in Elementary school and made progress. Surrounding communities had stronger scores in elementary and were able to maintain that advantage
  • 14.
    Progress is happeningat Amesbury Middle School In the 2013 MCAS test the AMS 5th graders had the highest percentage of Advanced scores in the area. This is a strong indicator of the groundwork laid at the elementary schools to be extended through to all levels.
  • 15.
    Progress of 4thgrade advanced ELA Amesbury is also focused on driving Advanced scores. Amesbury has had a higher % of 4th grade students score advanced on MCAS than the State or Newburyport since 2009. Our advanced scores are trending upwards. If we are focused on giving our students a strong start, they can have a strong finish. This graph shows the % of students scoring advanced in 4th grade over the years. % scoring Advanced Test Year
  • 16.
    Progress of 4thgrade advanced Math We should also look at sub scores. By subject and performance level, Amesbury is also doing well driving Advanced scores. Once again, Amesbury has had a higher % of 4th grade students score advanced on MCAS Math than the State or Newburyport since 2008. - Newburyport is still lower than State Average % scoring Advanced Test Year
  • 17.
    Amesbury Middle School- This shows gains against the State Average at AMS. Plans are in place to build on recent success in the Elementary schools Amesbury Middle School has made consistent gains from below state average in 2007 to above state average in 2013. Test Year Test Year Test Year Test Year Test Year Test Year Test Year Town 2007 2008 2009 2010 2011 2012 2013 Amesbury 54.39% 58.85% 59.19% 62.33% 63.05% 61.89% 64.14% Newburyport 63.57% 66.14% 67.01% 70.49% 69.87% 67.80% 75.50% Triton 62.18% 66.08% 68.55% 69.91% 71.48% 71.77% 68.91% Pentucket 68.46% 70.36% 72.89% 72.70% 69.24% 66.67% 71.06% State Totals 55.21% 56.63% 57.43% 59.36% 59.77% 59.46% 60.09% Town Local Rank Local Rank Local Rank Local Rank Local Rank Local Rank Local Rank Amesbury 4 4 4 4 4 4 4 Newburyport 2 2 3 2 2 2 1 Triton 3 3 2 3 1 1 3 Pentucket 1 1 1 1 3 3 2 Relative to State Average Relative to State Average Relative to State Average Relative to State Average Relative to State Average Relative to State Average Relative to State Average Amesbury -1.5% 3.9% 3.1% 5.0% 5.5% 4.1% 6.7%
  • 18.
    Amesbury vs. StateAverages by Gender Overall performance: Amesbury vs. State by Gender
  • 19.
    School Investment trends •Schools are the largest local cost • Chapter 70, the main form of state reimbursement, hasn’t kept pace with needs or mandates • Sped costs are accelerating as a % of the budget • Investment is needed to maintain positive growth
  • 20.
    School Investment Summary •The increases in local spending are largely driven by gaps in Chapter 70 aid and increases in special education costs • The schools have been working hard to maintain a positive trend vs local communities and demographic peers. • At the same time, the schools have seen significant reductions in program offerings. .
  • 21.
    Trend Budget andState Revenue • No other city or town that received a similar amount of Chapter 70 money in 2000 is receiving less aid in 2013 except for Amesbury • These deficits shift the financial burden to the local tax base. • Maintaining staff and programming costs money the state isn't providing. • To offset losses from the state, Amesbury has mad significant cuts to programming over the last ten years.
  • 22.
    Per Pupil costs YourDistrict: Amesbury Comparable District: Newburyport Year Pupils (FTE) Total Per Pupil Pupils (FTE) Total Per Pupil Pupils (FTE) Total Per Pupil FY07 2,648.7 $29.1M $10,973 2,594.1 $29.7M $11,458 994,069.2 $11.8B $11,858 FY08 2,621.0 $30.3M $11,568 2,538.3 $31.0M $12,199 989,656.7 $12.3B $12,448 FY09 2,535.4 $30.8M $12,154 2,507.6 $31.4M $12,523 985,165.3 $12.8B $13,006 FY10 2,571.0 $31.8M $12,384 2,499.1 $32.3M $12,938 986,207.9 $12.9B $13,053 FY11 2,535.2 $32.9M $12,966 2,509.8 $33.6M $13,369 984,581.9 $13.2B $13,361 Total Per Pupil Expenditures Newburyport StateAmesbury Expenditures Expenditures Expenditures $0 $2,000 $4,000 $6,000 $8,000 $10,000 $12,000 $14,000 $16,000 $18,000 $20,000 $22,000 $24,000 $26,000 $28,000 $30,000 FY07 FY08 FY09 FY10 FY11
  • 23.
    Avg Teacher Salaries AverageTeacher Salaries Year Total Avg Total Avg Total Avg FY07 198.8 $10.9M $54,914 212.9 $11.4M $53,499 73,759.5 $4.3B $58,258 FY08 167.0 $10.3M $61,540 159.0 $10.8M $67,884 69,331.4 $4.4B $64,164 FY09 171.5 $11.2M $65,260 167.5 $11.8M $70,349 68,289.5 $4.6B $67,572 FY10 168.1 $10.9M $65,040 169.4 $12.6M $74,245 67,747.0 $4.7B $68,781 FY11 163.4 $11.5M $70,341 170.1 $12.3M $72,536 66,882.2 $4.7B $70,340 Amesbury Newburyport State Teachers (FTE) Salaries Teachers (FTE) Salaries Teachers (FTE) Salaries $30K $40K $50K $60K $70K $80K $90K $100K FY07 FY08 FY09 FY10 FY11
  • 24.
    How are wespending compared to foundation budgets Percent Net School Spending above Foundation Budget Year Foundation Budget Actual Spending % Foundation Budget Actual Spending % Foundation Budget Actual Spending % FY07 $19.5M $23.3M 16% $17.4M $24.8M 30% $8.0B $9.5B 16% FY08 $19.8M $25.2M 21% $18.1M $25.4M 29% $8.4B $10.0B 16% FY09 $20.8M $24.5M 15% $19.0M $26.5M 28% $8.8B $10.1B 12% FY10 $21.2M $26.0M 18% $19.3M $26.6M 28% $9.1B $10.4B 13% FY11 $21.2M $26.4M 20% $19.0M $27.7M 32% $8.9B $10.6B 16% Amesbury Newburyport State -60% -50% -40% -30% -20% -10% 0% 10% 20% 30% 40% 50% 60% FY07 FY08 FY09 FY10 FY11
  • 25.
    Is Amesbury investingenough? Year Required Spending Actual Spending % Required Spending Actual Spending % Required Spending Actual Spending % FY07 $21.4M $23.3M 8% $21.5M $24.8M 13% $8.4B $9.5B 12% FY08 $21.9M $25.2M 13% $21.4M $25.4M 16% $8.7B $10.0B 13% FY09 $21.7M $24.5M 11% $20.8M $26.5M 21% $8.7B $10.1B 14% FY10 $22.5M $26.0M 14% $21.1M $26.6M 21% $9.1B $10.4B 12% FY11 $22.0M $26.4M 17% $20.6M $27.7M 26% $9.2B $10.6B 13% Amesbury Newburyport State Percent Actual Net School Spending above Required Net School Spending -50% -40% -30% -20% -10% 0% 10% 20% 30% 40% 50% FY07 FY08 FY09 FY10 FY11 We've seen some of the success stories of what our teachers and students have been able to do with less. But at what cost? Questions left to answer: If our scores are growing, why are families choosing to leave Amesbury schools? How many students can we afford to lose? If more of our regular ed students go to other schools and our SPED ratio increases, what will the impact be?

Editor's Notes

  • #5 Do we need details on other mechanisms in place.. I know there are new tests in place.. Other feedback mechanisms used – (need to clarify other test we give kids) Lexile Mapp
  • #9 (let’s agree on terminology.. I always use segment but seems like sub group is term used in GOV.. )
  • #22 Will opposition jump on this as management issue.?