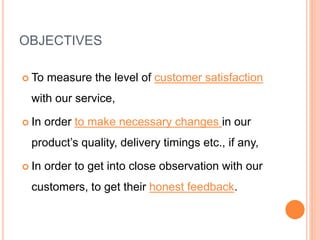
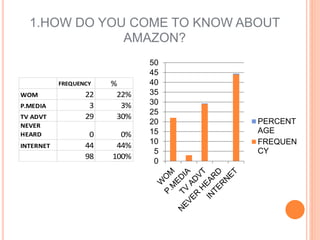
The document summarizes the results of an Amazon customer satisfaction survey conducted in Tirupati, India. Some key findings include:
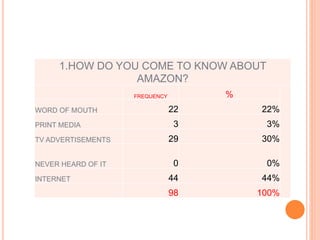
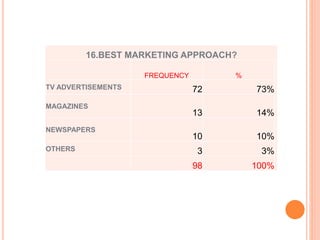
- 44% of respondents learned about Amazon through the internet, while 30% heard through TV advertisements.
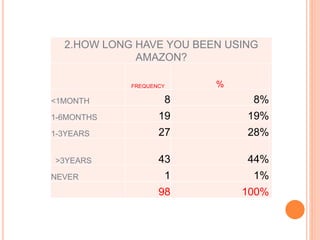
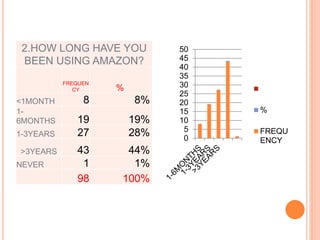
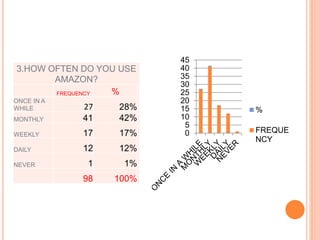
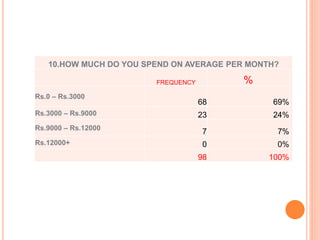
- Over 40% of respondents use Amazon monthly and 28% use it weekly.
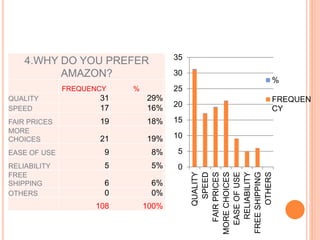
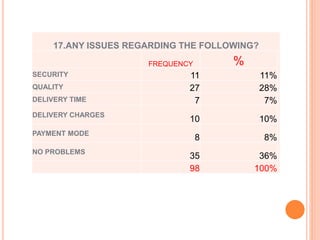
- Quality, speed, and fair prices were the top reasons for preferring Amazon.
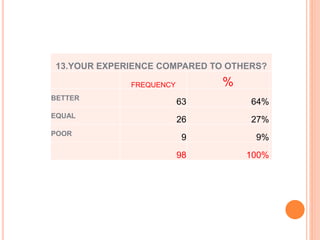
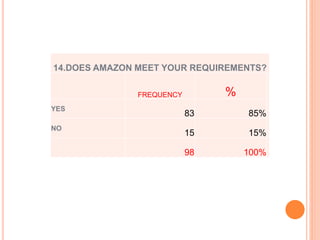
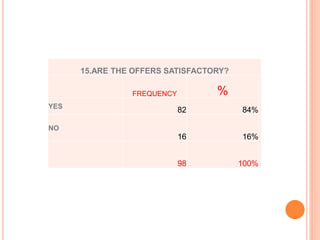
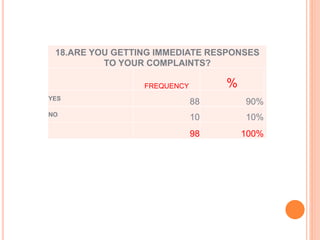
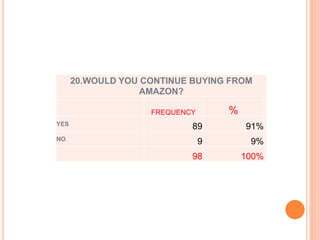
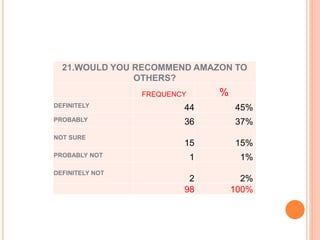
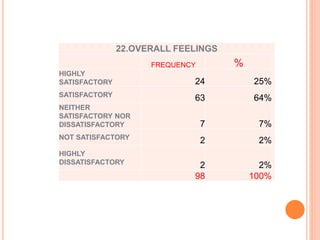
- The majority of respondents were satisfied or highly satisfied with Amazon's service and would recommend it to others.


![Guru movie ppt [ravish roshan]](https://cdn.slidesharecdn.com/ss_thumbnails/guru-the-leaderravish-roshan9968009808-1223227177396870-8-thumbnail.jpg?width=640&height=640&fit=bounds)


