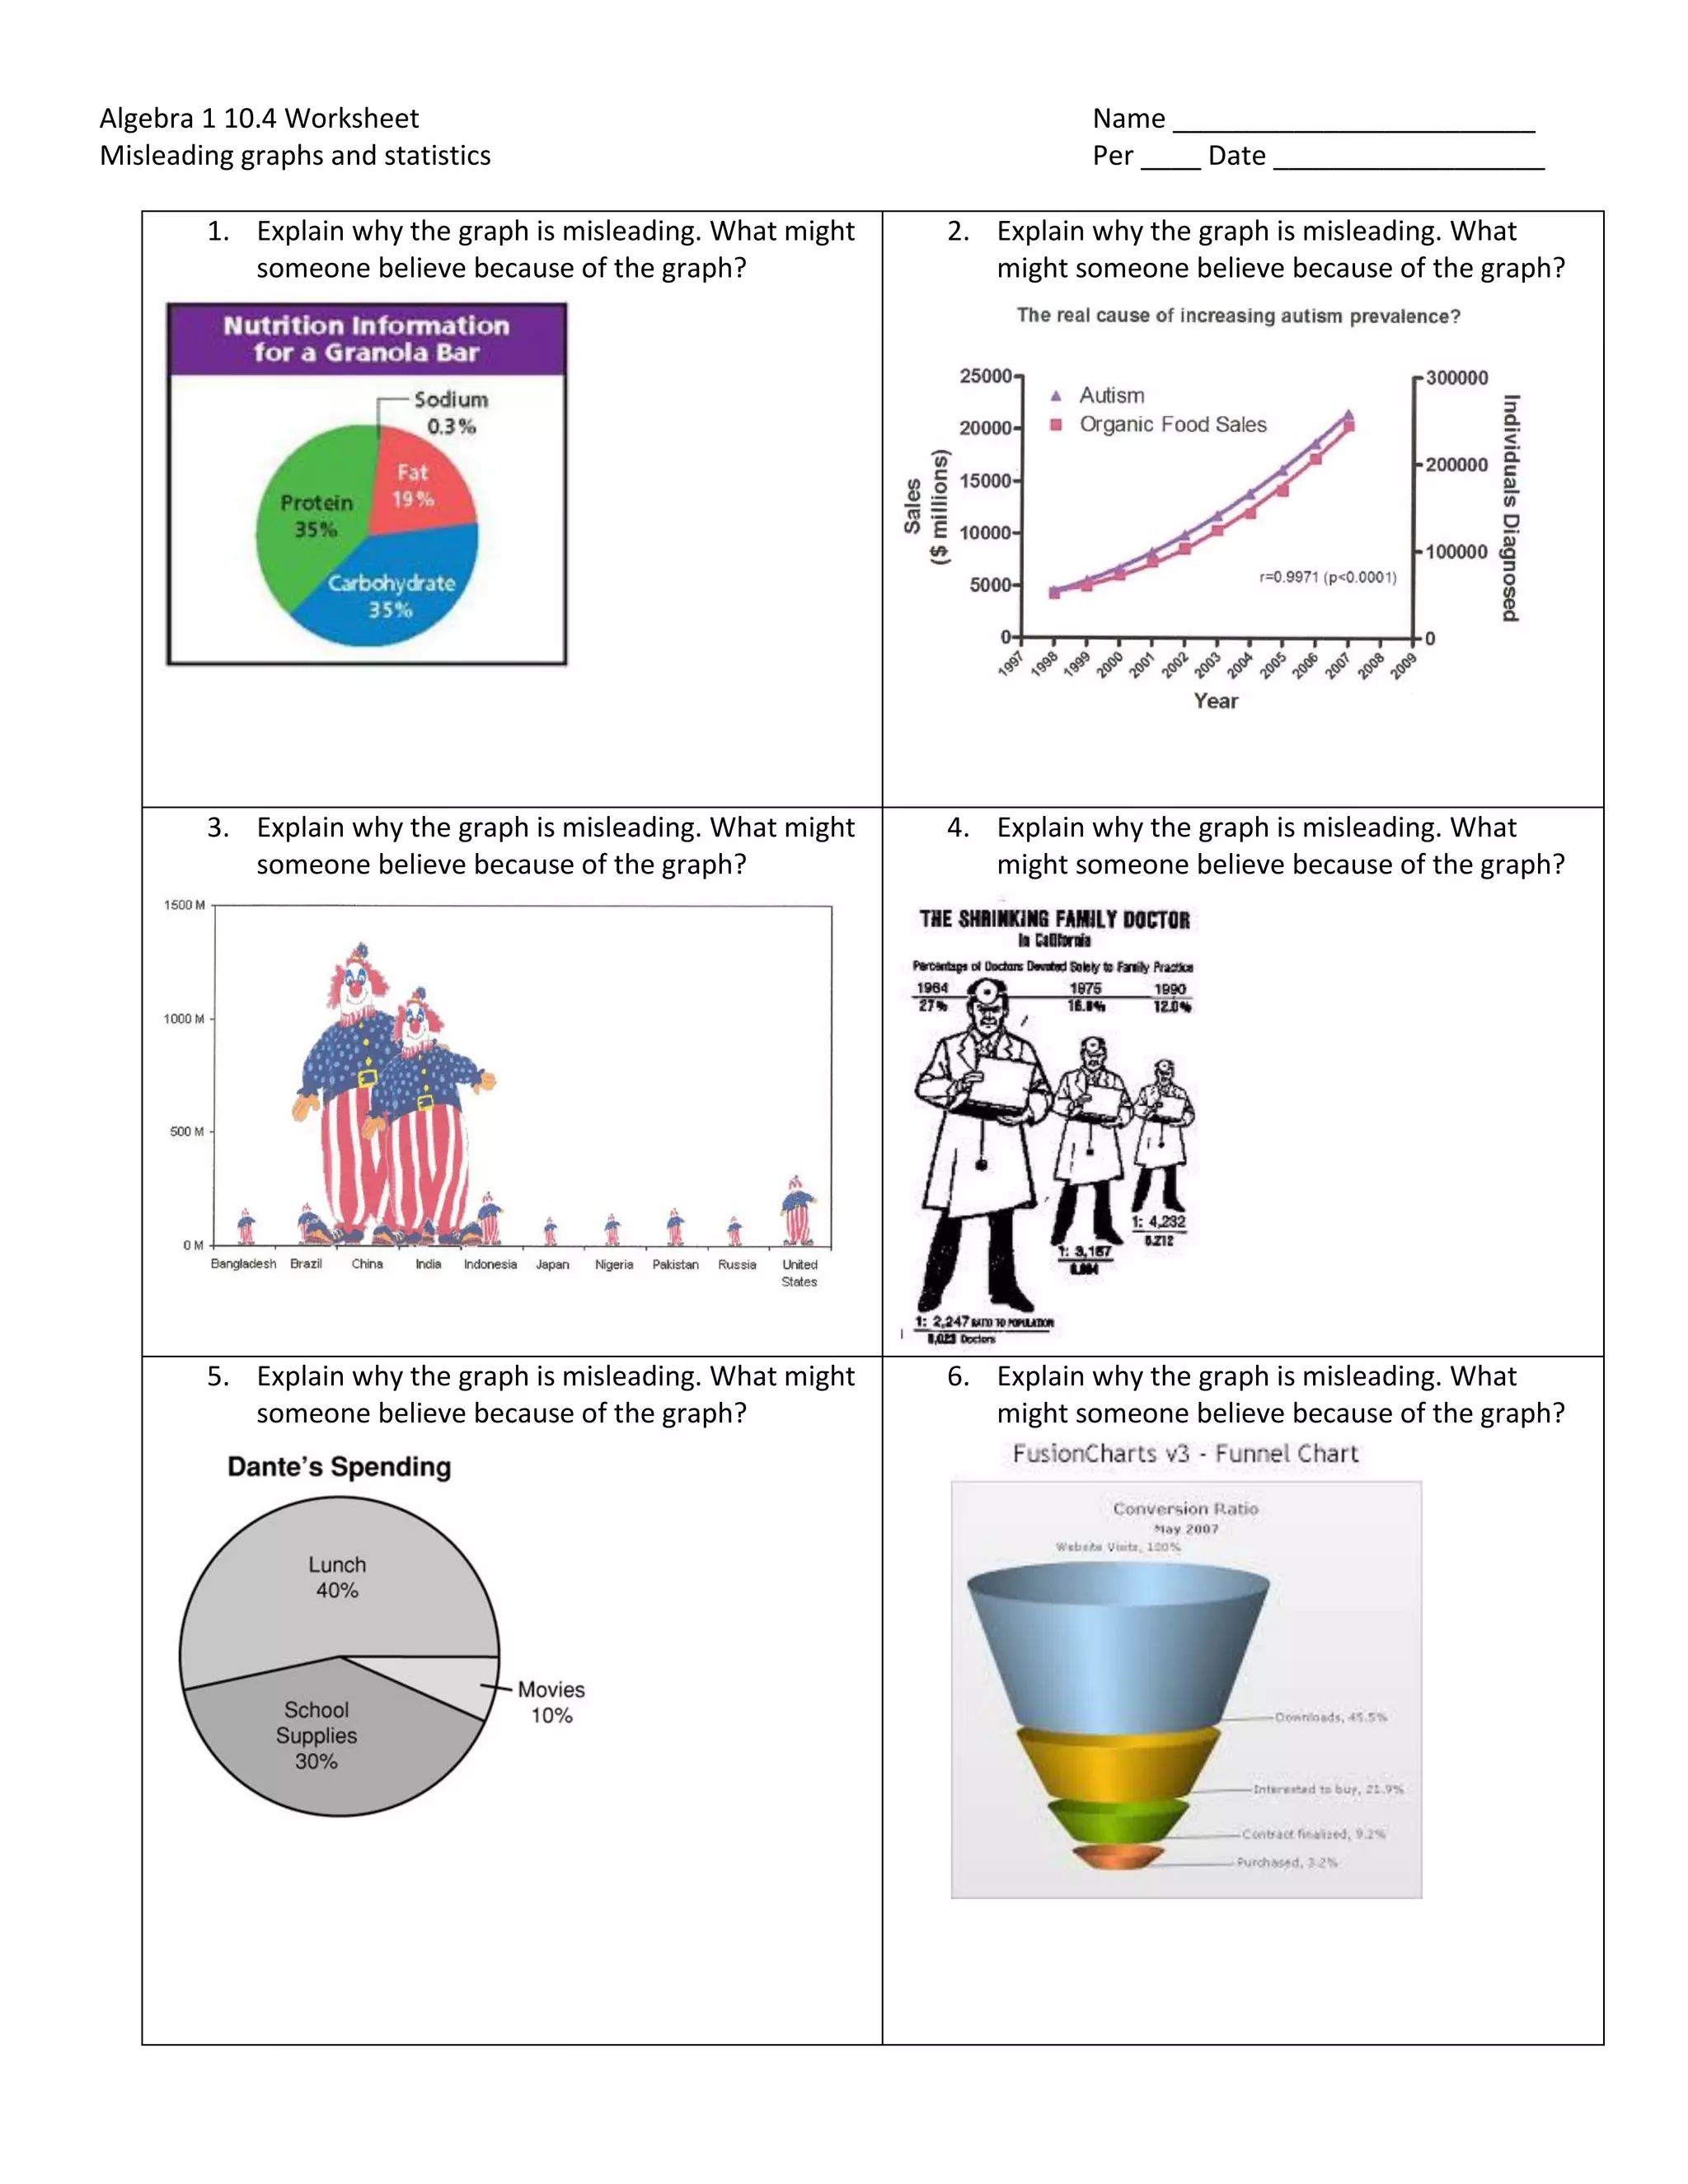
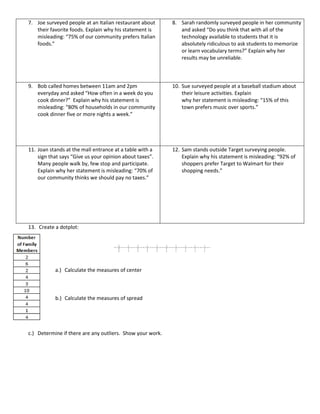
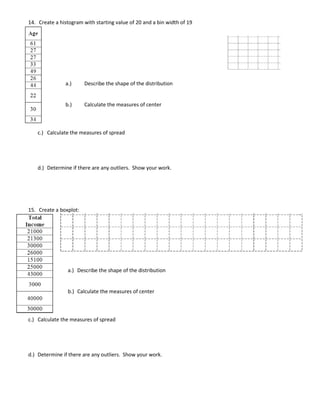
Algebra 1 10.4 Worksheet Name ________________________
Misleading graphs and statistics Per ____ Date __________________
1. Explain why the graph is misleading. What might
someone believe because of the graph?
2. Explain why the graph is misleading. What
might someone believe because of the graph?
3. Explain why the graph is misleading. What might
someone believe because of the graph?
4. Explain why the graph is misleading. What
might someone believe because of the graph?
5. Explain why the graph is misleading. What might
someone believe because of the graph?
6. Explain why the graph is misleading. What
might someone believe because of the graph?
7. Joe surveyed people at an Italian restaurant about
their favorite foods. Explain why his statement is
misleading: “75% of our community prefers Italian
foods.”
8. Sarah randomly surveyed people in her community
and asked “Do you think that with all of the
technology available to students that it is
absolutely ridiculous to ask students to memorize
or learn vocabulary terms?” Explain why her
results may be unreliable.
9. Bob called homes between 11am and 2pm
everyday and asked “How often in a week do you
cook dinner?” Explain why his statement is
misleading: “80% of households in our community
cook dinner five or more nights a week.”
10. Sue surveyed people at a baseball stadium about
their leisure activities. Explain
why her statement is misleading: “15% of this
town prefers music over sports.”
11. Joan stands at the mall entrance at a table with a
sign that says “Give us your opinion about taxes”.
Many people walk by, few stop and participate.
Explain why her statement is misleading: “70% of
our community thinks we should pay no taxes.”
12. Sam stands outside Target surveying people.
Explain why his statement is misleading: “92% of
shoppers prefer Target to Walmart for their
shopping needs.”
13. Create a dotplot:
a.) Calculate the measures of center
b.) Calculate the measures of spread
c.) Determine if there are any outliers. Show your work.
14. Create a histogram with starting value of 20 and a bin width of 19
a.) Describe the shape of the distribution
b.) Calculate the measures of center
c.) Calculate the measures of spread
d.) Determine if there are any outliers. Show your work.
15. Create a boxplot:
a.) Describe the shape of the distribution
b.) Calculate the measures of center
c.) Calculate the measures of spread
d.) Determine if there are any outliers. Show your work.

Alg 10 4 worksheet

  • 1.
    Algebra 1 10.4Worksheet Name ________________________ Misleading graphs and statistics Per ____ Date __________________ 1. Explain why the graph is misleading. What might someone believe because of the graph? 2. Explain why the graph is misleading. What might someone believe because of the graph? 3. Explain why the graph is misleading. What might someone believe because of the graph? 4. Explain why the graph is misleading. What might someone believe because of the graph? 5. Explain why the graph is misleading. What might someone believe because of the graph? 6. Explain why the graph is misleading. What might someone believe because of the graph?
  • 2.
    7. Joe surveyedpeople at an Italian restaurant about their favorite foods. Explain why his statement is misleading: “75% of our community prefers Italian foods.” 8. Sarah randomly surveyed people in her community and asked “Do you think that with all of the technology available to students that it is absolutely ridiculous to ask students to memorize or learn vocabulary terms?” Explain why her results may be unreliable. 9. Bob called homes between 11am and 2pm everyday and asked “How often in a week do you cook dinner?” Explain why his statement is misleading: “80% of households in our community cook dinner five or more nights a week.” 10. Sue surveyed people at a baseball stadium about their leisure activities. Explain why her statement is misleading: “15% of this town prefers music over sports.” 11. Joan stands at the mall entrance at a table with a sign that says “Give us your opinion about taxes”. Many people walk by, few stop and participate. Explain why her statement is misleading: “70% of our community thinks we should pay no taxes.” 12. Sam stands outside Target surveying people. Explain why his statement is misleading: “92% of shoppers prefer Target to Walmart for their shopping needs.” 13. Create a dotplot: a.) Calculate the measures of center b.) Calculate the measures of spread c.) Determine if there are any outliers. Show your work.
  • 3.
    14. Create ahistogram with starting value of 20 and a bin width of 19 a.) Describe the shape of the distribution b.) Calculate the measures of center c.) Calculate the measures of spread d.) Determine if there are any outliers. Show your work. 15. Create a boxplot: a.) Describe the shape of the distribution b.) Calculate the measures of center c.) Calculate the measures of spread d.) Determine if there are any outliers. Show your work.