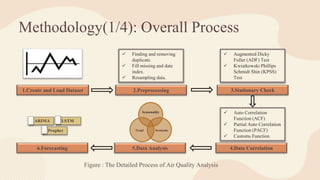
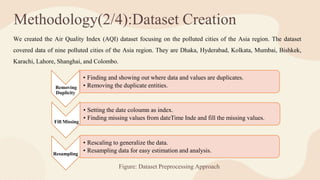
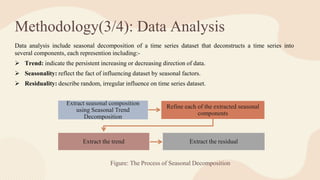
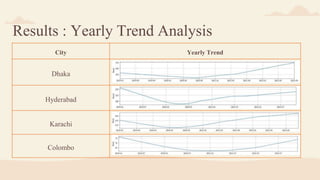
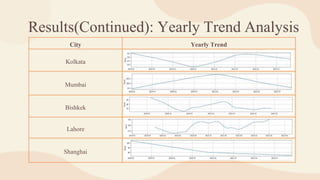
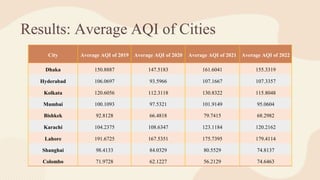
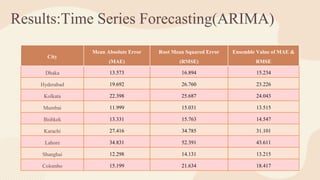
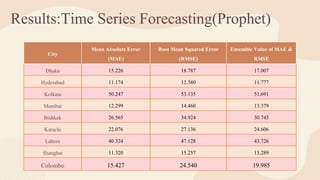
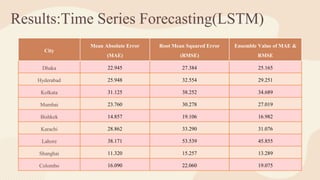
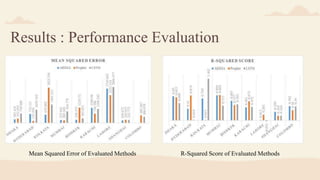
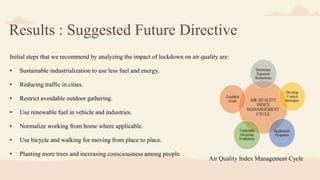
SlideShare a Scribd company logo
1 of 18
Air Quality Forecasting and Impact
of Lockdown Using Time Series
Analysis
Supervised By:
Dr. Iqbal Ahmed
Professor
Department of Computer Science
& Engineering
University of Chittagong
Submitted By
Tamanna Akther Mukta
ID:16701072
Session: MS 2019-2020
Problem Statement
● Increasing air pollution causes a risk to heart and respiratory disease such
as asthma, emphysema, COPD etc.
● Air pollution pose a serious threat to the ecosystem and to the health of all
living creatures.
● Life quality is lowered by poor air quality and pollutants in the air irritate
people.
The air quality index (AQI) indicates how polluted the air of a region or area.
Because of COVID-19 guidelines and regulations, we saw a change in air
quality. By analyzing the AQI data from that phase, we can acquire knowledge
to reduce air pollution and improve air quality.
Motivation
We deal with the collection of historical data of Air Quality Iindex from 2019 to 2022 to analysis the effect of
COVID. By using this analysis we can find out which step should we take to improve air quality in different cities
and what will be our next step to control pollution.
In this research we mainly focus on
• Collecting air quality index data of different cities to analyze air pollution.
• Analyzing the effect of COVID-19 guidelines and regulations on air quality.
• Using statistics to show the changes in air quality.
• Developing methods that can properly forecast the air quality data.
• Suggesting different ways to reduce air pollution using the knowledge acquired from analyzing the data.
Related Works
Authors Contributions Findings
Wang et al.(2018) Early warning system based on fuzzy time series
Forecast the major air pollutants with forecasting
accuracy, robustness, and stability.
Du et al. (2019)
The Deep Air Quality Forecasting Framework
(DAQFF), a framework that uses a hybrid deep
learning model.
Address the dynamic, spatial-temporal, and
nonlinear properties of multivariate air quality time
series data, as an end-to-end model for the air
quality forecasting problem
Espinosa et al.(2021)
Time series forecasting based multi-criteria
methodology. Reliable predictions of the
concentrations of pollutants in the air.
Reliable predictions of the concentrations of
pollutants in the air.
Dey et al.(2022)
Counterfactual time series analysis based on
SARIMA model.
Determine the degree of air pollution reduction
achieved after state-level emergency declarations
focusing on the regional elements
Gao et al.(2022) Analysis of a spatiotemporal model
Provide the spillover and the effect of covid 19
lockdown policy on the concentration of PM2.5 in
Wuhan city.
Methodology(1/4): Overall Process
1.Create and Load Dataset 2.Preprocessing
5.Data Analysis
6.Forecasting 4.Data Correlation
3.Stationary Check
 Finding and removing
duplicate.
 Fill missing and date
index.
 Resampling data.
Seasonality
Residuality
Trend
 Augmented Dicky
Fuller (ADF) Test
 Kwiatkowski Phillips
Schmidt Shin (KPSS)
Test
 Auto Correlation
Function (ACF)
 Partial Auto Correlation
Function (PACF)
 Customs Function
ARIMA LSTM
Prophet
Figure : The Detailed Process of Air Quality Analysis
Methodology(2/4):Dataset Creation
Removing
Duplicity
• Finding and showing out where data and values are duplicates.
• Removing the duplicate entities.
Fill Missing
• Setting the date coloumn as index.
• Finding missing values from dateTime Inde and fill the missing values.
Resampling
• Rescaling to generalize the data.
• Resampling data for easy estimation and analysis.
We created the Air Quality Index (AQI) dataset focusing on the polluted cities of the Asia region. The dataset
covered data of nine polluted cities of the Asia region. They are Dhaka, Hyderabad, Kolkata, Mumbai, Bishkek,
Karachi, Lahore, Shanghai, and Colombo.
Figure: Dataset Preprocessing Approach
Methodology(3/4): Data Analysis
Data analysis include seasonal decomposition of a time series dataset that deconstructs a time series into
several components, each represention including:-
 Trend: indicate the persistent increasing or decreasing direction of data.
 Seasonality: reflect the fact of influencing dataset by seasonal factors.
 Residuality: describe random, irregular influence on time series dataset.
Extract seasonal composition
using Seasonal Trend
Decomposition
Refine each of the extracted seasonal
components
Extract the trend Extract the residual
Figure: The Process of Seasonal Decomposition
Methodology(4/4): Time Series Forecasting
Time series forecasting means predicting new values according to time. For forecasting three methods
have used:
1. ARIMA
2. Prophet
3. LSTM
The performance of these methods is evaluated by using four evolution measures. They are:
• Mean Absolute Error (MAE)
• Root Mean Squared Error (RMSE)
• Mean Squared Error (MSE)
• R-Squared Score
By analysing the perfomance of forecasting methods, we choose the best method according to overall
perfomace of all methods.
Results : Yearly Trend Analysis
City Yearly Trend
Dhaka
Hyderabad
Karachi
Colombo
Results(Continued): Yearly Trend Analysis
City Yearly Trend
Kolkata
Mumbai
Bishkek
Lahore
Shanghai
Results: Average AQI of Cities
City Average AQI of 2019 Average AQI of 2020 Average AQI of 2021 Average AQI of 2022
Dhaka 150.8887 147.5183 161.6041 155.3319
Hyderabad 106.0697 93.5966 107.1667 107.3357
Kolkata 120.6056 112.3118 130.8322 115.8048
Mumbai 100.1093 97.5321 101.9149 95.0604
Bishkek 92.8128 66.4818 79.7415 68.2982
Karachi 104.2375 108.6347 123.1184 120.2162
Lahore 191.6725 167.5351 175.7395 179.4114
Shanghai 98.4133 84.0329 80.5529 74.8137
Colombo 71.9728 62.1227 56.2129 74.6463
Results:Time Series Forecasting(ARIMA)
City
Mean Absolute Error
(MAE)
Root Mean Squared Error
(RMSE)
Ensemble Value of MAE &
RMSE
Dhaka 13.573 16.894 15.234
Hyderabad 19.692 26.760 23.226
Kolkata 22.398 25.687 24.043
Mumbai 11.999 15.031 13.515
Bishkek 13.331 15.763 14.547
Karachi 27.416 34.785 31.101
Lahore 34.831 52.391 43.611
Shanghai 12.298 14.131 13.215
Colombo 15.199 21.634 18.417
Results:Time Series Forecasting(Prophet)
City
Mean Absolute Error
(MAE)
Root Mean Squared Error
(RMSE)
Ensemble Value of MAE &
RMSE
Dhaka 15.226 18.787 17.007
Hyderabad 11.174 12.380 11.777
Kolkata 50.247 53.135 51.691
Mumbai 12.299 14.460 13.379
Bishkek 26.565 34.924 30.745
Karachi 22.076 27.136 24.606
Lahore 40.324 47.128 43.726
Shanghai 11.320 15.257 13.289
Colombo 15.427 24.540 19.985
Results:Time Series Forecasting(LSTM)
City
Mean Absolute Error
(MAE)
Root Mean Squared Error
(RMSE)
Ensemble Value of MAE &
RMSE
Dhaka 22.945 27.384 25.165
Hyderabad 25.948 32.554 29.251
Kolkata 31.125 38.252 34.689
Mumbai 23.760 30.278 27.019
Bishkek 14.857 19.106 16.982
Karachi 28.862 33.290 31.076
Lahore 38.171 53.539 45.855
Shanghai 11.320 15.257 13.289
Colombo 16.090 22.060 19.075
Results : Performance Evaluation
Mean Squared Error of Evaluated Methods R-Squared Score of Evaluated Methods
Results : Suggested Future Directive
Initial steps that we recommend by analyzing the impact of lockdown on air quality are:
• Sustainable industrialization to use less fuel and energy.
• Reducing traffic in cities.
• Restrict avoidable outdoor gathering.
• Use renewable fuel in vehicle and industries.
• Normalize working from home where applicable.
• Use bicycle and walking for moving from place to place.
• Planting more trees and increasing consciousness among people.
Air Quality Index Management Cycle
Conclusion & Future Works
In this research, we focus on:
 Air quality analysis using time series to determine how COVID-19 has
affected the air quality of the environment.
 Develop the dataset that captures the air quality index of four years to
analysisi the changing air quality.
 Using evolutional measures to find out how effective the models are.
 Forecasting to make estimations on how the air quality index will be.
This work can be continued with
 Use cross validation to develop better evolution metrics.
 Ensamble evolution errors to compare AQI.
 Comparing COVID-19 AQI with ground values.
Thank You

More Related Content

Similar to air quality index forecasting using time series analysis.pptx

Atmospheric Pollutant Concentration Prediction Based on KPCA BP
Atmospheric Pollutant Concentration Prediction Based on KPCA BPAtmospheric Pollutant Concentration Prediction Based on KPCA BP
Atmospheric Pollutant Concentration Prediction Based on KPCA BP
ijtsrd
 

Similar to air quality index forecasting using time series analysis.pptx (20)

AN EXTENDED SPATIO-TEMPORAL GRANGER CAUSALITY MODEL FOR AIR QUALITY ESTIMATIO...
AN EXTENDED SPATIO-TEMPORAL GRANGER CAUSALITY MODEL FOR AIR QUALITY ESTIMATIO...AN EXTENDED SPATIO-TEMPORAL GRANGER CAUSALITY MODEL FOR AIR QUALITY ESTIMATIO...
AN EXTENDED SPATIO-TEMPORAL GRANGER CAUSALITY MODEL FOR AIR QUALITY ESTIMATIO...
 
A Classification Urban Precinct Ventilation Zones using Key Indicators of Spa...
A Classification Urban Precinct Ventilation Zones using Key Indicators of Spa...A Classification Urban Precinct Ventilation Zones using Key Indicators of Spa...
A Classification Urban Precinct Ventilation Zones using Key Indicators of Spa...
 
Forecasting Municipal Solid Waste Generation Using a Multiple Linear Regressi...
Forecasting Municipal Solid Waste Generation Using a Multiple Linear Regressi...Forecasting Municipal Solid Waste Generation Using a Multiple Linear Regressi...
Forecasting Municipal Solid Waste Generation Using a Multiple Linear Regressi...
 
BJLP45-paper1_+Linear+Vs+Logistic.pdf
BJLP45-paper1_+Linear+Vs+Logistic.pdfBJLP45-paper1_+Linear+Vs+Logistic.pdf
BJLP45-paper1_+Linear+Vs+Logistic.pdf
 
ONLINE SCALABLE SVM ENSEMBLE LEARNING METHOD (OSSELM) FOR SPATIO-TEMPORAL AIR...
ONLINE SCALABLE SVM ENSEMBLE LEARNING METHOD (OSSELM) FOR SPATIO-TEMPORAL AIR...ONLINE SCALABLE SVM ENSEMBLE LEARNING METHOD (OSSELM) FOR SPATIO-TEMPORAL AIR...
ONLINE SCALABLE SVM ENSEMBLE LEARNING METHOD (OSSELM) FOR SPATIO-TEMPORAL AIR...
 
ONLINE SCALABLE SVM ENSEMBLE LEARNING METHOD (OSSELM) FOR SPATIO-TEMPORAL AIR...
ONLINE SCALABLE SVM ENSEMBLE LEARNING METHOD (OSSELM) FOR SPATIO-TEMPORAL AIR...ONLINE SCALABLE SVM ENSEMBLE LEARNING METHOD (OSSELM) FOR SPATIO-TEMPORAL AIR...
ONLINE SCALABLE SVM ENSEMBLE LEARNING METHOD (OSSELM) FOR SPATIO-TEMPORAL AIR...
 
Air Pollution Indices.pptx
Air Pollution Indices.pptxAir Pollution Indices.pptx
Air Pollution Indices.pptx
 
Final Report.pdf
Final Report.pdfFinal Report.pdf
Final Report.pdf
 
Implementation of Integration VaaMSN and SEMAR for Wide Coverage Air Quality ...
Implementation of Integration VaaMSN and SEMAR for Wide Coverage Air Quality ...Implementation of Integration VaaMSN and SEMAR for Wide Coverage Air Quality ...
Implementation of Integration VaaMSN and SEMAR for Wide Coverage Air Quality ...
 
IRJET - Air Quality Index – A Study to Assess the Air Quality
IRJET - Air Quality Index – A Study to Assess the Air QualityIRJET - Air Quality Index – A Study to Assess the Air Quality
IRJET - Air Quality Index – A Study to Assess the Air Quality
 
Air Quality Study on measeurement tools.pptx
Air Quality Study on measeurement tools.pptxAir Quality Study on measeurement tools.pptx
Air Quality Study on measeurement tools.pptx
 
IRJET- Study on Vehicular Emission in Trivandrum Urban Centre
IRJET- Study on Vehicular Emission in Trivandrum Urban CentreIRJET- Study on Vehicular Emission in Trivandrum Urban Centre
IRJET- Study on Vehicular Emission in Trivandrum Urban Centre
 
EIA TECHNIQUES.pptx
EIA TECHNIQUES.pptxEIA TECHNIQUES.pptx
EIA TECHNIQUES.pptx
 
Air Quality Visualization
Air Quality VisualizationAir Quality Visualization
Air Quality Visualization
 
Atmospheric Pollutant Concentration Prediction Based on KPCA BP
Atmospheric Pollutant Concentration Prediction Based on KPCA BPAtmospheric Pollutant Concentration Prediction Based on KPCA BP
Atmospheric Pollutant Concentration Prediction Based on KPCA BP
 
Forecasting cost and schedule performance
Forecasting cost and schedule performanceForecasting cost and schedule performance
Forecasting cost and schedule performance
 
EffectiveOcclusion Handling for Fast Correlation Filter-based Trackers
EffectiveOcclusion Handling for Fast Correlation Filter-based TrackersEffectiveOcclusion Handling for Fast Correlation Filter-based Trackers
EffectiveOcclusion Handling for Fast Correlation Filter-based Trackers
 
AQI OLS Model.pptx
AQI OLS Model.pptxAQI OLS Model.pptx
AQI OLS Model.pptx
 
Climate Visibility Prediction Using Machine Learning
Climate Visibility Prediction Using Machine LearningClimate Visibility Prediction Using Machine Learning
Climate Visibility Prediction Using Machine Learning
 

Recently uploaded

1_Introduction + EAM Vocabulary + how to navigate in EAM.pdf
1_Introduction + EAM Vocabulary + how to navigate in EAM.pdf1_Introduction + EAM Vocabulary + how to navigate in EAM.pdf
1_Introduction + EAM Vocabulary + how to navigate in EAM.pdf
AldoGarca30
 
Kuwait City MTP kit ((+919101817206)) Buy Abortion Pills Kuwait
Kuwait City MTP kit ((+919101817206)) Buy Abortion Pills KuwaitKuwait City MTP kit ((+919101817206)) Buy Abortion Pills Kuwait
Kuwait City MTP kit ((+919101817206)) Buy Abortion Pills Kuwait
jaanualu31
 
Integrated Test Rig For HTFE-25 - Neometrix
Integrated Test Rig For HTFE-25 - NeometrixIntegrated Test Rig For HTFE-25 - Neometrix
Integrated Test Rig For HTFE-25 - Neometrix
Neometrix_Engineering_Pvt_Ltd
 
Hospital management system project report.pdf
Hospital management system project report.pdfHospital management system project report.pdf
Hospital management system project report.pdf
Kamal Acharya
 
Verification of thevenin's theorem for BEEE Lab (1).pptx
Verification of thevenin's theorem for BEEE Lab (1).pptxVerification of thevenin's theorem for BEEE Lab (1).pptx
Verification of thevenin's theorem for BEEE Lab (1).pptx
chumtiyababu
 
DeepFakes presentation : brief idea of DeepFakes
DeepFakes presentation : brief idea of DeepFakesDeepFakes presentation : brief idea of DeepFakes
DeepFakes presentation : brief idea of DeepFakes
MayuraD1
 

Recently uploaded (20)

1_Introduction + EAM Vocabulary + how to navigate in EAM.pdf
1_Introduction + EAM Vocabulary + how to navigate in EAM.pdf1_Introduction + EAM Vocabulary + how to navigate in EAM.pdf
1_Introduction + EAM Vocabulary + how to navigate in EAM.pdf
 
Navigating Complexity: The Role of Trusted Partners and VIAS3D in Dassault Sy...
Navigating Complexity: The Role of Trusted Partners and VIAS3D in Dassault Sy...Navigating Complexity: The Role of Trusted Partners and VIAS3D in Dassault Sy...
Navigating Complexity: The Role of Trusted Partners and VIAS3D in Dassault Sy...
 
Unleashing the Power of the SORA AI lastest leap
Unleashing the Power of the SORA AI lastest leapUnleashing the Power of the SORA AI lastest leap
Unleashing the Power of the SORA AI lastest leap
 
COST-EFFETIVE and Energy Efficient BUILDINGS ptx
COST-EFFETIVE  and Energy Efficient BUILDINGS ptxCOST-EFFETIVE  and Energy Efficient BUILDINGS ptx
COST-EFFETIVE and Energy Efficient BUILDINGS ptx
 
data_management_and _data_science_cheat_sheet.pdf
data_management_and _data_science_cheat_sheet.pdfdata_management_and _data_science_cheat_sheet.pdf
data_management_and _data_science_cheat_sheet.pdf
 
Kuwait City MTP kit ((+919101817206)) Buy Abortion Pills Kuwait
Kuwait City MTP kit ((+919101817206)) Buy Abortion Pills KuwaitKuwait City MTP kit ((+919101817206)) Buy Abortion Pills Kuwait
Kuwait City MTP kit ((+919101817206)) Buy Abortion Pills Kuwait
 
Unit 4_Part 1 CSE2001 Exception Handling and Function Template and Class Temp...
Unit 4_Part 1 CSE2001 Exception Handling and Function Template and Class Temp...Unit 4_Part 1 CSE2001 Exception Handling and Function Template and Class Temp...
Unit 4_Part 1 CSE2001 Exception Handling and Function Template and Class Temp...
 
Integrated Test Rig For HTFE-25 - Neometrix
Integrated Test Rig For HTFE-25 - NeometrixIntegrated Test Rig For HTFE-25 - Neometrix
Integrated Test Rig For HTFE-25 - Neometrix
 
Employee leave management system project.
Employee leave management system project.Employee leave management system project.
Employee leave management system project.
 
DC MACHINE-Motoring and generation, Armature circuit equation
DC MACHINE-Motoring and generation, Armature circuit equationDC MACHINE-Motoring and generation, Armature circuit equation
DC MACHINE-Motoring and generation, Armature circuit equation
 
Hospital management system project report.pdf
Hospital management system project report.pdfHospital management system project report.pdf
Hospital management system project report.pdf
 
Thermal Engineering -unit - III & IV.ppt
Thermal Engineering -unit - III & IV.pptThermal Engineering -unit - III & IV.ppt
Thermal Engineering -unit - III & IV.ppt
 
Engineering Drawing focus on projection of planes
Engineering Drawing focus on projection of planesEngineering Drawing focus on projection of planes
Engineering Drawing focus on projection of planes
 
Verification of thevenin's theorem for BEEE Lab (1).pptx
Verification of thevenin's theorem for BEEE Lab (1).pptxVerification of thevenin's theorem for BEEE Lab (1).pptx
Verification of thevenin's theorem for BEEE Lab (1).pptx
 
DeepFakes presentation : brief idea of DeepFakes
DeepFakes presentation : brief idea of DeepFakesDeepFakes presentation : brief idea of DeepFakes
DeepFakes presentation : brief idea of DeepFakes
 
GEAR TRAIN- BASIC CONCEPTS AND WORKING PRINCIPLE
GEAR TRAIN- BASIC CONCEPTS AND WORKING PRINCIPLEGEAR TRAIN- BASIC CONCEPTS AND WORKING PRINCIPLE
GEAR TRAIN- BASIC CONCEPTS AND WORKING PRINCIPLE
 
Orlando’s Arnold Palmer Hospital Layout Strategy-1.pptx
Orlando’s Arnold Palmer Hospital Layout Strategy-1.pptxOrlando’s Arnold Palmer Hospital Layout Strategy-1.pptx
Orlando’s Arnold Palmer Hospital Layout Strategy-1.pptx
 
Online food ordering system project report.pdf
Online food ordering system project report.pdfOnline food ordering system project report.pdf
Online food ordering system project report.pdf
 
Tamil Call Girls Bhayandar WhatsApp +91-9930687706, Best Service
Tamil Call Girls Bhayandar WhatsApp +91-9930687706, Best ServiceTamil Call Girls Bhayandar WhatsApp +91-9930687706, Best Service
Tamil Call Girls Bhayandar WhatsApp +91-9930687706, Best Service
 
FEA Based Level 3 Assessment of Deformed Tanks with Fluid Induced Loads
FEA Based Level 3 Assessment of Deformed Tanks with Fluid Induced LoadsFEA Based Level 3 Assessment of Deformed Tanks with Fluid Induced Loads
FEA Based Level 3 Assessment of Deformed Tanks with Fluid Induced Loads
 

air quality index forecasting using time series analysis.pptx

  • 1. Air Quality Forecasting and Impact of Lockdown Using Time Series Analysis Supervised By: Dr. Iqbal Ahmed Professor Department of Computer Science & Engineering University of Chittagong Submitted By Tamanna Akther Mukta ID:16701072 Session: MS 2019-2020
  • 2. Problem Statement ● Increasing air pollution causes a risk to heart and respiratory disease such as asthma, emphysema, COPD etc. ● Air pollution pose a serious threat to the ecosystem and to the health of all living creatures. ● Life quality is lowered by poor air quality and pollutants in the air irritate people. The air quality index (AQI) indicates how polluted the air of a region or area. Because of COVID-19 guidelines and regulations, we saw a change in air quality. By analyzing the AQI data from that phase, we can acquire knowledge to reduce air pollution and improve air quality.
  • 3. Motivation We deal with the collection of historical data of Air Quality Iindex from 2019 to 2022 to analysis the effect of COVID. By using this analysis we can find out which step should we take to improve air quality in different cities and what will be our next step to control pollution. In this research we mainly focus on • Collecting air quality index data of different cities to analyze air pollution. • Analyzing the effect of COVID-19 guidelines and regulations on air quality. • Using statistics to show the changes in air quality. • Developing methods that can properly forecast the air quality data. • Suggesting different ways to reduce air pollution using the knowledge acquired from analyzing the data.
  • 4. Related Works Authors Contributions Findings Wang et al.(2018) Early warning system based on fuzzy time series Forecast the major air pollutants with forecasting accuracy, robustness, and stability. Du et al. (2019) The Deep Air Quality Forecasting Framework (DAQFF), a framework that uses a hybrid deep learning model. Address the dynamic, spatial-temporal, and nonlinear properties of multivariate air quality time series data, as an end-to-end model for the air quality forecasting problem Espinosa et al.(2021) Time series forecasting based multi-criteria methodology. Reliable predictions of the concentrations of pollutants in the air. Reliable predictions of the concentrations of pollutants in the air. Dey et al.(2022) Counterfactual time series analysis based on SARIMA model. Determine the degree of air pollution reduction achieved after state-level emergency declarations focusing on the regional elements Gao et al.(2022) Analysis of a spatiotemporal model Provide the spillover and the effect of covid 19 lockdown policy on the concentration of PM2.5 in Wuhan city.
  • 5. Methodology(1/4): Overall Process 1.Create and Load Dataset 2.Preprocessing 5.Data Analysis 6.Forecasting 4.Data Correlation 3.Stationary Check  Finding and removing duplicate.  Fill missing and date index.  Resampling data. Seasonality Residuality Trend  Augmented Dicky Fuller (ADF) Test  Kwiatkowski Phillips Schmidt Shin (KPSS) Test  Auto Correlation Function (ACF)  Partial Auto Correlation Function (PACF)  Customs Function ARIMA LSTM Prophet Figure : The Detailed Process of Air Quality Analysis
  • 6. Methodology(2/4):Dataset Creation Removing Duplicity • Finding and showing out where data and values are duplicates. • Removing the duplicate entities. Fill Missing • Setting the date coloumn as index. • Finding missing values from dateTime Inde and fill the missing values. Resampling • Rescaling to generalize the data. • Resampling data for easy estimation and analysis. We created the Air Quality Index (AQI) dataset focusing on the polluted cities of the Asia region. The dataset covered data of nine polluted cities of the Asia region. They are Dhaka, Hyderabad, Kolkata, Mumbai, Bishkek, Karachi, Lahore, Shanghai, and Colombo. Figure: Dataset Preprocessing Approach
  • 7. Methodology(3/4): Data Analysis Data analysis include seasonal decomposition of a time series dataset that deconstructs a time series into several components, each represention including:-  Trend: indicate the persistent increasing or decreasing direction of data.  Seasonality: reflect the fact of influencing dataset by seasonal factors.  Residuality: describe random, irregular influence on time series dataset. Extract seasonal composition using Seasonal Trend Decomposition Refine each of the extracted seasonal components Extract the trend Extract the residual Figure: The Process of Seasonal Decomposition
  • 8. Methodology(4/4): Time Series Forecasting Time series forecasting means predicting new values according to time. For forecasting three methods have used: 1. ARIMA 2. Prophet 3. LSTM The performance of these methods is evaluated by using four evolution measures. They are: • Mean Absolute Error (MAE) • Root Mean Squared Error (RMSE) • Mean Squared Error (MSE) • R-Squared Score By analysing the perfomance of forecasting methods, we choose the best method according to overall perfomace of all methods.
  • 9. Results : Yearly Trend Analysis City Yearly Trend Dhaka Hyderabad Karachi Colombo
  • 10. Results(Continued): Yearly Trend Analysis City Yearly Trend Kolkata Mumbai Bishkek Lahore Shanghai
  • 11. Results: Average AQI of Cities City Average AQI of 2019 Average AQI of 2020 Average AQI of 2021 Average AQI of 2022 Dhaka 150.8887 147.5183 161.6041 155.3319 Hyderabad 106.0697 93.5966 107.1667 107.3357 Kolkata 120.6056 112.3118 130.8322 115.8048 Mumbai 100.1093 97.5321 101.9149 95.0604 Bishkek 92.8128 66.4818 79.7415 68.2982 Karachi 104.2375 108.6347 123.1184 120.2162 Lahore 191.6725 167.5351 175.7395 179.4114 Shanghai 98.4133 84.0329 80.5529 74.8137 Colombo 71.9728 62.1227 56.2129 74.6463
  • 12. Results:Time Series Forecasting(ARIMA) City Mean Absolute Error (MAE) Root Mean Squared Error (RMSE) Ensemble Value of MAE & RMSE Dhaka 13.573 16.894 15.234 Hyderabad 19.692 26.760 23.226 Kolkata 22.398 25.687 24.043 Mumbai 11.999 15.031 13.515 Bishkek 13.331 15.763 14.547 Karachi 27.416 34.785 31.101 Lahore 34.831 52.391 43.611 Shanghai 12.298 14.131 13.215 Colombo 15.199 21.634 18.417
  • 13. Results:Time Series Forecasting(Prophet) City Mean Absolute Error (MAE) Root Mean Squared Error (RMSE) Ensemble Value of MAE & RMSE Dhaka 15.226 18.787 17.007 Hyderabad 11.174 12.380 11.777 Kolkata 50.247 53.135 51.691 Mumbai 12.299 14.460 13.379 Bishkek 26.565 34.924 30.745 Karachi 22.076 27.136 24.606 Lahore 40.324 47.128 43.726 Shanghai 11.320 15.257 13.289 Colombo 15.427 24.540 19.985
  • 14. Results:Time Series Forecasting(LSTM) City Mean Absolute Error (MAE) Root Mean Squared Error (RMSE) Ensemble Value of MAE & RMSE Dhaka 22.945 27.384 25.165 Hyderabad 25.948 32.554 29.251 Kolkata 31.125 38.252 34.689 Mumbai 23.760 30.278 27.019 Bishkek 14.857 19.106 16.982 Karachi 28.862 33.290 31.076 Lahore 38.171 53.539 45.855 Shanghai 11.320 15.257 13.289 Colombo 16.090 22.060 19.075
  • 15. Results : Performance Evaluation Mean Squared Error of Evaluated Methods R-Squared Score of Evaluated Methods
  • 16. Results : Suggested Future Directive Initial steps that we recommend by analyzing the impact of lockdown on air quality are: • Sustainable industrialization to use less fuel and energy. • Reducing traffic in cities. • Restrict avoidable outdoor gathering. • Use renewable fuel in vehicle and industries. • Normalize working from home where applicable. • Use bicycle and walking for moving from place to place. • Planting more trees and increasing consciousness among people. Air Quality Index Management Cycle
  • 17. Conclusion & Future Works In this research, we focus on:  Air quality analysis using time series to determine how COVID-19 has affected the air quality of the environment.  Develop the dataset that captures the air quality index of four years to analysisi the changing air quality.  Using evolutional measures to find out how effective the models are.  Forecasting to make estimations on how the air quality index will be. This work can be continued with  Use cross validation to develop better evolution metrics.  Ensamble evolution errors to compare AQI.  Comparing COVID-19 AQI with ground values.