Download to read offline
![Nmegbu Int. Journal of Engineering Research and Applications www.ijera.com
ISSN : 2248-9622, Vol. 4, Issue 6( Version 2), June 2014, pp.244-247
www.ijera.com 244 | P a g e
The Effect of Salt Concentration on Microbes during Microbial
Enhanced Oil Recovery
Nmegbu, Chukwuma Godwin Jacob*
*(Department of Petroleum Engineering,Rivers State University of Science and Technology, P.M.B 5080,
Nigeria)
ABSTRACT
Reservoir fluid salinity, its effectiveness on viscosity as well as temperature dependency is an important
parameter for enhanced oil recovery consideration. Previous studies on formation fluid properties focused on
NaCl and KCl, the two most common brines in connate water and in water-based drilling mud, failing, however,
to relate its performance to bacterial survival. This work has considered four different brine solutions and how it
will affect the useability of pseudomonas species and halobacterium H – 356. The bacterial mixture viscosity
shows a considerable difference between NaCl, CsCl, KCl and LiCl with NaCl and LiCl being favourable
brines. Hence, for flooding agent at varying temperature since it makes the bacteria mixture viscosity more
viscous whereas the KCl appeared less viscous compared to liquid mixture standard water. For the bacteria
mixture, the viscosity of KCl and CsCl decreases with the concentration of a low temperature range and
increases with the concentration at a high range.
Keywords-Bacteria Growth, MEOR, Salinity, Salt Concentration
I. INTRODUCTION
The Microbial enhanced oil recovery (MEOR) is
a mechanism that employs the use of microbes to
degrade or ferment hydrocarbons and produce by-
products such as surfactants, polymers, gases and
biofilms that are useful in the recovery of oil [1], [2].
Microbial methods for increasing oil recovery are
potentially cost effective even at relatively low crude
oil prices. They can be applied in a variety of ways
including permeability modification treatments and
microbial enhanced water flooding. The flexibility
and potential cost effectiveness of the technology
makes it attractive, but further understanding of the
transport mechanism and the development of a sound
engineering methodology for optimizing microbial
and injection strategies are needed to realize its
potential [3].
Wagner [4] presented a review on MEOR from
carbonate reservoirs with complex formation
characteristics. Adapted laboratory models showed a
25% decrease in water production and a three-fold
increment in oil production. Such laboratory marvels
have further propelled research in this field. The
industry remains reluctant, as usual, to accept this
new technology wholly.
The practical application of microbial culture to
subsurface oil reservoirs imposes several restrictions
on the microbial culture. The microbes must be able
to migrate, transported deep within the reservoir for
any in-situ applications to be of practical significance
to oil recovery. The microbes must remain
biologically active at elevated temperature and
pressure [5]. As such, microbes intended to be used
in petroleum reservoirs should be tested with
reservoir fluids at subsurface conditions of
temperature, pressure and salinity [5], [6].
The effectiveness of the microbes varies from
one formation to the other, often influenced by a host
of physical, biological and chemical constraints [5],
[7]. This was reaffirmed by Alireza et al when they
investigated the MEOR technique in fractured porous
media using etched-glass micro models [8]. They
found that the plugging of matrix-fracture interface
by an exopolymer is the main reason for the low
performance of the exopolymer producing bacterium.
The physical constraints include temperature,
pressure, pore geometry, whereas the biological
constraint is mainly enzymatic functions. Surface
charge, pH and salinity, amongst others, make up the
chemical constraints [9].
No doubt, different oil bearing formation waters
have a wide range of salinity often increasing with
depth. Ivanov and Belyaev [10] examined the
microbial flora of water injections and found that
bacterial oxidation of oil took place in the zone of
contact between the injected low-salinity waters and
stratal waters of the oilfield. Masahito et al. [11] in
their paper on the effects of salt concentration on
encystment induction in ciliated protozoan colpoa sp.
discovered that encystment was promoted by an
increase in the concentration of ions such as Ca2+
,
Na+
and K+
contained in the surrounding medium.
According to Collins [12], the highest concentrations
of minor cations that may interfere with microbial
systems are Lithium – 400 g/L, Barium –670 g/L,
RESEARCH ARTICLE OPEN ACCESS](https://image.slidesharecdn.com/ai04602244247-140816004413-phpapp01/85/Ai04602244247-1-320.jpg)
![Nmegbu Int. Journal of Engineering Research and Applications www.ijera.com
ISSN : 2248-9622, Vol. 4, Issue 6( Version 2), June 2014, pp.244-247
www.ijera.com 244 | P a g e
The Effect of Salt Concentration on Microbes during Microbial
Enhanced Oil Recovery
Nmegbu, Chukwuma Godwin Jacob*
*(Department of Petroleum Engineering,Rivers State University of Science and Technology, P.M.B 5080,
Nigeria)
ABSTRACT
Reservoir fluid salinity, its effectiveness on viscosity as well as temperature dependency is an important
parameter for enhanced oil recovery consideration. Previous studies on formation fluid properties focused on
NaCl and KCl, the two most common brines in connate water and in water-based drilling mud, failing, however,
to relate its performance to bacterial survival. This work has considered four different brine solutions and how it
will affect the useability of pseudomonas species and halobacterium H – 356. The bacterial mixture viscosity
shows a considerable difference between NaCl, CsCl, KCl and LiCl with NaCl and LiCl being favourable
brines. Hence, for flooding agent at varying temperature since it makes the bacteria mixture viscosity more
viscous whereas the KCl appeared less viscous compared to liquid mixture standard water. For the bacteria
mixture, the viscosity of KCl and CsCl decreases with the concentration of a low temperature range and
increases with the concentration at a high range.
Keywords-Bacteria Growth, MEOR, Salinity, Salt Concentration
I. INTRODUCTION
The Microbial enhanced oil recovery (MEOR) is
a mechanism that employs the use of microbes to
degrade or ferment hydrocarbons and produce by-
products such as surfactants, polymers, gases and
biofilms that are useful in the recovery of oil [1], [2].
Microbial methods for increasing oil recovery are
potentially cost effective even at relatively low crude
oil prices. They can be applied in a variety of ways
including permeability modification treatments and
microbial enhanced water flooding. The flexibility
and potential cost effectiveness of the technology
makes it attractive, but further understanding of the
transport mechanism and the development of a sound
engineering methodology for optimizing microbial
and injection strategies are needed to realize its
potential [3].
Wagner [4] presented a review on MEOR from
carbonate reservoirs with complex formation
characteristics. Adapted laboratory models showed a
25% decrease in water production and a three-fold
increment in oil production. Such laboratory marvels
have further propelled research in this field. The
industry remains reluctant, as usual, to accept this
new technology wholly.
The practical application of microbial culture to
subsurface oil reservoirs imposes several restrictions
on the microbial culture. The microbes must be able
to migrate, transported deep within the reservoir for
any in-situ applications to be of practical significance
to oil recovery. The microbes must remain
biologically active at elevated temperature and
pressure [5]. As such, microbes intended to be used
in petroleum reservoirs should be tested with
reservoir fluids at subsurface conditions of
temperature, pressure and salinity [5], [6].
The effectiveness of the microbes varies from
one formation to the other, often influenced by a host
of physical, biological and chemical constraints [5],
[7]. This was reaffirmed by Alireza et al when they
investigated the MEOR technique in fractured porous
media using etched-glass micro models [8]. They
found that the plugging of matrix-fracture interface
by an exopolymer is the main reason for the low
performance of the exopolymer producing bacterium.
The physical constraints include temperature,
pressure, pore geometry, whereas the biological
constraint is mainly enzymatic functions. Surface
charge, pH and salinity, amongst others, make up the
chemical constraints [9].
No doubt, different oil bearing formation waters
have a wide range of salinity often increasing with
depth. Ivanov and Belyaev [10] examined the
microbial flora of water injections and found that
bacterial oxidation of oil took place in the zone of
contact between the injected low-salinity waters and
stratal waters of the oilfield. Masahito et al. [11] in
their paper on the effects of salt concentration on
encystment induction in ciliated protozoan colpoa sp.
discovered that encystment was promoted by an
increase in the concentration of ions such as Ca2+
,
Na+
and K+
contained in the surrounding medium.
According to Collins [12], the highest concentrations
of minor cations that may interfere with microbial
systems are Lithium – 400 g/L, Barium –670 g/L,
RESEARCH ARTICLE OPEN ACCESS](https://image.slidesharecdn.com/ai04602244247-140816004413-phpapp01/75/Ai04602244247-1-2048.jpg)
![Nmegbu Int. Journal of Engineering Research and Applications www.ijera.com
ISSN : 2248-9622, Vol. 4, Issue 6( Version 2), June 2014, pp.244-247
www.ijera.com 245 | P a g e
Boron –450 g/L, Bromine – 6000 g/L and Iodine –
1400 g/L.
Salinity is an ecological factor of considerable
importance, influencing the types of organisms that
live in a body of water [11], [12]. This work basically
seeks to study the effects of salinity on the
performance of microbes in oil reservoirs during
MEOR.
II. METHODOLOGY
Synthetic porous media with dimensions of
length 29.6cm and diameter 7.0cm was used as a
reservoir model. The sand used was obtained from a
depth of 900ft below sea level and a sieve analysis
was done on the sand to obtain different grain sizes
of 2.0mm, 3.75mm and 4.35mm. The flooding agent
used was distilled water, autoclaved at a temperature
of 121˚C. Lab M nutrients broth “E” solution was
used as nutrient. It was prepared by dispersing 13g of
broth E powder in one liter of deionized water. The
mixture was heated to dissolve the powder properly
and then sterilized by autoclaving at 121˚C for
15minutes. The pH of the nutrient solution was
7.4±0.2.
Table 1: Oil Physical Property
Parameter Value
Reservoir pressure, PR (psi) 3448
Bubble Point pressure, Pb (psi) 1048
Oil Viscosity, μo (cp) 0.41
API gravity 35.7
Oil formation volume factor, Bo
(bbl/stb)
1.559
Gas gravity 0.647
Reservoir Temperature, TR (˚F) 117
Gas Solubility, Rs (scf/STB) 979
psi = pounds per square inch; cp = centipoise; bbl =
barrels; stb = stock tank barrel; scf = standard cubic
feet
The table below shows the nutrient composition
and corresponding concentrations used.
Table 2: Nutrient Composition
Composition Concentration (g/cm3
)
Beef Extract 3.0
Yeast Extract 4.0
Peptone 10.0
Sodium Chloride 10.0
2.1 Growth and Nutrient Condition
The choice of microbes were made for this work
– bacillus subtilis and pseudomonas aerogenosa.
Broth bacteria were collected using the Persian Type
Culture (PTCC).
A broth culture (liquid growth medium) of P.
Aerogenosa and B. subtilis was done differently in
mediums A and B respectively. The composition of
each growth medium is presented in Table 3. The
bacterial culture was centrifuged at 200rpm for 30
minutes and collected at the stationary state. It was
then suspended in autoclaved distilled water. The
bacterial suspension was placed on a magnetic stirrer
and allowed to mix at room temperature for 8mins.
The solution was centrifuged and washed again with
water. The cell density of the bacterial solution was
adjusted to about 0.8 * 107
cells/cm3
.
Table 3: The composition of liquid growth media A
and B
Constituent A B
Ammonium
Chloride
2.0 2.0
Glucose 5.0 3.0
Peptone 1.0 1.0
Meat Infusion 5.0 5.0
Sodium Hydroxide 2.0 2.0
Sodium Chloride 0.3 0.25
2.2 Experimental Procedure
A three-dimensional glass model was used as a
bioreactor. The bioreactor was made a digestor as it
was air-tight. The bioreactor was connected between
two points: the inflow line and the outlet. The inflow
had two valve channels through which the liquid
mixture was poured. All system tubing was 1/10 OD
PTFE Teflon. The choice of a small diameter
flowline was to enable approximate flowline to pore
volume ratio.
The following procedure was followed in conducting
the experiment:
1. The glass model (bioreactor) was sterilized with
Xylene.
2. The glass model was filled with grain of a
particular size.
3. The porous media was saturated with a brine of
50g/100ml until the point of connate water was
reached.
4. The outlet valve was opened to allow the water
to drain out.
5. It was then saturated with crude oil to the point
of initial oil saturation
6. Air was then projected at a pressure of 5psi and
the flow rate was measured until no more liquid
was produced.
7. 100 ml of the mixture of bacterial broth culture
was poured through the inlets, through the
flowline to the porous media.
8. The system was incubated aerobically for a
period of 24hrs [shut-in period] at a steady
ambient temperature of 23˚C
9. Following the shut-in period, after 24 hours, air
was pumped through the valve to produce oil
until no more oil was produced
10. The procedure was repeated for different shut-in
periods of 12 and 48 hours for distinct grain
sizes](https://image.slidesharecdn.com/ai04602244247-140816004413-phpapp01/85/Ai04602244247-2-320.jpg)
![Nmegbu Int. Journal of Engineering Research and Applications www.ijera.com
ISSN : 2248-9622, Vol. 4, Issue 6( Version 2), June 2014, pp.244-247
www.ijera.com 247 | P a g e
undo the effort by making the microbial solution too
viscous to migrate within the reservoir.
REFERENCES
[1] S.L. Bryant andT.P. Lockhart, Reservoir
Engineering analysis of microbial enhanced
oil recovery, SPE Reservoir Evaluation and
Engineering, Oct 2002, 365-374
[2] S.L. Marshall, “Fundamental Aspects of
Microbial Enhanced Oil Recovery: A
Literature Survey”, National Research
flagship, CSIRO, Western Australia, 2008
[online],
http://www.clw.csiro.au/publications/scienc
e/2008/WFO-MicrobialOilRecovery.pdf
(accessed Feb 13, 2014)
[3] M-M.Chang, R.S.Bryant, H.W. Gao andT.-
H. Chung, Modeling of Microbial Transport
Phenomena in Porous Media, US DOE
Report, July 1991 [online],
http://www.netl.doe.gov/kmd/cds/disk44/I-
Microbial/NIPER539.pdf (accessed Feb 13,
2014)
[4] M. Wagner, Microbial enhancement of oil
recovery from carbonate reservoirs with
complex formation characteristics.
Microbial enhancement of oil recovery-
recent advances. In: Premuzic ET (ed.),
Developments in Petroleum Science: Proc.
of the 1992 international conference on
microbial enhanced oil recovery, 31. (New
York, USA : Elsevier, 1992), 387-398
[5] B. Bubela,Combined Effect of Temperature
and other Environmental Stresses on
Microbiologically Enhanced Oil Recovery,
In: E.C. Donaldson and J.B. Clark (Ed.),
Proc., 1982 International Conference on
Microbial Enhancement of Oil Recovery,
NTIS, Springfield, Va,1983, 118-123
[6] B., Bubela, A.J. DaviesandJ.
Ferguson,Biological and Abiological
processes in a simulated sedimentary
system, J. Geol. Soc. Austr.,32(2),1975, 135-
141
[7] T. Teresa, Introduction to Bacteria, J.
Science in the real world, 1999, 3-6
[8] A., Soundmand-asli, S.S. Ayatollahi,H.
Mohabatkar, M. Zareie, andS.F.
Shariatpanahi, The in situ microbial
enhanced oil recovery in fractured porous
media, Elsevier Journal of Petroleum
Science and Engineering,58,2007, 161-172
[9] R.S. Bryant, E.C. Donaldson, G.V.
Chilingariam andT.F. Yen, Microbial
Enhanced Oil Recovery II, Process and
Operation (Amsterdam, Netherlands:
Elsevier, 1989) 432-450
[10] M.V. IvanovandS.S. Belyaev,Microbial
Activity in Water Flooded OilField and its
Possible Regulation, In: E.C. Donaldson and
J.B. Clark (Ed.), Proc. 1982 International
Conference on Microbial Enhancement of
Oil Recovery, NTIS, Springfield, Va, 1983,
48-57
[11] A.G. Collins, Geochemistry of Oilfield
waters, (Amsterdam, Netherlands: Elsevier,
1975) 496 Masahito, Y., Tamako, W. &
Tatsuomi, M. (2004) “Effects of salt
concentration and bacteria on encystment
induction in ciliated protozoan colpoda sp.”,
J. ACTA protozool. 43, 93-98](https://image.slidesharecdn.com/ai04602244247-140816004413-phpapp01/85/Ai04602244247-4-320.jpg)

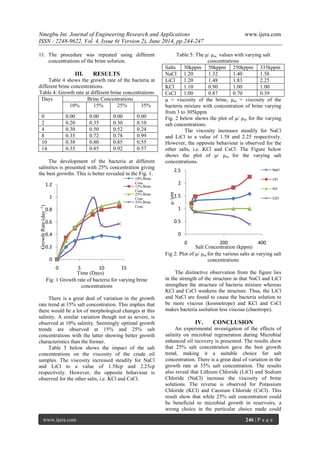
This document investigates the effects of salt concentration on microbial growth during microbial enhanced oil recovery (MEOR) using various brine solutions. The study found that 25% salt concentration provided the best growth conditions, with sodium chloride and lithium chloride enhancing viscosity, while potassium chloride and caesium chloride reduced it. The findings suggest optimal salt concentrations are crucial for maximizing microbial efficiency in oil recovery processes.


![[Ahn]](https://cdn.slidesharecdn.com/ss_thumbnails/ahn-150814123606-lva1-app6891-thumbnail.jpg?width=640&height=640&fit=bounds)


![CáLculo D[1]..](https://cdn.slidesharecdn.com/ss_thumbnails/clculod1-090302103950-phpapp02-thumbnail.jpg?width=640&height=640&fit=bounds)


![Getting Started with Apache Spark: Big Data Made Simple [Free Meetup]](https://cdn.slidesharecdn.com/ss_thumbnails/apachesparkgettingstarted-260203175547-8361bcc3-thumbnail.jpg?width=640&height=640&fit=bounds)


