SlideShare a Scribd company logo
A diverese toolbox of hydrological tools were deployed along the East Fork of
the Jemez River, within the Valles Caldera National Preserve, NM in order to
understand potentially linked physical and chemical processes across a riv-
ResultsIntroduction
Dylan Hart1
, Edna Rodriguez1
, Elyse Nichols1
, Bayani Cardenas1
, Stephen Ferencz1
, George Perkins2
, Robert Parmenter3
, and
The 2016 University of Texas Hydrogeology Field Camp1
1
University of Texas at Austin, Dept. of Geological Sciences 2
Los Alamos National Laboratory 3
National Park Service
Water Table Map and Riverbed Head Gradient
Thermal Data
Objectives
• Is the Jemez River gaining or losing?
• How can the local hyporheic zone hydrology be characterized by thermal
the groundwater-surface water interaction?
Study Site and Location
Field Photos
Methods
• Collected water table depths from installed piezometers using water tape
• Collected ground and surface water samples for lab analyis
• Installed thermistors in the Jemez River
• The Jemez River is overall gaining, as seen in
the Water Table Map
summer season, we observed a drop in the
water table of max magnitude ~10 cm at
piezometers farthest away from the river.
• Processes such as mixing of groundwater and
the hyporheic zone of the river’s bed and banks
could be the cause of the observed trends in the
chloride data.
• Spatial temperature variations recorded over
the course of two days suggest
face water into the hyporheic zone at the
• Thermistors #3 and #4 (under vegetation) expe-
much lower magnitude
Future Work
Expand study to consider seasonal variability of
groundwater exchange, especially during times of
East Fork Jemez River.
Red square is a research enclo-
sure within Valles Caldera
Team deployed 7 thermistor setups to measure the lateral change in vertical tempera-
and #4 positioned under the vegetation.
Each thermistor were set up with four measuring points arranged vertically, spaced 25
cm, 15 cm, 10 cm, and 5 cm below the riverbed ground surface.
Flow Direction
Chemical Analysis
General increase in chloride concentration should be observed along a sub
-
-tions were observed decreasing downstream
Riverbed
0.25 m
10 AM
5 PM
10 PM
5 AM
Riverbed
0.25 m
Riverbed
0.25 m
Riverbed
0.25 m
#5 #4 #3 #2 #1
• Temporary piezometers were installed along the portion
of the Jemez River transiting through the study area to eval-
-
uate head gradients along the stream.
• All measured riverbed gradients were positive within the
enclosure, and values ranged from 1-6cm.
the water table of maximum magnitude ~10cm at piezometers farthest away
from the river
#5 #4 #3 #2 #1
A
A
B
BA
Transverse Groundwater Temperature Profile
10 AM
5 PM
10 PM
5 AM
Flow Direction
Riverbed
Riverbed
Riverbed
Riverbed
Data collected during UT’s hydrology field camp.

More Related Content

What's hot

Integrated surface water/groundwater modelling to simulate drought and climat...
Integrated surface water/groundwater modelling to simulate drought and climat...Integrated surface water/groundwater modelling to simulate drought and climat...
Integrated surface water/groundwater modelling to simulate drought and climat...
Dirk Kassenaar M.Sc. P.Eng.
 
Assessing Cumulative Effects with Integrated Modelling
Assessing Cumulative Effects with Integrated ModellingAssessing Cumulative Effects with Integrated Modelling
Assessing Cumulative Effects with Integrated Modelling
Dirk Kassenaar M.Sc. P.Eng.
 
Sed 3 Equipment Procedures And Sampling
Sed 3 Equipment Procedures And SamplingSed 3 Equipment Procedures And Sampling
Sed 3 Equipment Procedures And SamplingUW Discovery Farms
 
Dusting Off the Source Water Protection Models: Adaptation and Application of...
Dusting Off the Source Water Protection Models: Adaptation and Application of...Dusting Off the Source Water Protection Models: Adaptation and Application of...
Dusting Off the Source Water Protection Models: Adaptation and Application of...
Dirk Kassenaar M.Sc. P.Eng.
 
Assessing Sensitivity to Drought and Climate Change with an Integrated Surfac...
Assessing Sensitivity to Drought and Climate Change with an Integrated Surfac...Assessing Sensitivity to Drought and Climate Change with an Integrated Surfac...
Assessing Sensitivity to Drought and Climate Change with an Integrated Surfac...
Dirk Kassenaar M.Sc. P.Eng.
 
The Impact of Marcellus Gas Drilling on Rural Drinking Water Supplies
The Impact of Marcellus Gas Drilling on Rural Drinking Water SuppliesThe Impact of Marcellus Gas Drilling on Rural Drinking Water Supplies
The Impact of Marcellus Gas Drilling on Rural Drinking Water Supplies
Marcellus Drilling News
 
Thermal Impact Assessment of Below-Water-Table Aggregate Extraction
Thermal Impact Assessment of Below-Water-Table Aggregate ExtractionThermal Impact Assessment of Below-Water-Table Aggregate Extraction
Thermal Impact Assessment of Below-Water-Table Aggregate Extraction
Dirk Kassenaar M.Sc. P.Eng.
 
Bren 3 Equipment Procedures And Sampling
Bren 3 Equipment Procedures And SamplingBren 3 Equipment Procedures And Sampling
Bren 3 Equipment Procedures And SamplingUW Discovery Farms
 
Dirk Kassenaar EarthFX Watertech 2016
Dirk Kassenaar EarthFX Watertech 2016 Dirk Kassenaar EarthFX Watertech 2016
Dirk Kassenaar EarthFX Watertech 2016
Dirk Kassenaar M.Sc. P.Eng.
 
Watertech Booth Slide 2013
Watertech Booth Slide 2013Watertech Booth Slide 2013
Watertech Booth Slide 2013
Dirk Kassenaar M.Sc. P.Eng.
 
Erosion modeling in the Upper Blue Nile Basin: The case for Mizewa Watershed
Erosion modeling in the Upper Blue Nile Basin: The case for Mizewa WatershedErosion modeling in the Upper Blue Nile Basin: The case for Mizewa Watershed
Erosion modeling in the Upper Blue Nile Basin: The case for Mizewa Watershed
International Water Management Institute (IWMI)
 
Irrigation of Controlled Environment Crops - Nutrients & Stress
Irrigation of Controlled Environment Crops - Nutrients & StressIrrigation of Controlled Environment Crops - Nutrients & Stress
Irrigation of Controlled Environment Crops - Nutrients & Stress
METER Group, Inc. USA
 
Water Quality Monitoring Programs in Fairfax County, April 2014
Water Quality Monitoring Programs in Fairfax County, April 2014Water Quality Monitoring Programs in Fairfax County, April 2014
Water Quality Monitoring Programs in Fairfax County, April 2014
Fairfax County
 
Integrated Modelling: Insights and Blind Spots
Integrated Modelling: Insights and Blind SpotsIntegrated Modelling: Insights and Blind Spots
Integrated Modelling: Insights and Blind Spots
Dirk Kassenaar M.Sc. P.Eng.
 
Applications of Integrated Models to Watershed and Sub-Watershed Scale Analys...
Applications of Integrated Models to Watershed and Sub-Watershed Scale Analys...Applications of Integrated Models to Watershed and Sub-Watershed Scale Analys...
Applications of Integrated Models to Watershed and Sub-Watershed Scale Analys...
Dirk Kassenaar M.Sc. P.Eng.
 
Analysis of Groundwater/Surface Water Interaction at the Site Scale Babcock R...
Analysis of Groundwater/Surface Water Interaction at the Site Scale Babcock R...Analysis of Groundwater/Surface Water Interaction at the Site Scale Babcock R...
Analysis of Groundwater/Surface Water Interaction at the Site Scale Babcock R...
Dirk Kassenaar M.Sc. P.Eng.
 

What's hot (19)

Presentation
PresentationPresentation
Presentation
 
Integrated surface water/groundwater modelling to simulate drought and climat...
Integrated surface water/groundwater modelling to simulate drought and climat...Integrated surface water/groundwater modelling to simulate drought and climat...
Integrated surface water/groundwater modelling to simulate drought and climat...
 
Assessing Cumulative Effects with Integrated Modelling
Assessing Cumulative Effects with Integrated ModellingAssessing Cumulative Effects with Integrated Modelling
Assessing Cumulative Effects with Integrated Modelling
 
Sed 3 Equipment Procedures And Sampling
Sed 3 Equipment Procedures And SamplingSed 3 Equipment Procedures And Sampling
Sed 3 Equipment Procedures And Sampling
 
#1
#1#1
#1
 
Dusting Off the Source Water Protection Models: Adaptation and Application of...
Dusting Off the Source Water Protection Models: Adaptation and Application of...Dusting Off the Source Water Protection Models: Adaptation and Application of...
Dusting Off the Source Water Protection Models: Adaptation and Application of...
 
Assessing Sensitivity to Drought and Climate Change with an Integrated Surfac...
Assessing Sensitivity to Drought and Climate Change with an Integrated Surfac...Assessing Sensitivity to Drought and Climate Change with an Integrated Surfac...
Assessing Sensitivity to Drought and Climate Change with an Integrated Surfac...
 
The Impact of Marcellus Gas Drilling on Rural Drinking Water Supplies
The Impact of Marcellus Gas Drilling on Rural Drinking Water SuppliesThe Impact of Marcellus Gas Drilling on Rural Drinking Water Supplies
The Impact of Marcellus Gas Drilling on Rural Drinking Water Supplies
 
Thermal Impact Assessment of Below-Water-Table Aggregate Extraction
Thermal Impact Assessment of Below-Water-Table Aggregate ExtractionThermal Impact Assessment of Below-Water-Table Aggregate Extraction
Thermal Impact Assessment of Below-Water-Table Aggregate Extraction
 
Pitts_MRDAC2014
Pitts_MRDAC2014Pitts_MRDAC2014
Pitts_MRDAC2014
 
Bren 3 Equipment Procedures And Sampling
Bren 3 Equipment Procedures And SamplingBren 3 Equipment Procedures And Sampling
Bren 3 Equipment Procedures And Sampling
 
Dirk Kassenaar EarthFX Watertech 2016
Dirk Kassenaar EarthFX Watertech 2016 Dirk Kassenaar EarthFX Watertech 2016
Dirk Kassenaar EarthFX Watertech 2016
 
Watertech Booth Slide 2013
Watertech Booth Slide 2013Watertech Booth Slide 2013
Watertech Booth Slide 2013
 
Erosion modeling in the Upper Blue Nile Basin: The case for Mizewa Watershed
Erosion modeling in the Upper Blue Nile Basin: The case for Mizewa WatershedErosion modeling in the Upper Blue Nile Basin: The case for Mizewa Watershed
Erosion modeling in the Upper Blue Nile Basin: The case for Mizewa Watershed
 
Irrigation of Controlled Environment Crops - Nutrients & Stress
Irrigation of Controlled Environment Crops - Nutrients & StressIrrigation of Controlled Environment Crops - Nutrients & Stress
Irrigation of Controlled Environment Crops - Nutrients & Stress
 
Water Quality Monitoring Programs in Fairfax County, April 2014
Water Quality Monitoring Programs in Fairfax County, April 2014Water Quality Monitoring Programs in Fairfax County, April 2014
Water Quality Monitoring Programs in Fairfax County, April 2014
 
Integrated Modelling: Insights and Blind Spots
Integrated Modelling: Insights and Blind SpotsIntegrated Modelling: Insights and Blind Spots
Integrated Modelling: Insights and Blind Spots
 
Applications of Integrated Models to Watershed and Sub-Watershed Scale Analys...
Applications of Integrated Models to Watershed and Sub-Watershed Scale Analys...Applications of Integrated Models to Watershed and Sub-Watershed Scale Analys...
Applications of Integrated Models to Watershed and Sub-Watershed Scale Analys...
 
Analysis of Groundwater/Surface Water Interaction at the Site Scale Babcock R...
Analysis of Groundwater/Surface Water Interaction at the Site Scale Babcock R...Analysis of Groundwater/Surface Water Interaction at the Site Scale Babcock R...
Analysis of Groundwater/Surface Water Interaction at the Site Scale Babcock R...
 

Similar to AGu

Beeville MLT_Groundwater 101_Marcus Gary
Beeville MLT_Groundwater 101_Marcus GaryBeeville MLT_Groundwater 101_Marcus Gary
Beeville MLT_Groundwater 101_Marcus Gary
Texas Alliance of Groundwater Districts
 
Groundwater Resources Program (Dennehy)
Groundwater Resources Program (Dennehy)Groundwater Resources Program (Dennehy)
Groundwater Resources Program (Dennehy)
Iwl Pcu
 
Groundwater Resources Program (Dennehy)
Groundwater Resources Program (Dennehy)Groundwater Resources Program (Dennehy)
Groundwater Resources Program (Dennehy)
Iwl Pcu
 
Sed 3 equipment procedures and sampling
Sed 3 equipment procedures and samplingSed 3 equipment procedures and sampling
Sed 3 equipment procedures and samplingUW Discovery Farms
 
Bren 3 equipment procedures and sampling
Bren 3 equipment procedures and samplingBren 3 equipment procedures and sampling
Bren 3 equipment procedures and samplingUW Discovery Farms
 
Interpolation
InterpolationInterpolation
Interpolation
University of Alabama
 
Groundwater Data Requirement and Analysis
Groundwater Data Requirement and AnalysisGroundwater Data Requirement and Analysis
Groundwater Data Requirement and AnalysisC. P. Kumar
 
PERUMIN 31: Integrated assessment of deep sedimentary structures: exploring g...
PERUMIN 31: Integrated assessment of deep sedimentary structures: exploring g...PERUMIN 31: Integrated assessment of deep sedimentary structures: exploring g...
PERUMIN 31: Integrated assessment of deep sedimentary structures: exploring g...
PERUMIN - Convención Minera
 
Applications of Integrated Surface Water Groundwater Modelling Techniques and...
Applications of Integrated Surface Water Groundwater Modelling Techniques and...Applications of Integrated Surface Water Groundwater Modelling Techniques and...
Applications of Integrated Surface Water Groundwater Modelling Techniques and...
Dirk Kassenaar M.Sc. P.Eng.
 
radio isotope in ground water study
radio isotope in ground water studyradio isotope in ground water study
radio isotope in ground water study
preethi durairaj
 
Reservoirs and Groundwater: Interactions Observed in the Northern Segment of ...
Reservoirs and Groundwater: Interactions Observed in the Northern Segment of ...Reservoirs and Groundwater: Interactions Observed in the Northern Segment of ...
Reservoirs and Groundwater: Interactions Observed in the Northern Segment of ...
TWCA
 
SALINITY.pptx
SALINITY.pptxSALINITY.pptx
SALINITY.pptx
UdayKiranReddy43
 
Water Temperature Monitoring using Field Sensors (Data Loggers) in the Kafue ...
Water Temperature Monitoring using Field Sensors (Data Loggers) in the Kafue ...Water Temperature Monitoring using Field Sensors (Data Loggers) in the Kafue ...
Water Temperature Monitoring using Field Sensors (Data Loggers) in the Kafue ...
NorisNm
 
08-22 Lecture.ppt
08-22 Lecture.ppt08-22 Lecture.ppt
08-22 Lecture.ppt
ssusere981da
 
Groundwater potential assesment for ethiopia and south africa nbdjkfhkj
Groundwater potential assesment for ethiopia and south africa nbdjkfhkjGroundwater potential assesment for ethiopia and south africa nbdjkfhkj
Groundwater potential assesment for ethiopia and south africa nbdjkfhkj
mekonnenAshenif1
 

Similar to AGu (20)

Beeville MLT_Groundwater 101_Marcus Gary
Beeville MLT_Groundwater 101_Marcus GaryBeeville MLT_Groundwater 101_Marcus Gary
Beeville MLT_Groundwater 101_Marcus Gary
 
Groundwater Resources Program (Dennehy)
Groundwater Resources Program (Dennehy)Groundwater Resources Program (Dennehy)
Groundwater Resources Program (Dennehy)
 
Groundwater Resources Program (Dennehy)
Groundwater Resources Program (Dennehy)Groundwater Resources Program (Dennehy)
Groundwater Resources Program (Dennehy)
 
Sed 3 equipment procedures and sampling
Sed 3 equipment procedures and samplingSed 3 equipment procedures and sampling
Sed 3 equipment procedures and sampling
 
Bren 3 equipment procedures and sampling
Bren 3 equipment procedures and samplingBren 3 equipment procedures and sampling
Bren 3 equipment procedures and sampling
 
Jabari Lee Poster
Jabari Lee PosterJabari Lee Poster
Jabari Lee Poster
 
Interpolation
InterpolationInterpolation
Interpolation
 
Groundwater Data Requirement and Analysis
Groundwater Data Requirement and AnalysisGroundwater Data Requirement and Analysis
Groundwater Data Requirement and Analysis
 
PERUMIN 31: Integrated assessment of deep sedimentary structures: exploring g...
PERUMIN 31: Integrated assessment of deep sedimentary structures: exploring g...PERUMIN 31: Integrated assessment of deep sedimentary structures: exploring g...
PERUMIN 31: Integrated assessment of deep sedimentary structures: exploring g...
 
Applications of Integrated Surface Water Groundwater Modelling Techniques and...
Applications of Integrated Surface Water Groundwater Modelling Techniques and...Applications of Integrated Surface Water Groundwater Modelling Techniques and...
Applications of Integrated Surface Water Groundwater Modelling Techniques and...
 
Menger Creek Poster
Menger Creek PosterMenger Creek Poster
Menger Creek Poster
 
radio isotope in ground water study
radio isotope in ground water studyradio isotope in ground water study
radio isotope in ground water study
 
Reservoirs and Groundwater: Interactions Observed in the Northern Segment of ...
Reservoirs and Groundwater: Interactions Observed in the Northern Segment of ...Reservoirs and Groundwater: Interactions Observed in the Northern Segment of ...
Reservoirs and Groundwater: Interactions Observed in the Northern Segment of ...
 
Tidepools
TidepoolsTidepools
Tidepools
 
SALINITY.pptx
SALINITY.pptxSALINITY.pptx
SALINITY.pptx
 
Water Temperature Monitoring using Field Sensors (Data Loggers) in the Kafue ...
Water Temperature Monitoring using Field Sensors (Data Loggers) in the Kafue ...Water Temperature Monitoring using Field Sensors (Data Loggers) in the Kafue ...
Water Temperature Monitoring using Field Sensors (Data Loggers) in the Kafue ...
 
Poster
PosterPoster
Poster
 
08-22 Lecture.ppt
08-22 Lecture.ppt08-22 Lecture.ppt
08-22 Lecture.ppt
 
Groundwater potential assesment for ethiopia and south africa nbdjkfhkj
Groundwater potential assesment for ethiopia and south africa nbdjkfhkjGroundwater potential assesment for ethiopia and south africa nbdjkfhkj
Groundwater potential assesment for ethiopia and south africa nbdjkfhkj
 
Bathymetric Survey of Cross Lake
Bathymetric Survey of Cross LakeBathymetric Survey of Cross Lake
Bathymetric Survey of Cross Lake
 

AGu

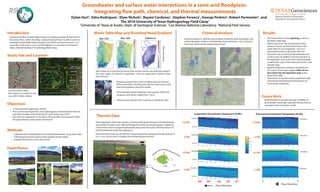
  • 1. A diverese toolbox of hydrological tools were deployed along the East Fork of the Jemez River, within the Valles Caldera National Preserve, NM in order to understand potentially linked physical and chemical processes across a riv- ResultsIntroduction Dylan Hart1 , Edna Rodriguez1 , Elyse Nichols1 , Bayani Cardenas1 , Stephen Ferencz1 , George Perkins2 , Robert Parmenter3 , and The 2016 University of Texas Hydrogeology Field Camp1 1 University of Texas at Austin, Dept. of Geological Sciences 2 Los Alamos National Laboratory 3 National Park Service Water Table Map and Riverbed Head Gradient Thermal Data Objectives • Is the Jemez River gaining or losing? • How can the local hyporheic zone hydrology be characterized by thermal the groundwater-surface water interaction? Study Site and Location Field Photos Methods • Collected water table depths from installed piezometers using water tape • Collected ground and surface water samples for lab analyis • Installed thermistors in the Jemez River • The Jemez River is overall gaining, as seen in the Water Table Map summer season, we observed a drop in the water table of max magnitude ~10 cm at piezometers farthest away from the river. • Processes such as mixing of groundwater and the hyporheic zone of the river’s bed and banks could be the cause of the observed trends in the chloride data. • Spatial temperature variations recorded over the course of two days suggest face water into the hyporheic zone at the • Thermistors #3 and #4 (under vegetation) expe- much lower magnitude Future Work Expand study to consider seasonal variability of groundwater exchange, especially during times of East Fork Jemez River. Red square is a research enclo- sure within Valles Caldera Team deployed 7 thermistor setups to measure the lateral change in vertical tempera- and #4 positioned under the vegetation. Each thermistor were set up with four measuring points arranged vertically, spaced 25 cm, 15 cm, 10 cm, and 5 cm below the riverbed ground surface. Flow Direction Chemical Analysis General increase in chloride concentration should be observed along a sub - -tions were observed decreasing downstream Riverbed 0.25 m 10 AM 5 PM 10 PM 5 AM Riverbed 0.25 m Riverbed 0.25 m Riverbed 0.25 m #5 #4 #3 #2 #1 • Temporary piezometers were installed along the portion of the Jemez River transiting through the study area to eval- - uate head gradients along the stream. • All measured riverbed gradients were positive within the enclosure, and values ranged from 1-6cm. the water table of maximum magnitude ~10cm at piezometers farthest away from the river #5 #4 #3 #2 #1 A A B BA Transverse Groundwater Temperature Profile 10 AM 5 PM 10 PM 5 AM Flow Direction Riverbed Riverbed Riverbed Riverbed Data collected during UT’s hydrology field camp.