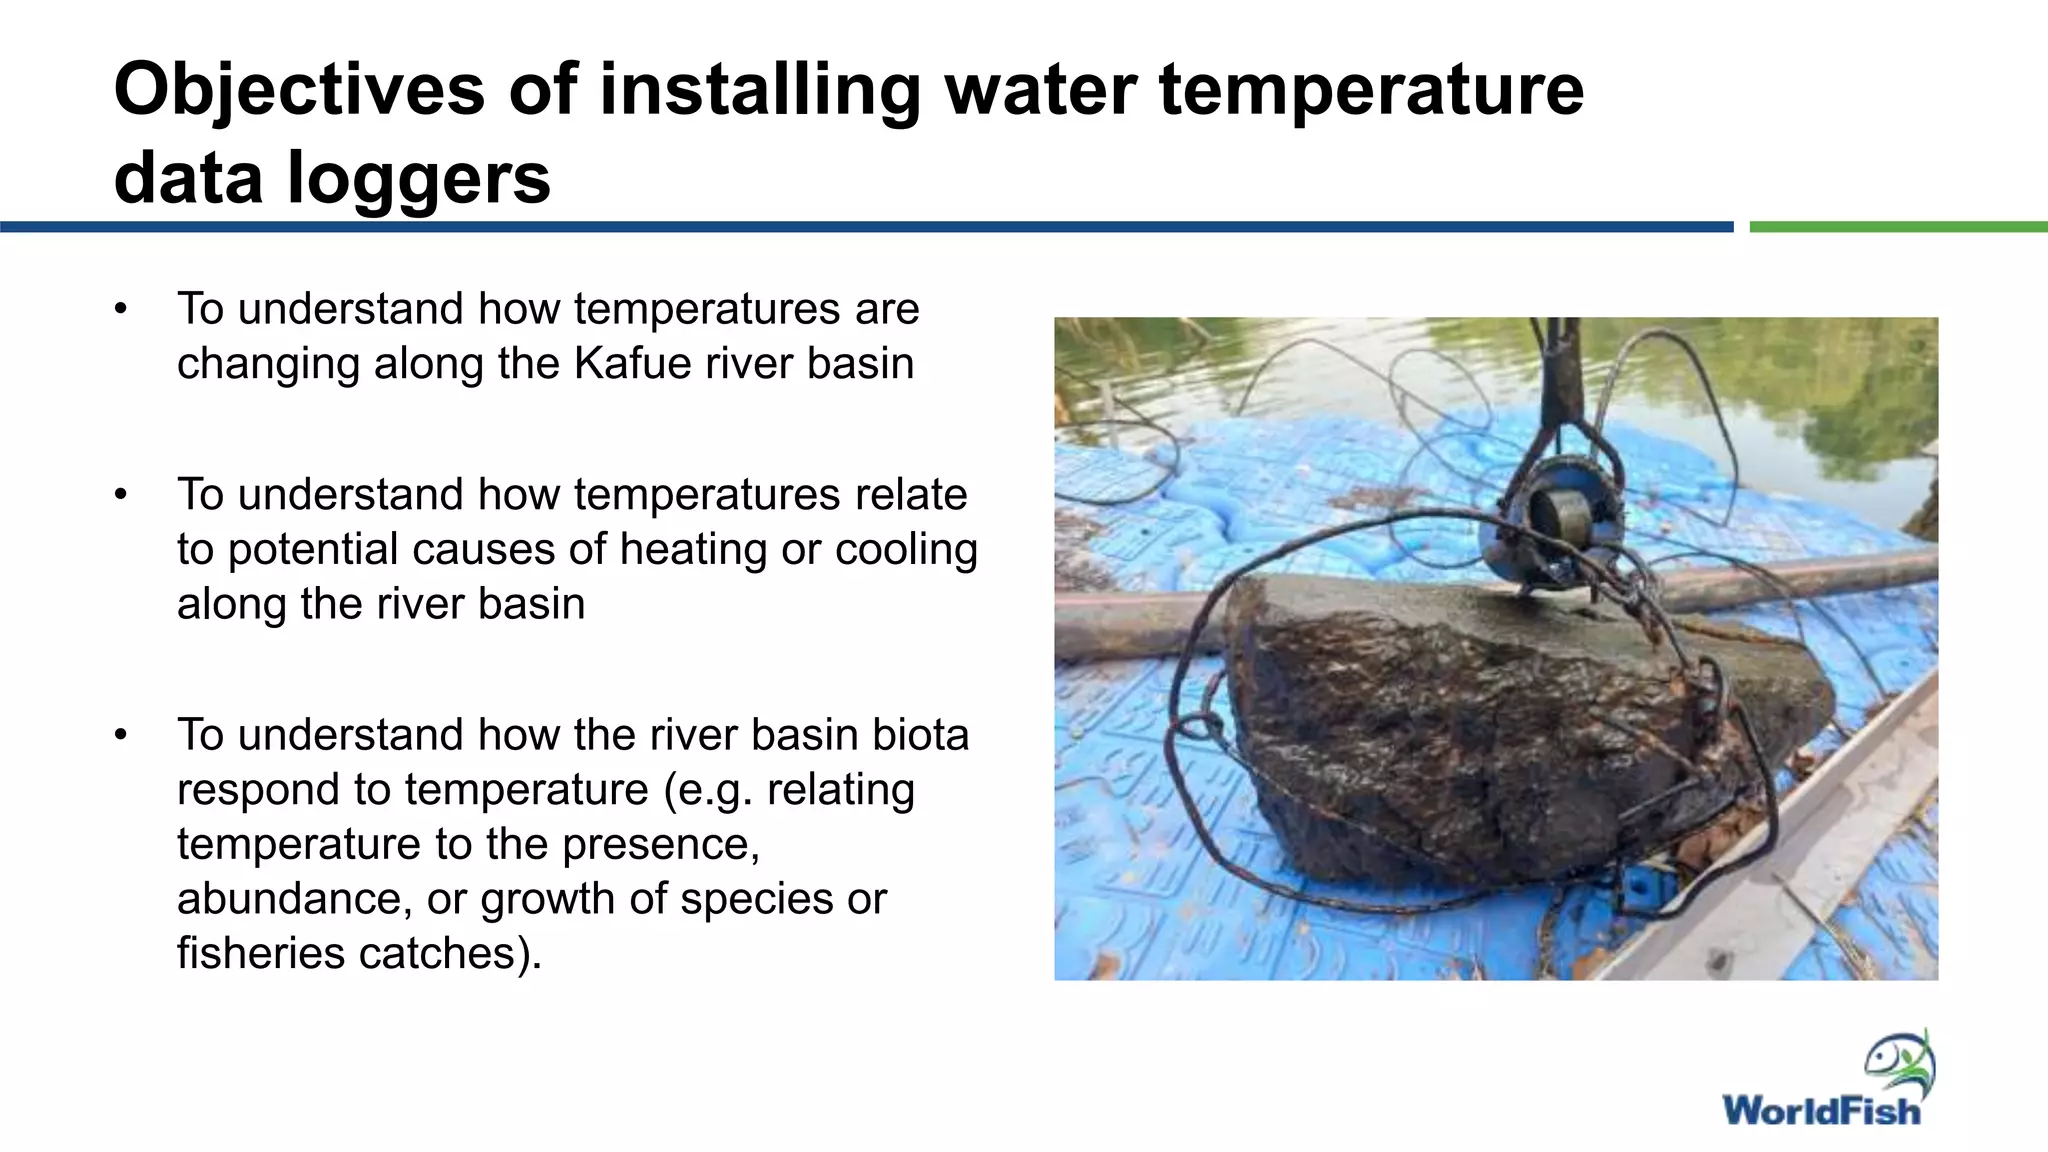
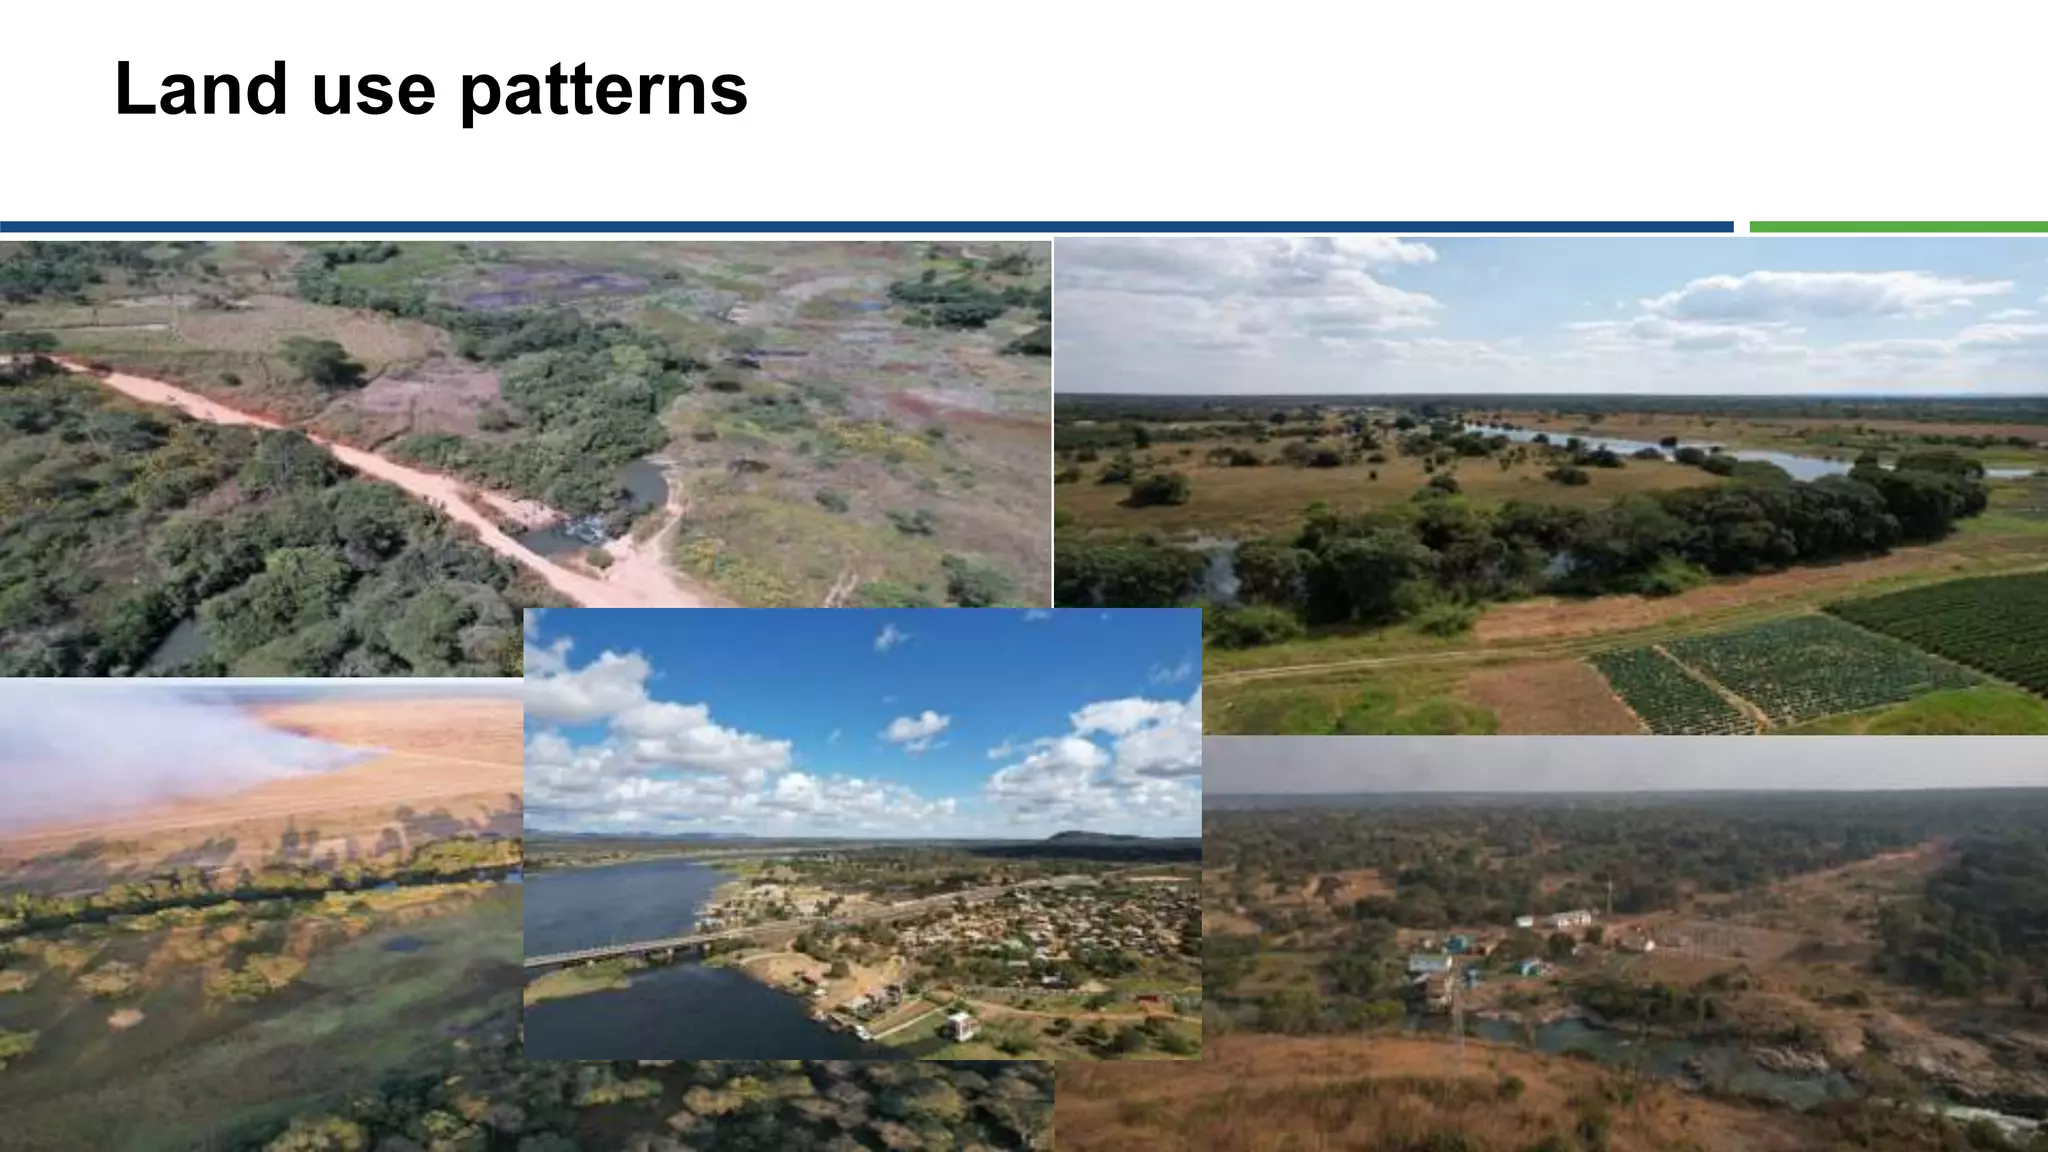
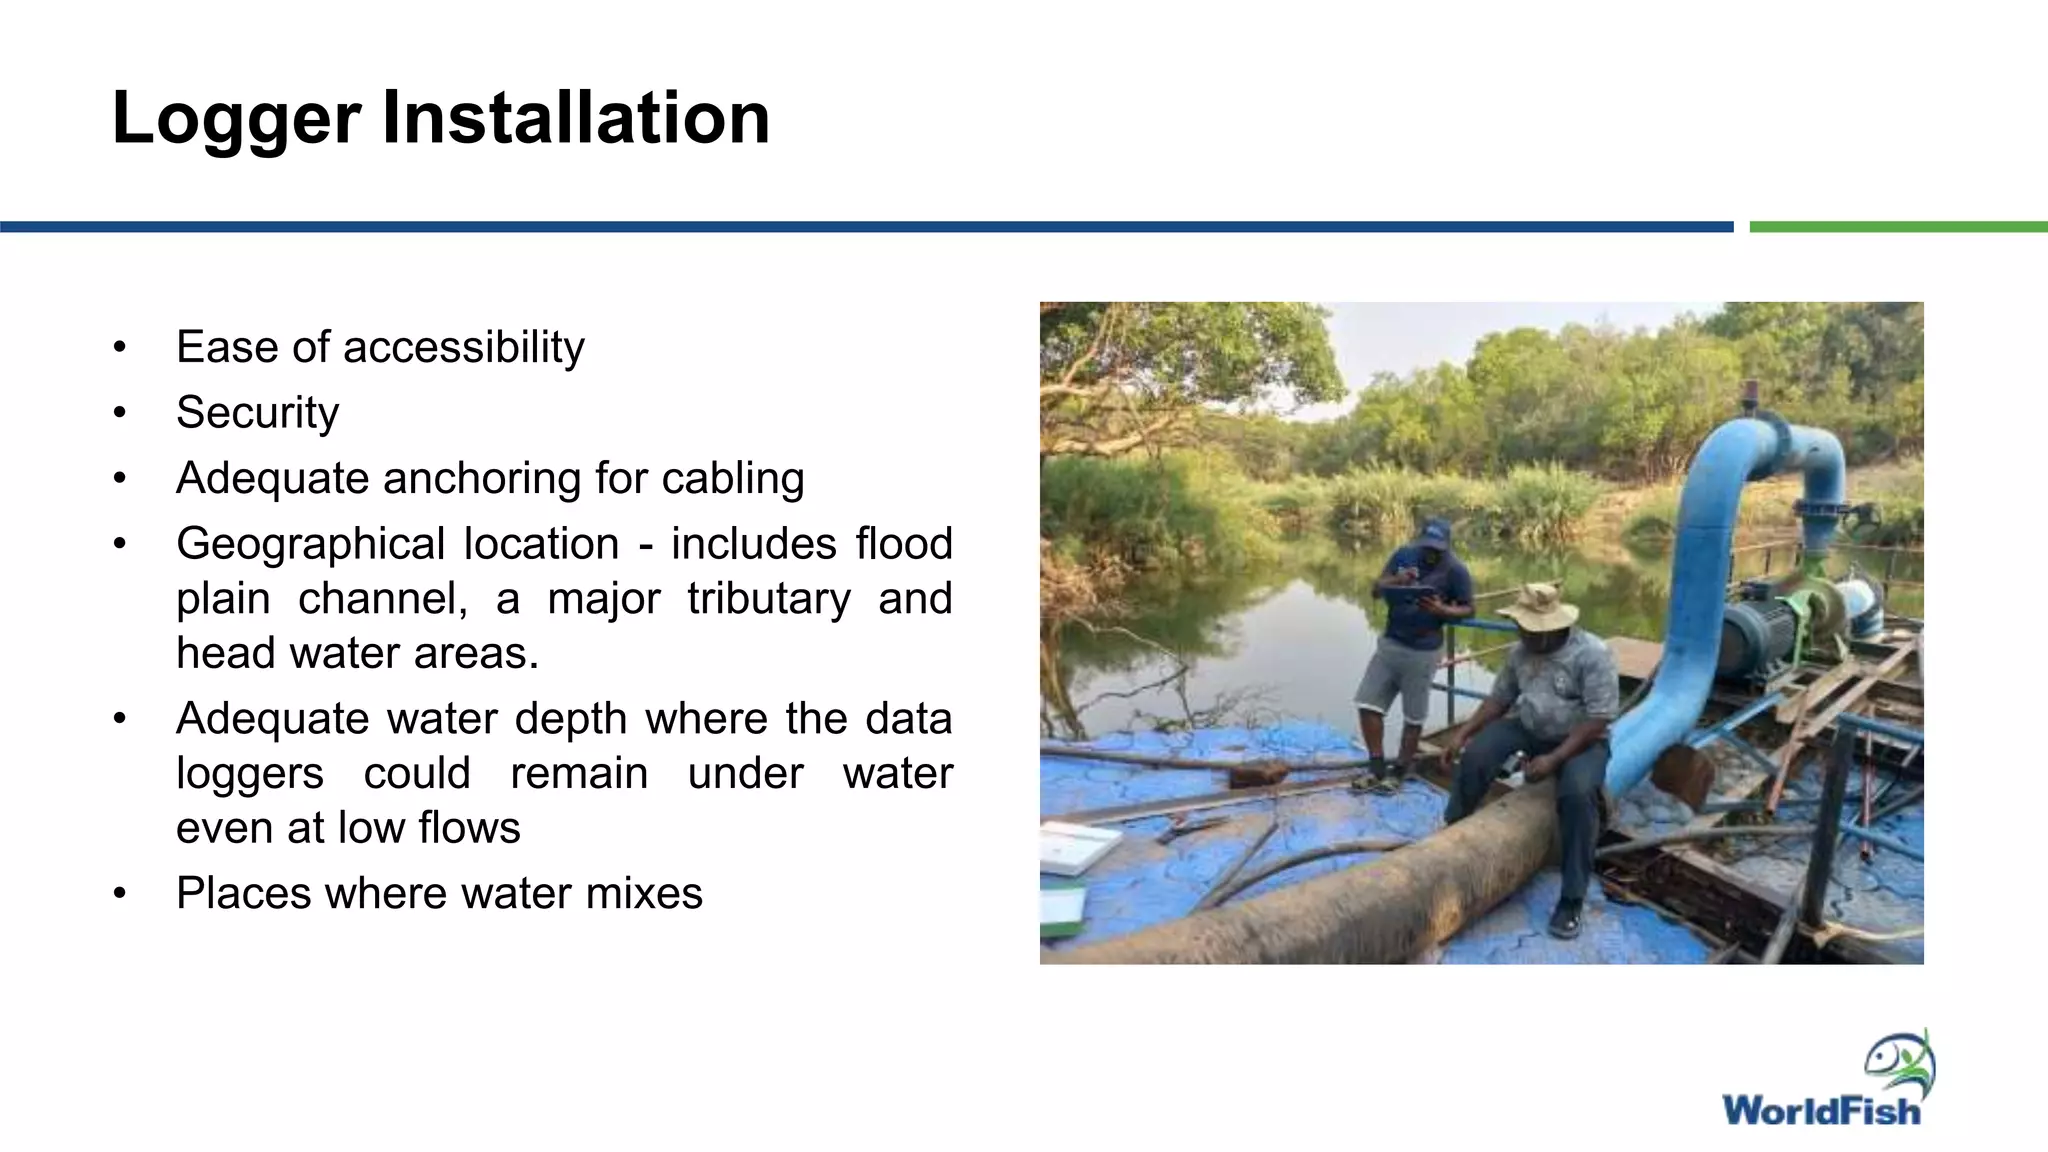
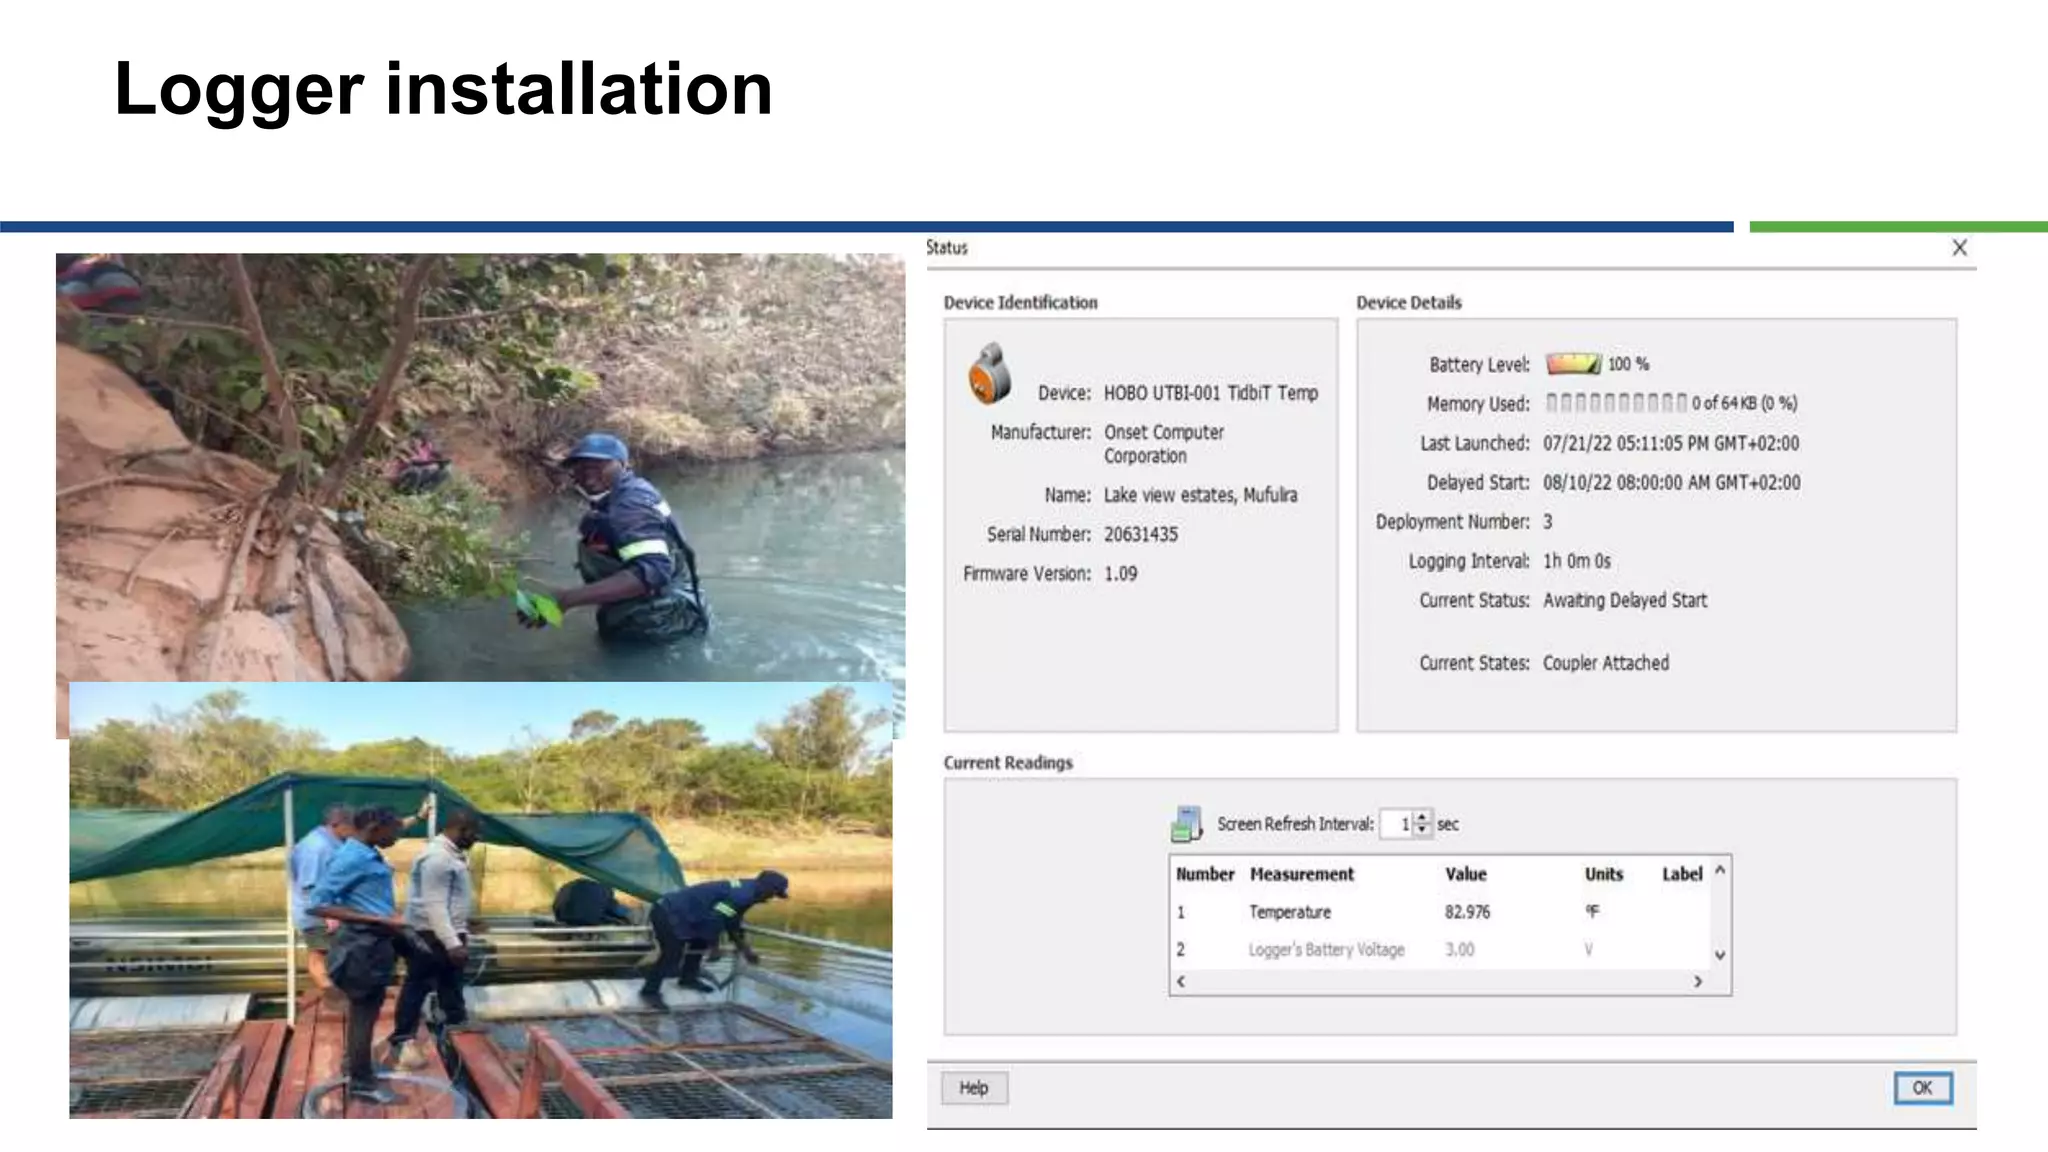
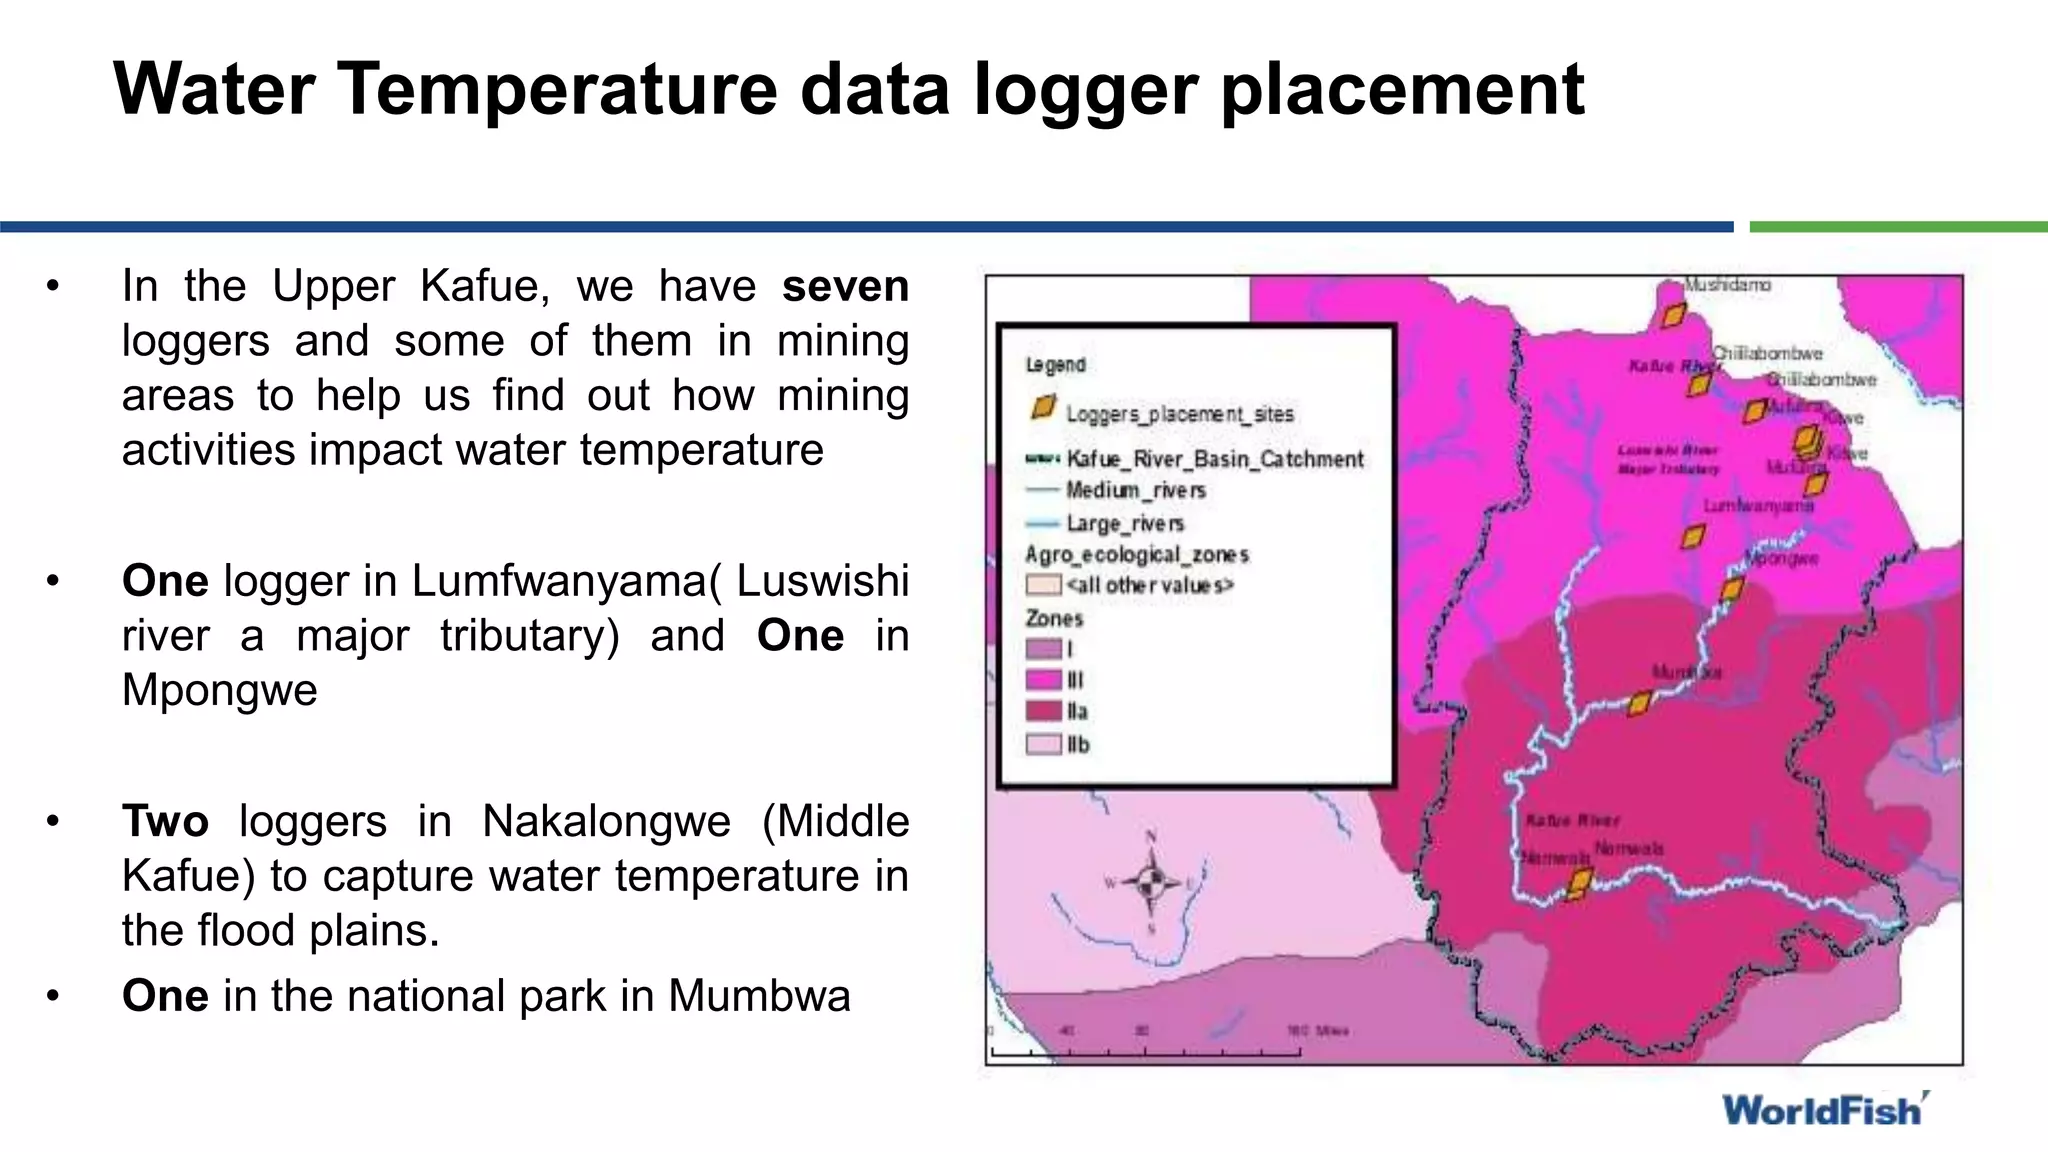
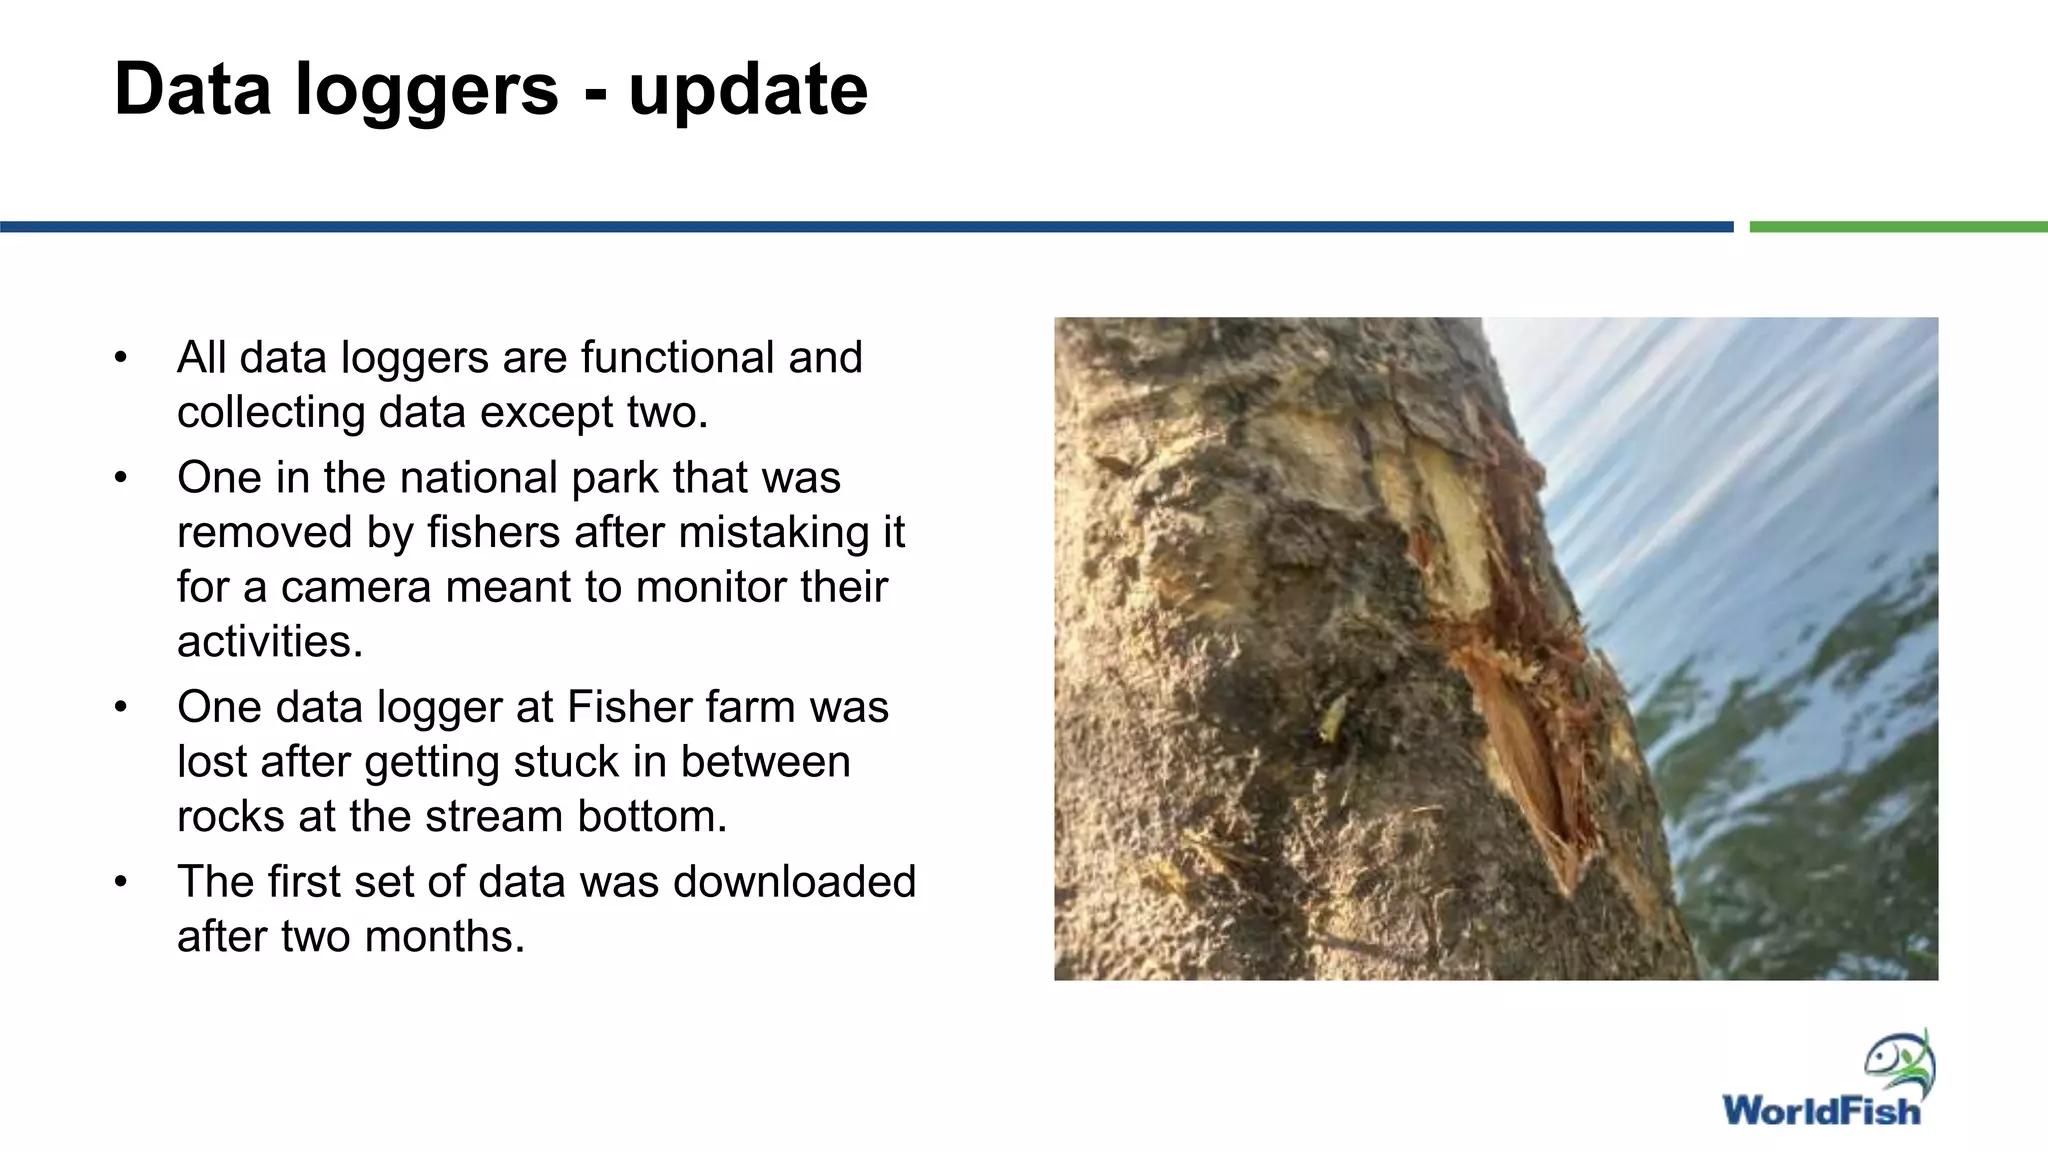
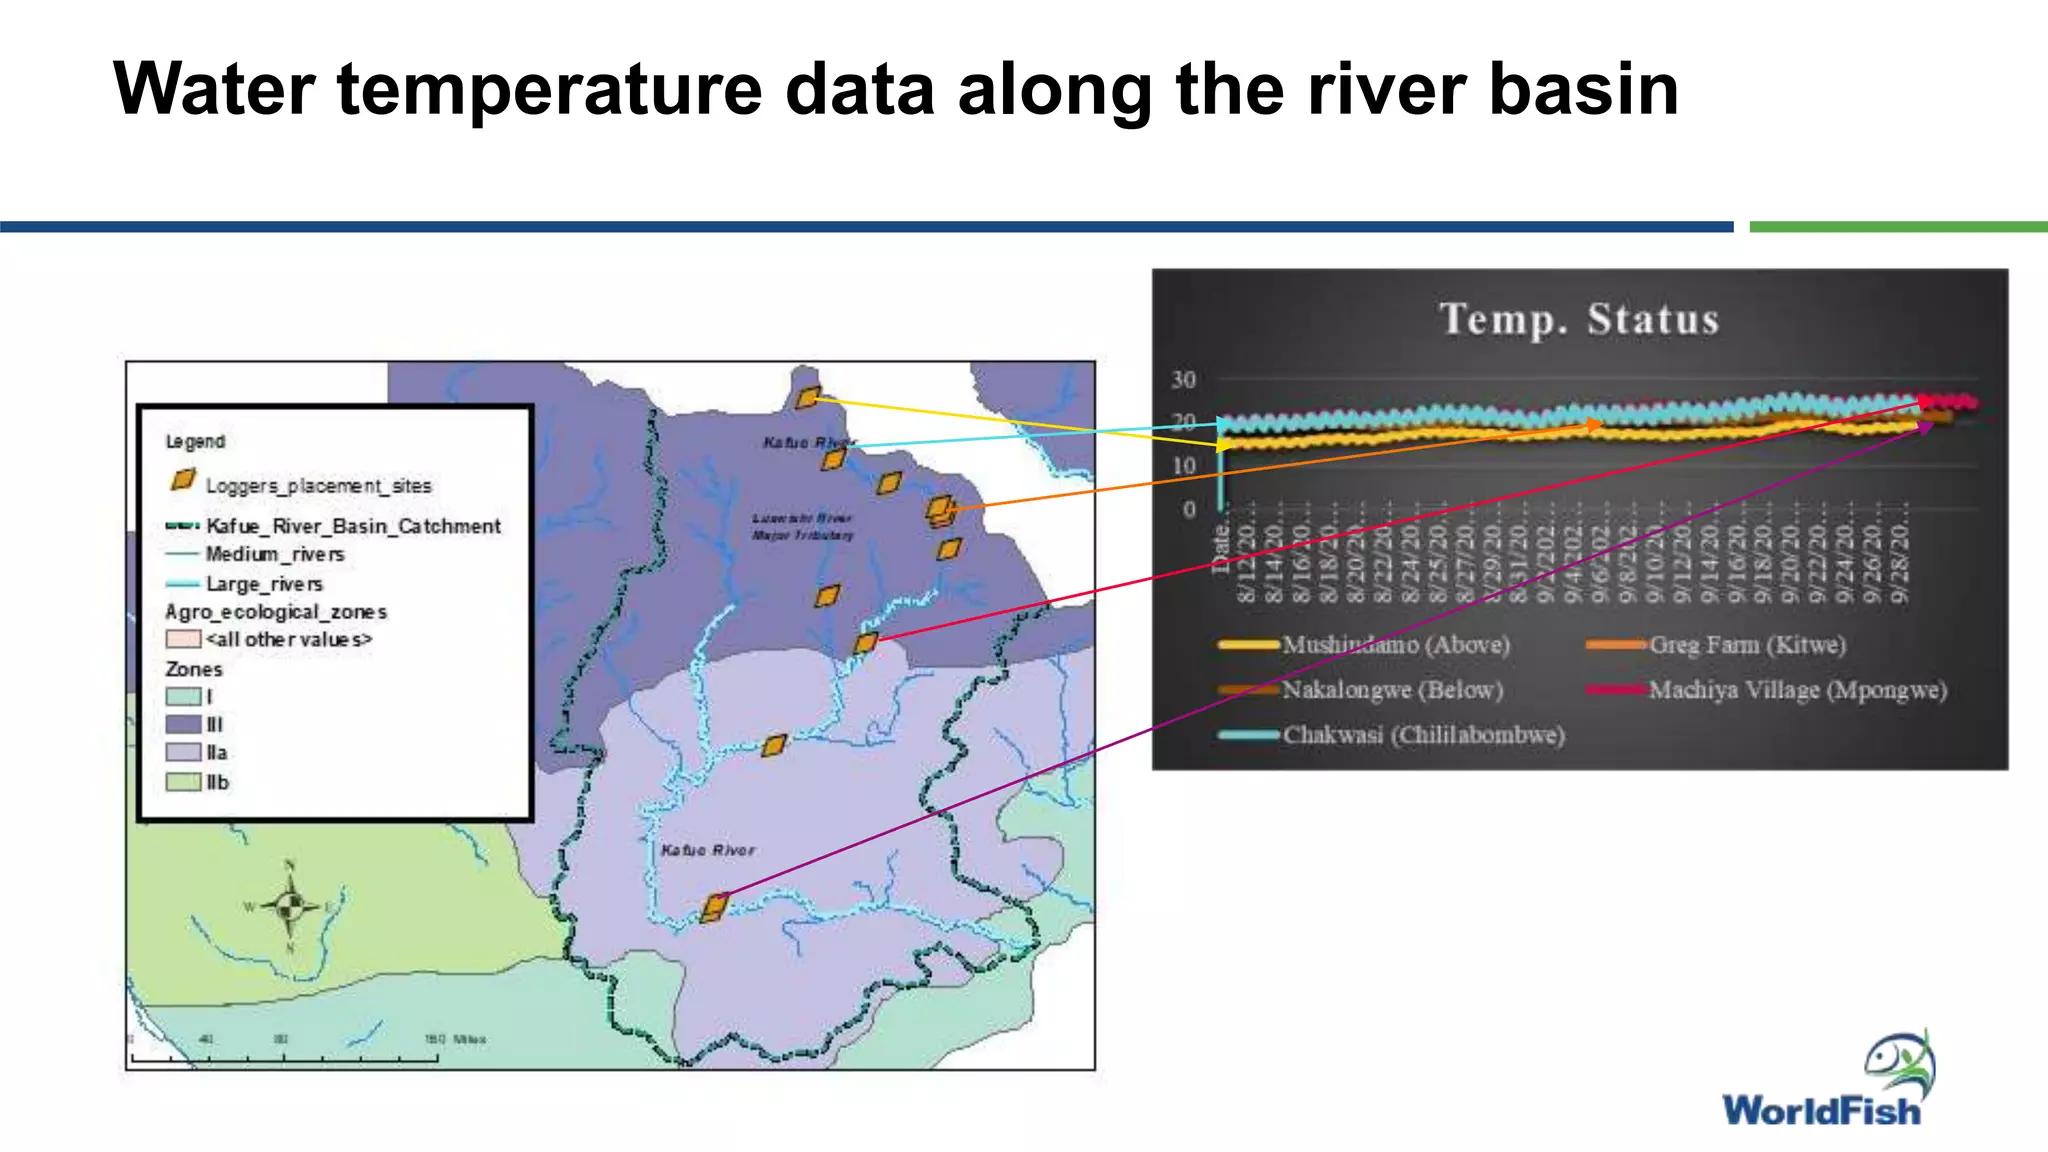
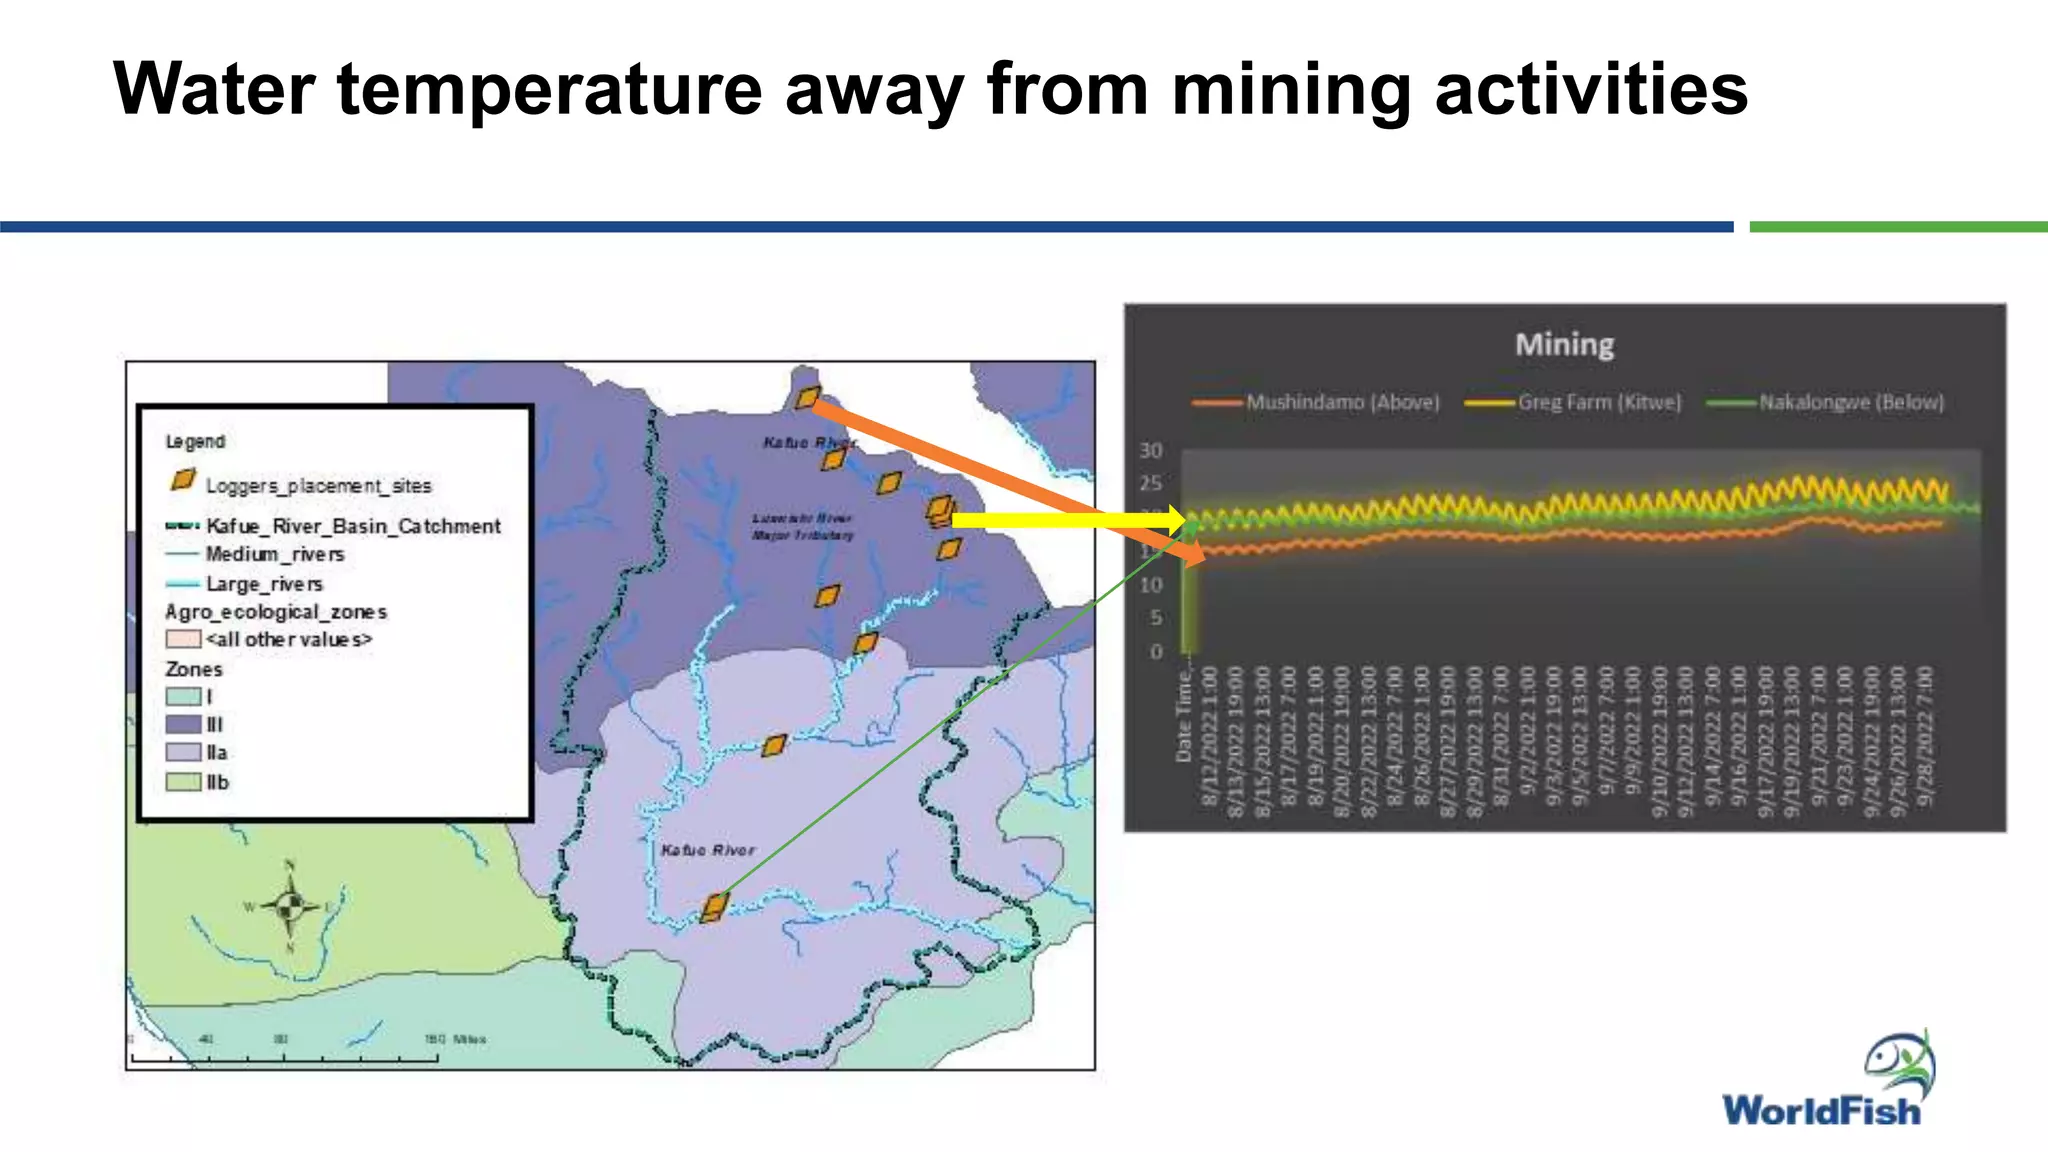
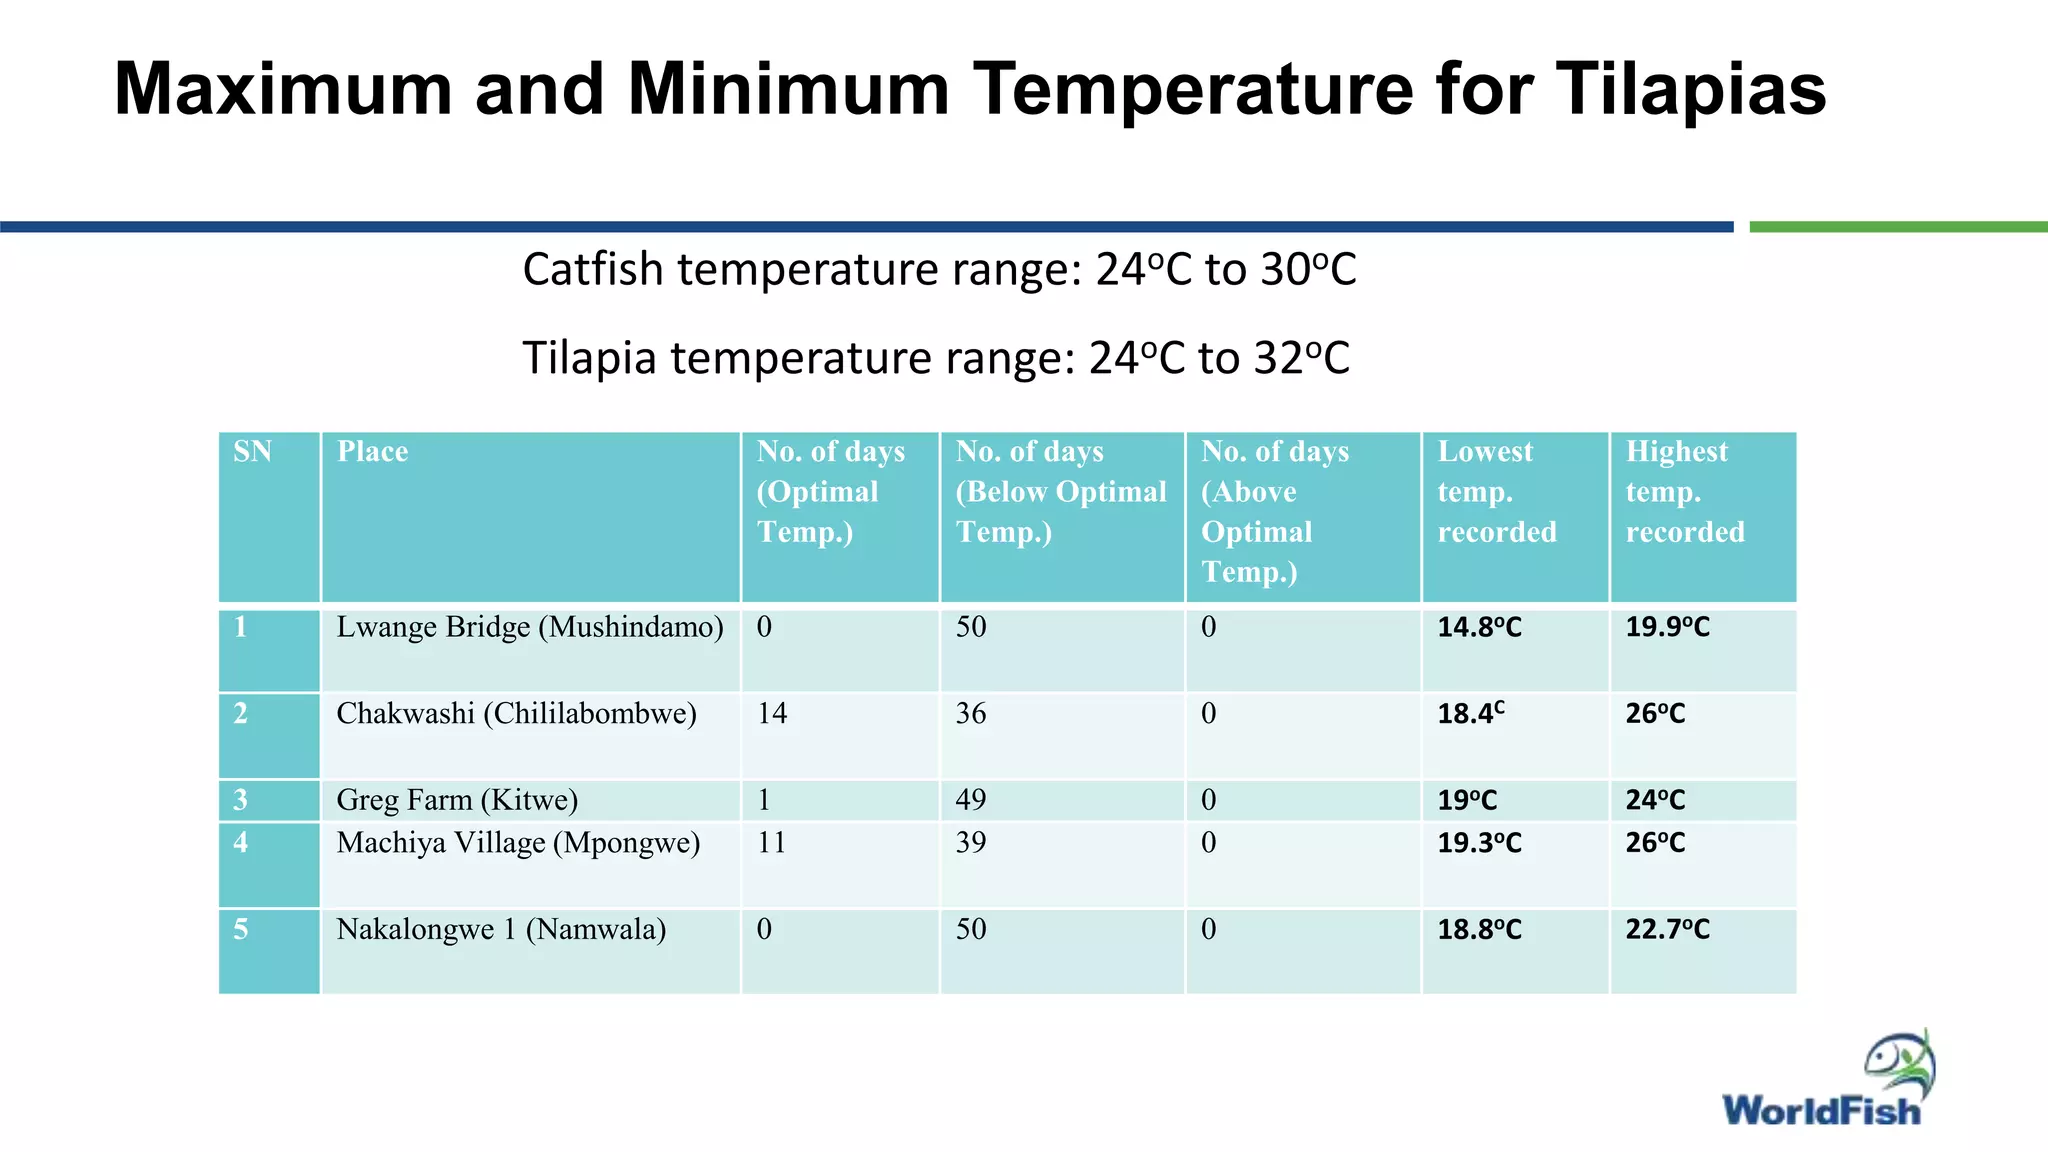
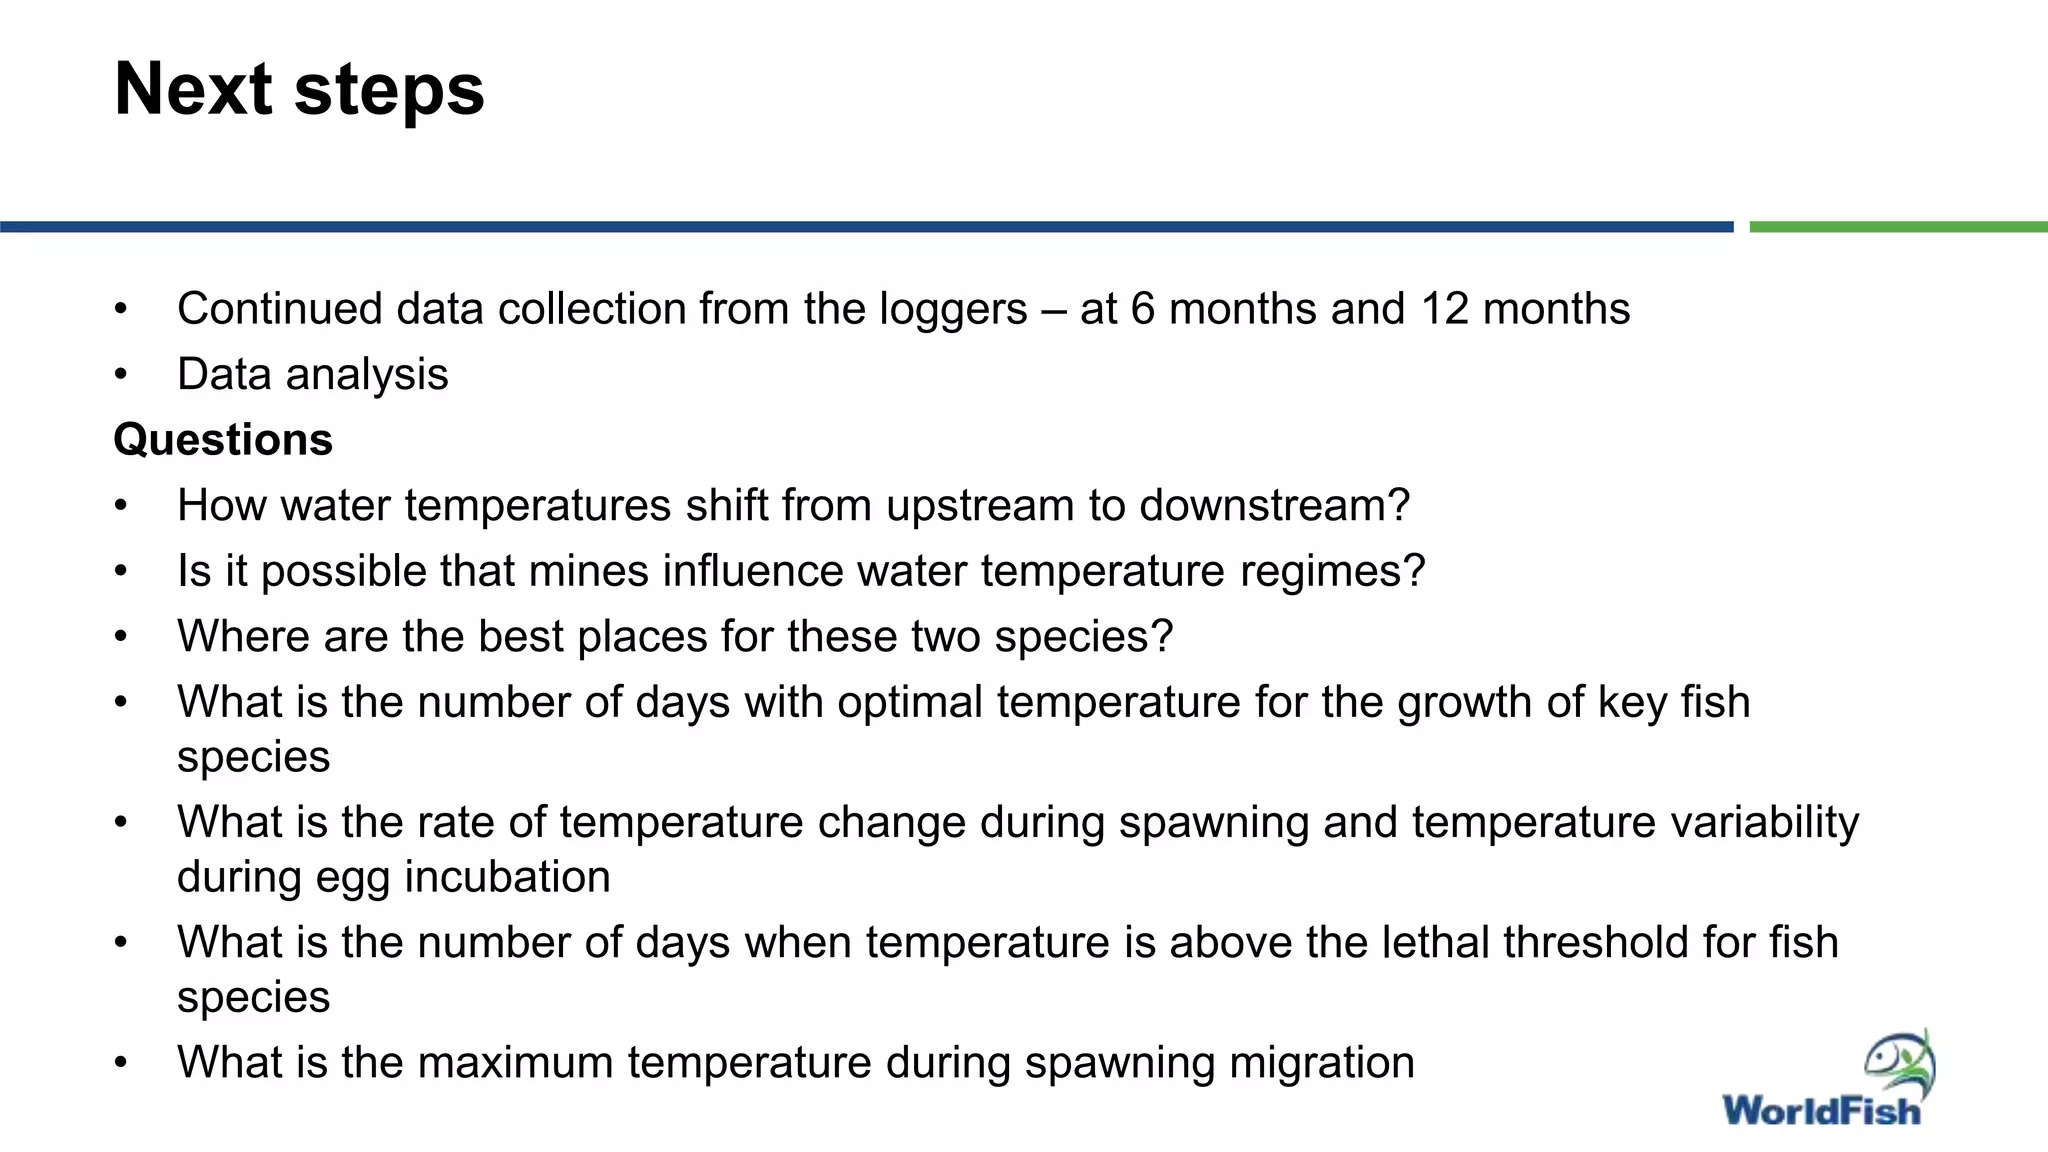
The Resilient River Basins: Counting Fish
from forests for Food Security
Water Temperature Monitoring using Field Sensors (Data Loggers) in the Kafue River
08/11/2022
Presenter: Henry Kanyembo
Prepared by Henry Kanyembo,
Mercy Sichone and Netsayi Mudege
Objectives of installing water temperature
data loggers
• To understand how temperatures are
changing along the Kafue river basin
• To understand how temperatures relate
to potential causes of heating or cooling
along the river basin
• To understand how the river basin biota
respond to temperature (e.g. relating
temperature to the presence,
abundance, or growth of species or
fisheries catches).
Why monitor water temperature in the basin
• Temperature is influenced by many factors (Cassie, 2006) including heat from solar
radiation, heat loss from evaporation, and inflows (ground water and tributaries), any
changes in watershed conditions will influence stream temperature.
• Temperature is a central force behind just about every biological process that takes
place within stream ecosystems (ranging from the speed of chemical reactions to
metabolic demand of fishes to ecosystem productivity).
• Help us understand seasonal and spatial patterns across the watershed.
• Help us identify locations of high suitability for particular fishes, areas of rapid change,
or areas where restoration might be most beneficial.
• Help us understand effects of mining on the watershed
Land use patterns
Logger Installation
• Ease of accessibility
• Security
• Adequate anchoring for cabling
• Geographical location - includes flood
plain channel, a major tributary and
head water areas.
• Adequate water depth where the data
loggers could remain under water
even at low flows
• Places where water mixes
Logger installation
Water Temperature data logger placement
• In the Upper Kafue, we have seven
loggers and some of them in mining
areas to help us find out how mining
activities impact water temperature
• One logger in Lumfwanyama( Luswishi
river a major tributary) and One in
Mpongwe
• Two loggers in Nakalongwe (Middle
Kafue) to capture water temperature in
the flood plains.
• One in the national park in Mumbwa
Data loggers - update
• All data loggers are functional and
collecting data except two.
• One in the national park that was
removed by fishers after mistaking it
for a camera meant to monitor their
activities.
• One data logger at Fisher farm was
lost after getting stuck in between
rocks at the stream bottom.
• The first set of data was downloaded
after two months.
Water temperature data along the river basin
Water temperature away from mining activities
Maximum and Minimum Temperature for Tilapias
SN Place No. of days
(Optimal
Temp.)
No. of days
(Below Optimal
Temp.)
No. of days
(Above
Optimal
Temp.)
Lowest
temp.
recorded
Highest
temp.
recorded
1 Lwange Bridge (Mushindamo) 0 50 0 14.8oC 19.9oC
2 Chakwashi (Chililabombwe) 14 36 0 18.4C 26oC
3 Greg Farm (Kitwe) 1 49 0 19oC 24oC
4 Machiya Village (Mpongwe) 11 39 0 19.3oC 26oC
5 Nakalongwe 1 (Namwala) 0 50 0 18.8oC 22.7oC
Catfish temperature range: 24oC to 30oC
Tilapia temperature range: 24oC to 32oC
Next steps
• Continued data collection from the loggers – at 6 months and 12 months
• Data analysis
Questions
• How water temperatures shift from upstream to downstream?
• Is it possible that mines influence water temperature regimes?
• Where are the best places for these two species?
• What is the number of days with optimal temperature for the growth of key fish
species
• What is the rate of temperature change during spawning and temperature variability
during egg incubation
• What is the number of days when temperature is above the lethal threshold for fish
species
• What is the maximum temperature during spawning migration
THANK YOU !

Water Temperature Monitoring using Field Sensors (Data Loggers) in the Kafue River

  • 1.
    The Resilient RiverBasins: Counting Fish from forests for Food Security Water Temperature Monitoring using Field Sensors (Data Loggers) in the Kafue River 08/11/2022 Presenter: Henry Kanyembo Prepared by Henry Kanyembo, Mercy Sichone and Netsayi Mudege
  • 2.
    Objectives of installingwater temperature data loggers • To understand how temperatures are changing along the Kafue river basin • To understand how temperatures relate to potential causes of heating or cooling along the river basin • To understand how the river basin biota respond to temperature (e.g. relating temperature to the presence, abundance, or growth of species or fisheries catches).
  • 3.
    Why monitor watertemperature in the basin • Temperature is influenced by many factors (Cassie, 2006) including heat from solar radiation, heat loss from evaporation, and inflows (ground water and tributaries), any changes in watershed conditions will influence stream temperature. • Temperature is a central force behind just about every biological process that takes place within stream ecosystems (ranging from the speed of chemical reactions to metabolic demand of fishes to ecosystem productivity). • Help us understand seasonal and spatial patterns across the watershed. • Help us identify locations of high suitability for particular fishes, areas of rapid change, or areas where restoration might be most beneficial. • Help us understand effects of mining on the watershed
  • 4.
  • 5.
    Logger Installation • Easeof accessibility • Security • Adequate anchoring for cabling • Geographical location - includes flood plain channel, a major tributary and head water areas. • Adequate water depth where the data loggers could remain under water even at low flows • Places where water mixes
  • 6.
  • 7.
    Water Temperature datalogger placement • In the Upper Kafue, we have seven loggers and some of them in mining areas to help us find out how mining activities impact water temperature • One logger in Lumfwanyama( Luswishi river a major tributary) and One in Mpongwe • Two loggers in Nakalongwe (Middle Kafue) to capture water temperature in the flood plains. • One in the national park in Mumbwa
  • 8.
    Data loggers -update • All data loggers are functional and collecting data except two. • One in the national park that was removed by fishers after mistaking it for a camera meant to monitor their activities. • One data logger at Fisher farm was lost after getting stuck in between rocks at the stream bottom. • The first set of data was downloaded after two months.
  • 9.
    Water temperature dataalong the river basin
  • 10.
    Water temperature awayfrom mining activities
  • 11.
    Maximum and MinimumTemperature for Tilapias SN Place No. of days (Optimal Temp.) No. of days (Below Optimal Temp.) No. of days (Above Optimal Temp.) Lowest temp. recorded Highest temp. recorded 1 Lwange Bridge (Mushindamo) 0 50 0 14.8oC 19.9oC 2 Chakwashi (Chililabombwe) 14 36 0 18.4C 26oC 3 Greg Farm (Kitwe) 1 49 0 19oC 24oC 4 Machiya Village (Mpongwe) 11 39 0 19.3oC 26oC 5 Nakalongwe 1 (Namwala) 0 50 0 18.8oC 22.7oC Catfish temperature range: 24oC to 30oC Tilapia temperature range: 24oC to 32oC
  • 12.
    Next steps • Continueddata collection from the loggers – at 6 months and 12 months • Data analysis Questions • How water temperatures shift from upstream to downstream? • Is it possible that mines influence water temperature regimes? • Where are the best places for these two species? • What is the number of days with optimal temperature for the growth of key fish species • What is the rate of temperature change during spawning and temperature variability during egg incubation • What is the number of days when temperature is above the lethal threshold for fish species • What is the maximum temperature during spawning migration
  • 13.

Editor's Notes

  • #4 I thought you were also interested in looking at the effects of mines
  • #9 No need to tell the audience if you once thought you could collect data after a month – two months to retrieve the data is fine. Did you get the logger back in the national park? Funny story. No we didn’t manage to retrieve it… Indeed..
  • #12 This is cool – so you could calculate the days instead each fish range at each site. I would but column of lowest temps before hightest so you can read left to right to see the range (and it matches the above for fish)
  • #13  Can you list the questions you hope to answer? How to water temperatures shift from upstream to downstream? Is it possible that mines influence water temperature regimes? Where are the best places for these two species?