
![Agricultural Outlook 2015-2024
II. PRODUCTION OUTLOOK: Growth concentrated in regions where resources
are less constraining
THE PRESENT
In the past decade, demand was moderately growing, hence production was in
effect, gradually rising.
Production trend has been dependent on use of land. Since land prices have been
high in the last decade, therefore it has been used for purposes other than
agriculture.
THE FUTURE
In the coming decade, production will depend on dietary preferences more than
use of land. This primarily implies that production of oilseeds is likely to go up,
while cereals production will also rise – on account of higher coarse cereals
production.
[320 Mn tonnes of additional cereals will be produced by 2024, of which 180 Mn
tonnes is coarse cereals alone]
WHAT CHANGES
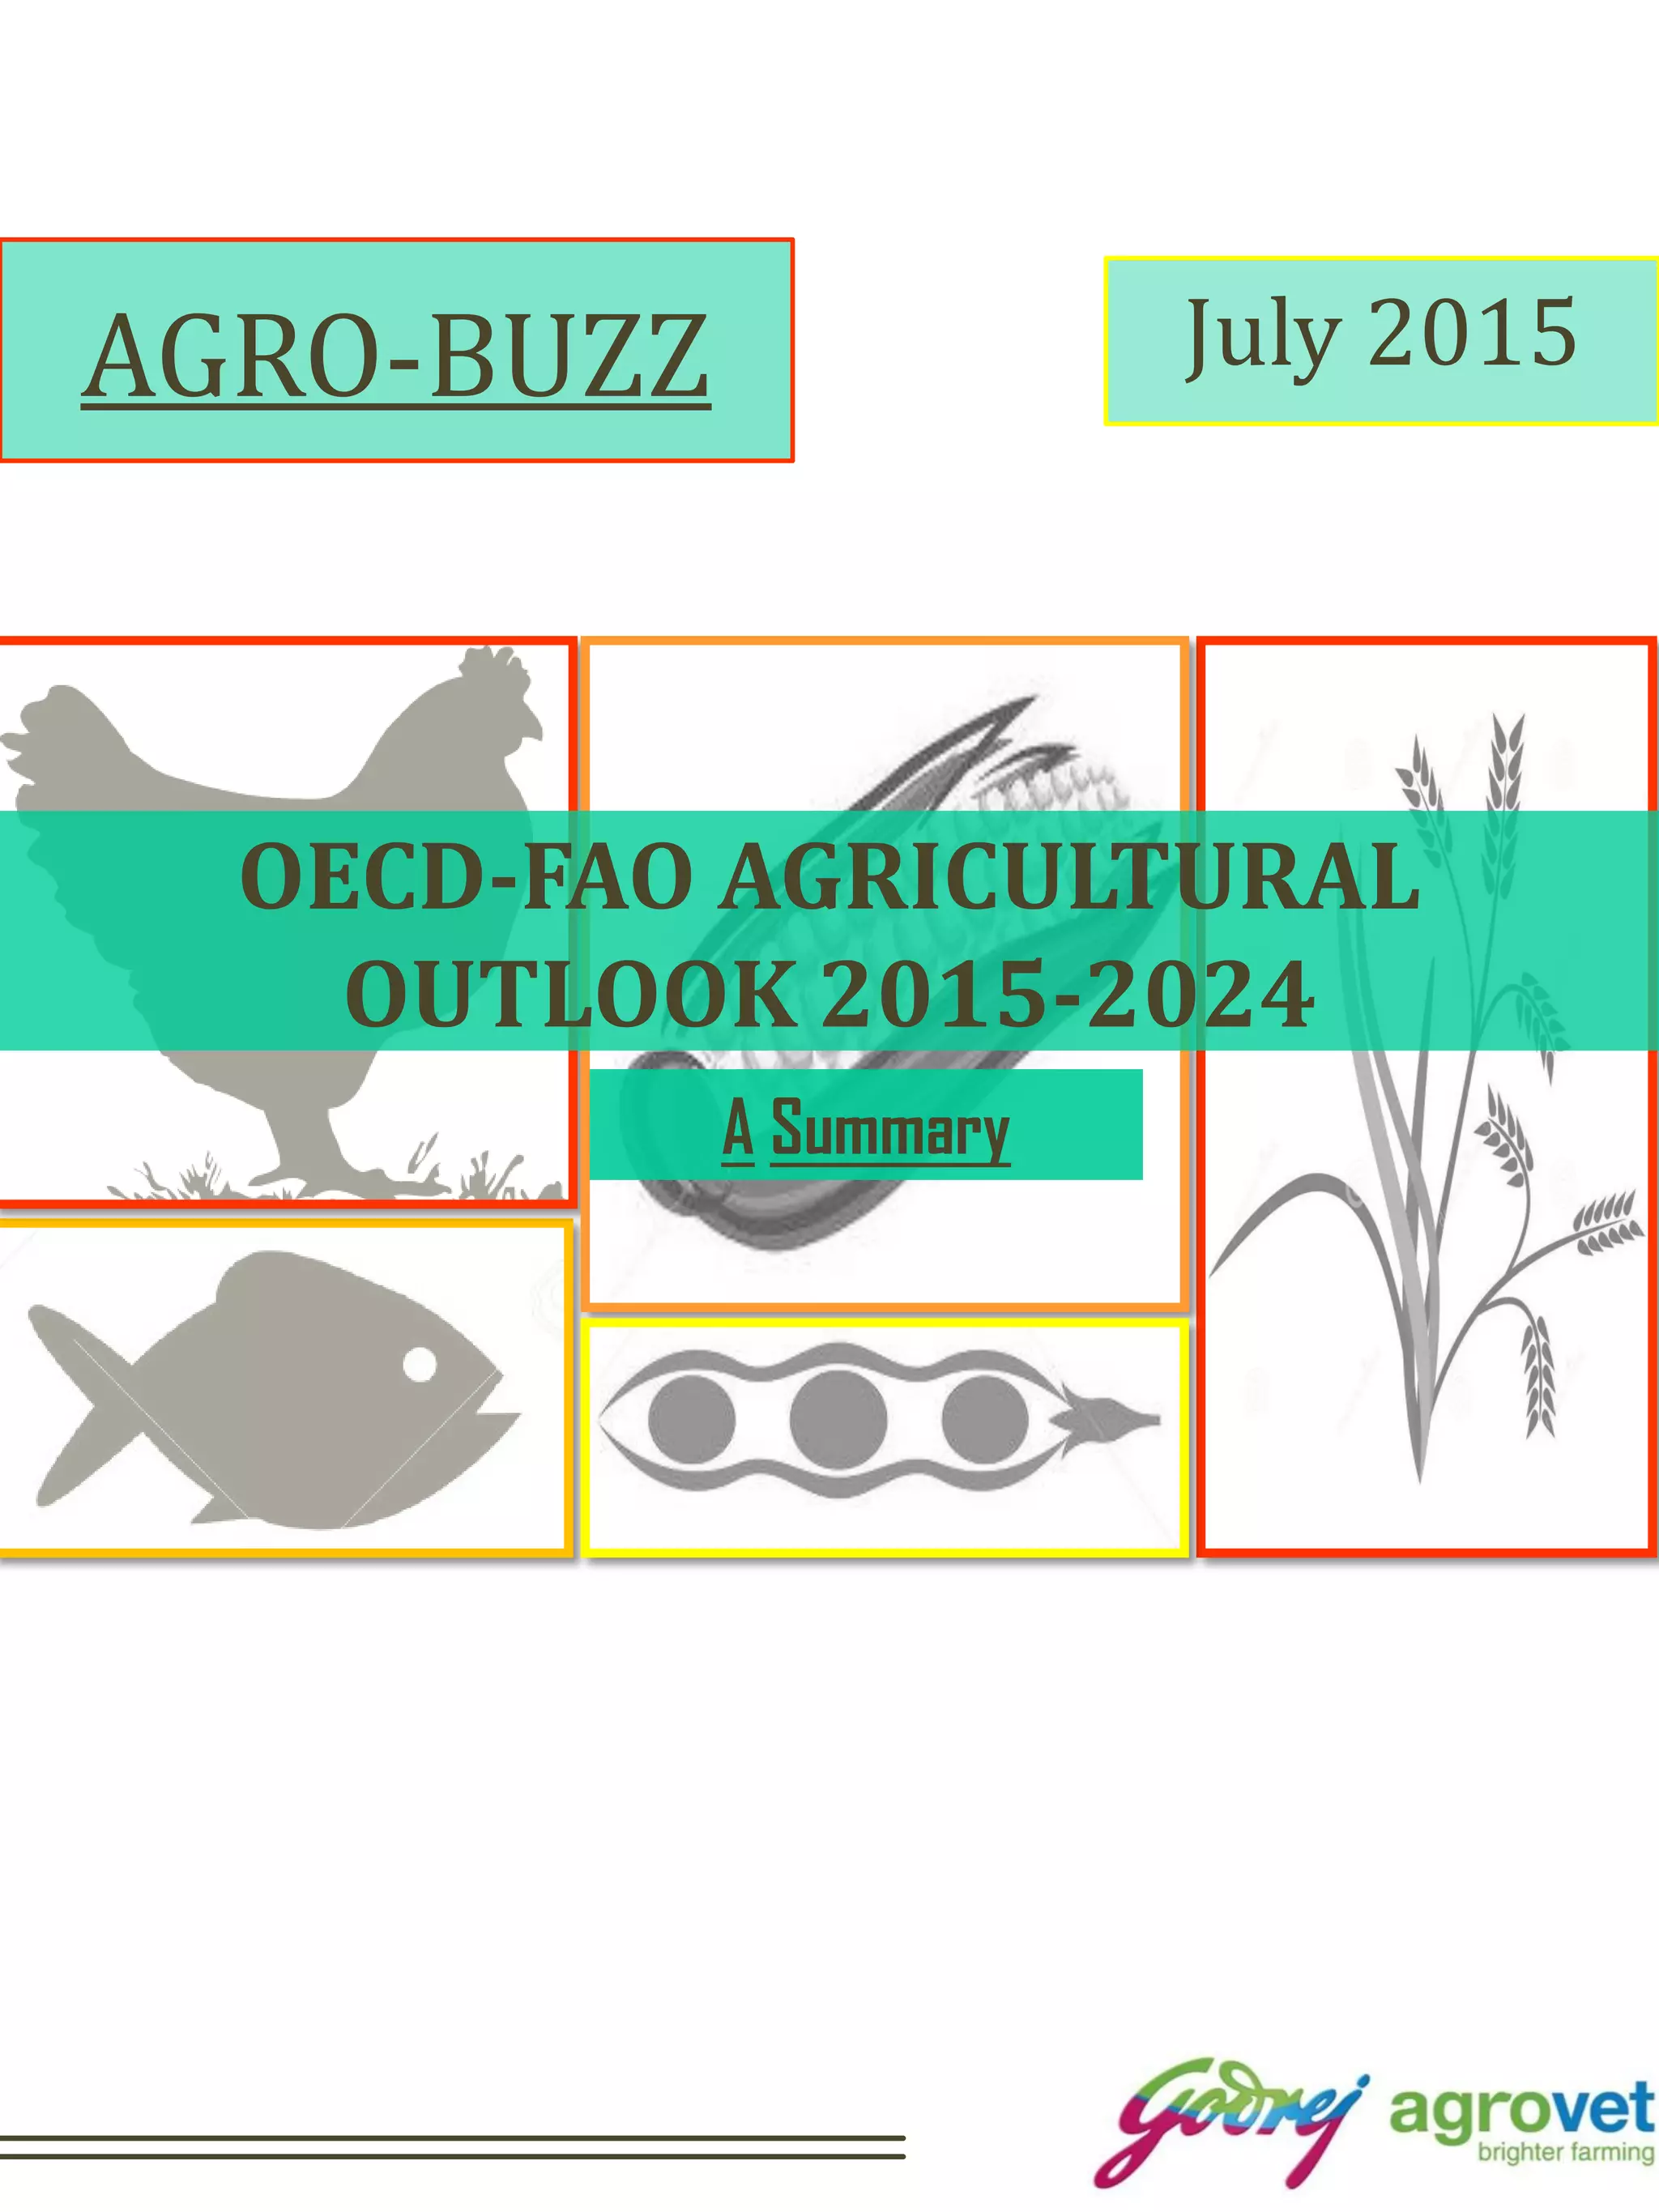
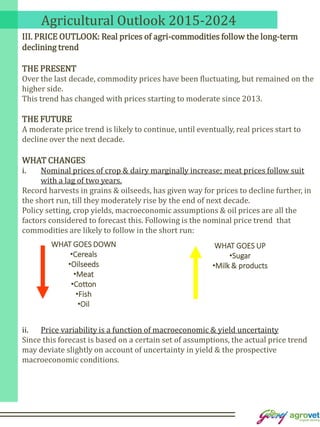
i. Improved profitability in the livestock sector
Even though supply got restricted due to a number of disease outbreaks, high
meat prices, and a sharp decline in feed prices [in USA, EU, Canada & China
markets], allowed the livestock industry to remain profitable.
This trend [of meat to feed price ratio] is likely to continue over the next decade
and therefore support production, which is projected to expand by 24% over
the outlook period. Consequently this pushes up production of feed, and
hence oilseeds.
~ 26 Mn tonnes of additional poultry meat will be produced globally.
-5
5
15
25
35
Skim milk
powder
Whole milk
powder
Butter Sheep Cheese Beef Pork Poultry Fish
Increase in volume (%) 2024 over 2012-14
Developed countries Developing countries Least Developed Countries](https://image.slidesharecdn.com/agrobuzzjulyedition-160308063644/85/Agro-buzz-Agricultural-Outlook-2024-5-320.jpg)
![Agricultural Outlook 2015-2024
COMMODITY SNAPSHOTS
A. CEREALS
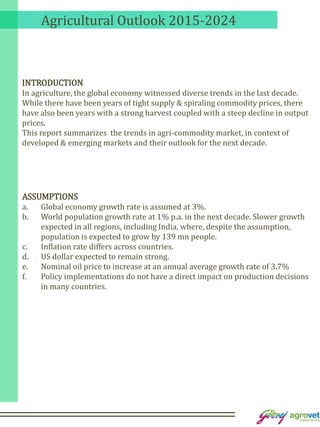
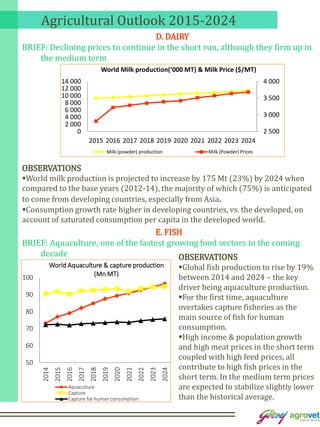
BRIEF: Increased total production & decline in prices on account of high
coarse grain production
WHEAT UNIT 2012-14 (Avg) 2024 (F) GROWTH RATE
Production MnMT 700 787 12%
Consumption MnMT 694 784 13%
Price $/MT 302 272 -10%
RICE UNIT 2012-14 (Avg) 2024 (F) GROWTH RATE
Production MnMT 494 564 14%
Consumption MnMT 488 562 15%
Price $/MT 519 449 -13%
COARSE GRAINS UNIT 2012-14 (Avg) 2024 (F) GROWTH RATE
Production MnMT 1255 1449 15%
Consumption MnMT 1215 1440 19%
Price $/MT 227 194 -15%
OBSERVATIONS
Cereal production is forecasted to increase by 14% over the next decade primarily
due to yield improvement as area under sowing is expected to be more or less
stagnant.
Among these, coarse cereals has the highest production levels on account of
demand and final use as animal feed.
Of the 225 Mn MT of increase in consumption of coarse cereals, about 2/3rd is on
account of feed use [156 Mn MT]
Most of the additional feed is going to be consumed in developing countries (1030
MT) to feed an expanding livestock sector.](https://image.slidesharecdn.com/agrobuzzjulyedition-160308063644/85/Agro-buzz-Agricultural-Outlook-2024-7-320.jpg)
![Agricultural Outlook 2015-2024
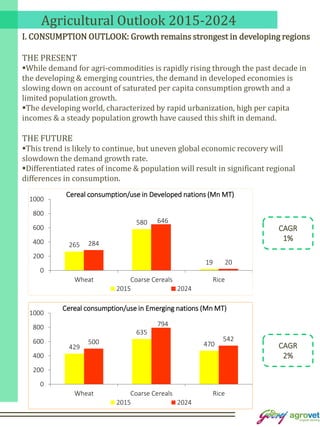
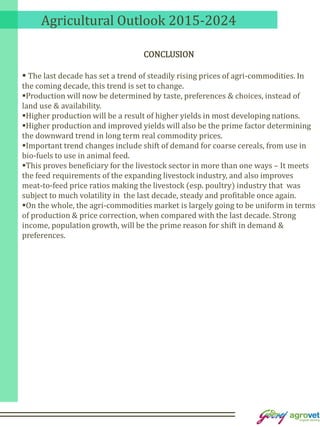
B. OILSEEDS
BRIEF: Record oilseed production to continue but edible oil production to
marginally rise on account of slower expansion of palm oil – price to
increase at a slow pace in the long term
425
169
58
20
516
211
77
28
0
200
400
600
Oilseeds Vegetable Oil Palm Oil Bio-Fuel
World Oil & oilseed Production (Mn MT)
2012-14(Avg.) 2024
OBSERVATIONS
Despite a significant rise in oil seed production, the same is not reflected in
vegetable oil production, as palm oil production rises only marginally
Demand for protein meal rises as the livestock sector expands. Increased
production initially pushes the price down, however, demand catches up with
supply in the long term putting protein meal prices on an upward trajectory.
Growth in vegetable oil production slows considerably in countries that
traditionally produce high oil yielding crops such as sunflower and rapeseed, partly
due to limited growth in biodiesel production, for which vegetable oil represents
the main feedstock.
This reduced growth in bio-fuel production will cause recovery of vegetable oil
prices to be slower than that of protein meal prices.
0
500
1,000
Price recovery comparison of vegetable oil vs. protein meal
[$/MT] [World avg.]
Vegetable oil Protein meal](https://image.slidesharecdn.com/agrobuzzjulyedition-160308063644/85/Agro-buzz-Agricultural-Outlook-2024-8-320.jpg)
![Agricultural Outlook 2015-2024
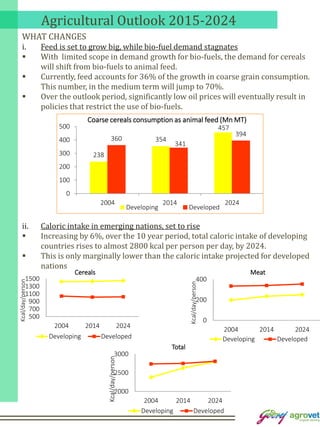
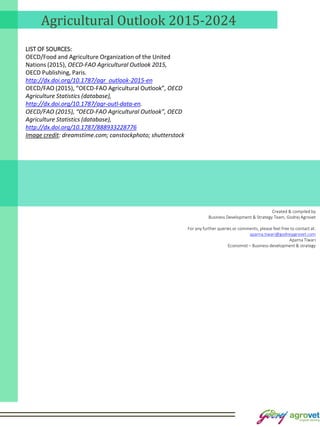
C. MEAT
BRIEF: Meat industry expands at a slower rate yet, positive outlook on
account of low feed grain prices
0
50 000
100 000 World Poultry Meat consumption forecast (‘000 MT)
Developing countries Developed countries
The widening
gap
OBSERVATIONS
Consumption growth rate in developed countries over the projection period
stagnates, while total consumption in developing countries grows robustly. [See
graph above]
Yet, consumption per capita of meat in developed countries is expected to remain
more than double than in the developing countries (68 kg per person per year as
compared to 28 kg per person per year)
Rapid population growth and urbanization within many developing regions
remains a core driver of total consumption growth.
In the long term real prices will fall even though nominal prices start to rise.
Poultry meat will capture more than half of the additional meat produced globally
by 2024, compared to 2012-14. In general, production will also benefit from both
improved meat-to-feed price margins as well as better feed conversion ratios in the
next decade.
1000
1500
2000
2500
2014 2015 2016 2017 2018 2019 2020 2021 2022 2023 2024
Real vs. nominal price trend [world avg.] of poultry meat
( $/MT)
Nominal Price Real Price](https://image.slidesharecdn.com/agrobuzzjulyedition-160308063644/85/Agro-buzz-Agricultural-Outlook-2024-9-320.jpg)

The OECD-FAO Agricultural Outlook 2015-2024 provides insights into global agricultural trends, noting a shift in demand from developed to developing economies due to urbanization and population growth. It predicts a rise in production driven by dietary preferences rather than land use, with significant increases in cereals and meat production, particularly in developing regions, while overall agri-commodity prices are expected to decline in the long term. Key changes include a shift in coarse grains from bio-fuel to animal feed, benefitting the livestock sector.


