Downloaded 66 times


![Software By Numbers & Project Portfolios
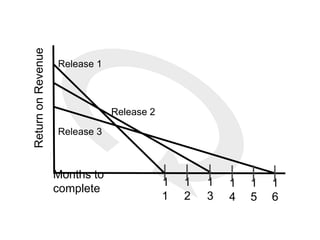
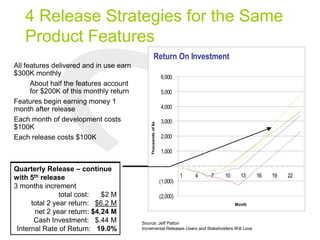
Software by Numbers [Denne & Cleland-Huang] describes
Incremental Funding Methodology [IFM]
Goal to reduce necessary cash outlay
Make projects self-funding
Increase return on investment
SBN Tools:
http://dactyl.cti.depaul.edu/ifm/default.htm
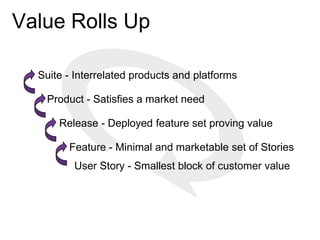
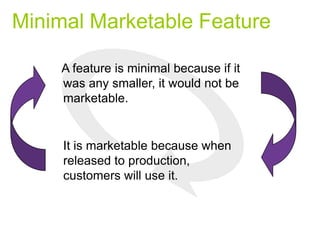
SBN introduces the concept of Minimal Marketable Feature –
MMF - the smallest sized feature that would have
marketable value
SBN simple financial models provide guidance on evaluating
multiple projects in a portfolio](https://image.slidesharecdn.com/agilepm-140409183015-phpapp01/85/Agile-Product-Owner-43-320.jpg)


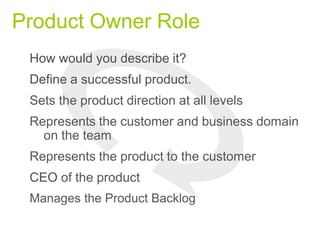
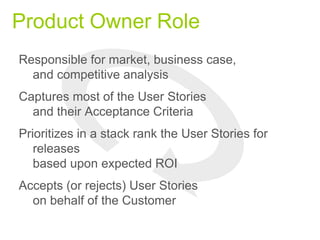
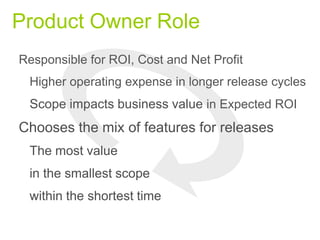
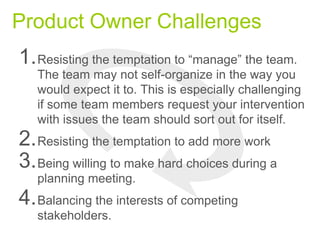
The document outlines the role and responsibilities of an Agile Product Owner, emphasizing the significance of making profitable software development decisions, managing the product backlog, and prioritizing user stories based on expected ROI. It addresses challenges faced by Product Owners and illustrates various planning waves for product, release, feature, and story levels while highlighting the importance of incremental funding methodology and understanding market needs. Additionally, it discusses strategies for prioritizing features and maximizing return on investment through effective release planning.


