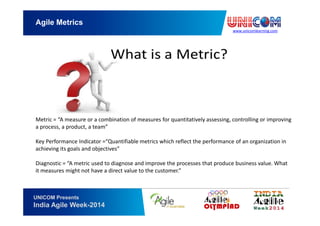
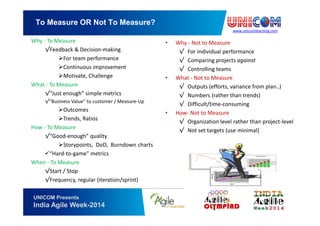
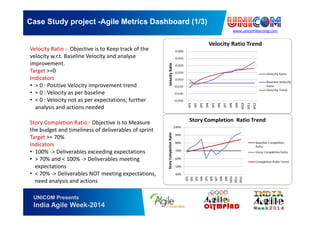
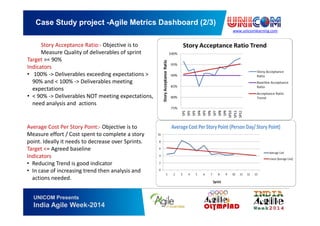
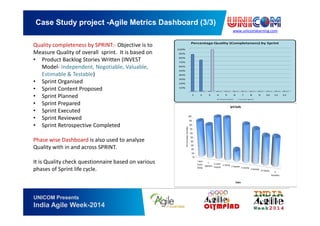
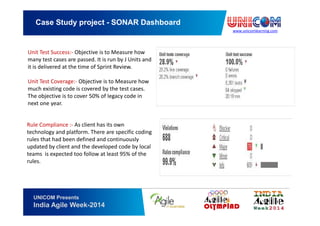
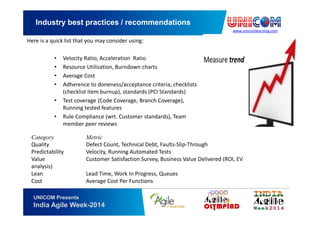
www.unicomlearning.com
India Agile Week-2014
13-June-2014, Mumbai
Agile Metrics: Boon or Bane?
Suchitra Vasudevan
General Manger
Atos India Pvt. Ltd.
www.agileinbusiness.com
Samir Umrikar
Associate Manager
www.unicomlearning.com
Agile Metrics
UNICOM Presents
India Agile Week-2014
www.unicomlearning.com
Agile Metrics - Agenda
UNICOM Presents
India Agile Week-2014
To Measure or Not to Measure?
Challenges faced
Case study of project
Industry best practices /
recommendations
Q& A
www.unicomlearning.com
Agile Metrics
UNICOM Presents
India Agile Week-2014
Metric = “A measure or a combination of measures for quantitatively assessing, controlling or improving
a process, a product, a team”
Key Performance Indicator =“Quantifiable metrics which reflect the performance of an organization in
achieving its goals and objectives”
Diagnostic = “A metric used to diagnose and improve the processes that produce business value. What
it measures might not have a direct value to the customer.”
www.unicomlearning.com
To Measure OR Not To Measure?
UNICOM Presents
India Agile Week-2014
Why - To Measure
√Feedback & Decision-making
For team performance
Continuous improvement
Motivate, Challenge
What - To Measure
√“Just enough” simple metrics
√“Business Value” to customer / Measure-Up
Outcomes
Trends, Ratios
How - To Measure
√“Good-enough” quality
Storypoints, DoD, Burndown charts
“Hard-to-game” metrics
When - To Measure
√Start / Stop
√Frequency, regular (iteration/sprint)
• Why - Not to Measure
√ For individual performance
√ Comparing projects against
√ Controlling teams
• What - Not to Measure
√ Outputs (efforts, variance from plan..)
√ Numbers (rather than trends)
√ Difficult/time-consuming
• How- Not to Measure
√ Organization level rather than project-level
√ Not set targets (use minimal)
www.unicomlearning.com
Journey to Agile
UNICOM Presents
India Agile Week-2014
Client was completely following waterfall /
iterative model till 2011
Agile / Scrum methodology started
implementing in project in early 2012 –
closely linked to agile Global Delivery
Platform with customization specific to
client
Deliver highest business value with
real working software to customer in
the shortest time.
Status:
80% Java projects around 25 projects,
170 team members following Agile
www.unicomlearning.com
Challenges faced / Solutions applied – 1/2
UNICOM Presents
India Agile Week-2014
▶ Team new to Agile
– Scrum Training for teams, 35 Certified Scrum Masters (CSM) & 2 PO
– Agile Club – Monthly meeting to share best practices (client, local)
– Agile Day – KXC for team with innovation games and lessons learned
Distributed delivery and roles spread across locations
– Scrum Masters in each location working with local scrum teams Sometimes
appointed 2 Scrum masters for a sprint
– Backup of key roles PO and SM present at offshore
– For large teams - daily Scrum meeting at each location using Lync (taking
time-zone constraints), “Scrum of scrum” meeting between Scrum Masters
across locations
▶ Common estimation model, standard definition of story points
– Complexity guideline template with guidelines at project-level to define
story points
– No standard estimation model defined
www.unicomlearning.com
Improvements : Lessons Learned from Agile
UNICOM Presents
India Agile Week-2014
Good practices / Learnings
Experience & Knowledge
Customer Brainstorming QualityEmployees
• Agile Club – extended
with local experts
• Deputy of client Key roles
(PO, SM) in local
• Mandatory Demo with
PO in sprint
• Agile Day - KXC, Quiz
• Lessons Learned in
Retrospective meetings
• Customization of Agile
based on client context
⇒Pair-programming of
new and experienced
members
⇒Roles matched across
distributed teams
• Scrum training,
certification (35 Certified
Scrum Masters, 2 Product
Owner)
• Daily scrum meetings with
teams and “Scrum of
Scrum” weekly across
locations
• Definition of “Done”
standardized
• Continuous
Integration (SONAR
dashboard,
automated testing)
• Usage of Jira
dashboard
www.unicomlearning.com
Case Study Project - Overview
UNICOM Presents
India Agile Week-2014
▶ Tools used to mange SCRUM / Agile Practices : JIRA + Green Hopper
Plug-in
▶ Scrum Team Size: 6 to 8
▶ Product Owner Role is performed by someone from client team. However
there are 2 product owners now in local team.
▶ Scrum Master Role is performed by local / client
▶ Sprint Size: 2 to 4 weeks
▶ Product Owner makes Release and Sprint backlog in JIRA.
▶ Before starting a sprint, local team provides the capacity to client team
considering public / personal holidays of local team members working on
the sprint.
▶ Local team receive requirements for a given sprint (ppt, doc). client
team also creates stories for each sprint in JIRA.
www.unicomlearning.com
Case Study project -Agile Metrics Dashboard (1/3)
UNICOM Presents
India Agile Week-2014
Velocity Ratio :- Objective is to Keep track of the
velocity w.r.t. Baseline Velocity and analyse
improvement.
Target >=0
Indicators
• > 0 : Positive Velocity improvement trend
• = 0 : Velocity as per baseline
• < 0 : Velocity not as per expectations; further
analysis and actions needed
Story Completion Ratio:- Objective is to Measure
the budget and timeliness of deliverables of sprint
Target >= 70%
Indicators
• 100% -> Deliverables exceeding expectations
• > 70% and < 100% -> Deliverables meeting
expectations
• < 70% -> Deliverables NOT meeting expectations,
need analysis and actions
www.unicomlearning.com
Case Study project -Agile Metrics Dashboard (2/3)
UNICOM Presents
India Agile Week-2014
Story Acceptance Ratio:- Objective is to
Measure Quality of deliverables of sprint
Target >= 90%
Indicators
• 100% -> Deliverables exceeding expectations >
90% and < 100% -> Deliverables meeting
expectations
• < 90% -> Deliverables NOT meeting expectations,
need analysis and actions
Average Cost Per Story Point:- Objective is to
Measure effort / Cost spent to complete a story
point. Ideally it needs to decrease over Sprints.
Target <= Agreed baseline
Indicators
• Reducing Trend is good indicator
• In case of increasing trend then analysis and
actions needed.
www.unicomlearning.com
Case Study project -Agile Metrics Dashboard (3/3)
UNICOM Presents
India Agile Week-2014
Quality completeness by SPRINT:- Objective is to
Measure Quality of overall sprint. It is based on
• Product Backlog Stories Written (INVEST
Model- Independent, Negotiable, Valuable,
Estimable & Testable)
• Sprint Organised
• Sprint Content Proposed
• Sprint Planned
• Sprint Prepared
• Sprint Executed
• Sprint Reviewed
• Sprint Retrospective Completed
Phase wise Dashboard is also used to analyze
Quality with in and across SPRINT.
It is Quality check questionnaire based on various
phases of Sprint life cycle.
www.unicomlearning.com
Case Study project - SONAR Dashboard
UNICOM Presents
India Agile Week-2014
Unit Test Success:- Objective is to Measure how
many test cases are passed. It is run by J Units and
it is delivered at the time of Sprint Review.
Unit Test Coverage:- Objective is to Measure how
much existing code is covered by the test cases.
The objective is to cover 50% of legacy code in
next one year.
Rule Compliance :- As client has its own
technology and platform. There are specific coding
rules that had been defined and continuously
updated by client and the developed code by local
teams is expected too follow at least 95% of the
rules.
www.unicomlearning.com
Industry best practices / recommendations
UNICOM Presents
India Agile Week-2014
Here is a quick list that you may consider using:
• Velocity Ratio, Acceleration Ratio
• Resource Utilization, Burndown charts
• Average Cost
• Adherence to doneness/acceptance criteria, checklists
(checklist item burnup), standards (PCI Standards)
• Test coverage (Code Coverage, Branch Coverage),
Running tested features
• Rule Compliance (wrt. Customer standards), Team
member peer reviews
Category Metric
Quality Defect Count, Technical Debt, Faults-Slip-Through
Predictability Velocity, Running Automated Tests
Value Customer Satisfaction Survey, Business Value Delivered (ROI, EV
analysis)
Lean Lead Time, Work In Progress, Queues
Cost Average Cost Per Functions
www.unicomlearning.com
Questions / Queries
UNICOM Presents
India Agile Week-2014
www.unicomlearning.com
Agile Metrics - Agenda
UNICOM Presents
India Agile Week-2014
List of references
• http://www.slideshare.net
• http://www.scrumalliance.org/
• http://agile2009.agilealliance.org
• http://www.toolsjournal.com/agile-articles
www.unicomlearning.com
Organized by
UNICOM Trainings & Seminars Pvt. Ltd.
contact@unicomlearning.com
Suchitra Vasudevan
Suchitra.vasudevan@atos.net
Samir Umrikar
Samir.umrikar@atos.net

Agile Metrics Boom or Bane

  • 1.
    www.unicomlearning.com India Agile Week-2014 13-June-2014,Mumbai Agile Metrics: Boon or Bane? Suchitra Vasudevan General Manger Atos India Pvt. Ltd. www.agileinbusiness.com Samir Umrikar Associate Manager
  • 2.
  • 3.
    www.unicomlearning.com Agile Metrics -Agenda UNICOM Presents India Agile Week-2014 To Measure or Not to Measure? Challenges faced Case study of project Industry best practices / recommendations Q& A
  • 4.
    www.unicomlearning.com Agile Metrics UNICOM Presents IndiaAgile Week-2014 Metric = “A measure or a combination of measures for quantitatively assessing, controlling or improving a process, a product, a team” Key Performance Indicator =“Quantifiable metrics which reflect the performance of an organization in achieving its goals and objectives” Diagnostic = “A metric used to diagnose and improve the processes that produce business value. What it measures might not have a direct value to the customer.”
  • 5.
    www.unicomlearning.com To Measure ORNot To Measure? UNICOM Presents India Agile Week-2014 Why - To Measure √Feedback & Decision-making For team performance Continuous improvement Motivate, Challenge What - To Measure √“Just enough” simple metrics √“Business Value” to customer / Measure-Up Outcomes Trends, Ratios How - To Measure √“Good-enough” quality Storypoints, DoD, Burndown charts “Hard-to-game” metrics When - To Measure √Start / Stop √Frequency, regular (iteration/sprint) • Why - Not to Measure √ For individual performance √ Comparing projects against √ Controlling teams • What - Not to Measure √ Outputs (efforts, variance from plan..) √ Numbers (rather than trends) √ Difficult/time-consuming • How- Not to Measure √ Organization level rather than project-level √ Not set targets (use minimal)
  • 6.
    www.unicomlearning.com Journey to Agile UNICOMPresents India Agile Week-2014 Client was completely following waterfall / iterative model till 2011 Agile / Scrum methodology started implementing in project in early 2012 – closely linked to agile Global Delivery Platform with customization specific to client Deliver highest business value with real working software to customer in the shortest time. Status: 80% Java projects around 25 projects, 170 team members following Agile
  • 7.
    www.unicomlearning.com Challenges faced /Solutions applied – 1/2 UNICOM Presents India Agile Week-2014 ▶ Team new to Agile – Scrum Training for teams, 35 Certified Scrum Masters (CSM) & 2 PO – Agile Club – Monthly meeting to share best practices (client, local) – Agile Day – KXC for team with innovation games and lessons learned Distributed delivery and roles spread across locations – Scrum Masters in each location working with local scrum teams Sometimes appointed 2 Scrum masters for a sprint – Backup of key roles PO and SM present at offshore – For large teams - daily Scrum meeting at each location using Lync (taking time-zone constraints), “Scrum of scrum” meeting between Scrum Masters across locations ▶ Common estimation model, standard definition of story points – Complexity guideline template with guidelines at project-level to define story points – No standard estimation model defined
  • 8.
    www.unicomlearning.com Improvements : LessonsLearned from Agile UNICOM Presents India Agile Week-2014 Good practices / Learnings Experience & Knowledge Customer Brainstorming QualityEmployees • Agile Club – extended with local experts • Deputy of client Key roles (PO, SM) in local • Mandatory Demo with PO in sprint • Agile Day - KXC, Quiz • Lessons Learned in Retrospective meetings • Customization of Agile based on client context ⇒Pair-programming of new and experienced members ⇒Roles matched across distributed teams • Scrum training, certification (35 Certified Scrum Masters, 2 Product Owner) • Daily scrum meetings with teams and “Scrum of Scrum” weekly across locations • Definition of “Done” standardized • Continuous Integration (SONAR dashboard, automated testing) • Usage of Jira dashboard
  • 9.
    www.unicomlearning.com Case Study Project- Overview UNICOM Presents India Agile Week-2014 ▶ Tools used to mange SCRUM / Agile Practices : JIRA + Green Hopper Plug-in ▶ Scrum Team Size: 6 to 8 ▶ Product Owner Role is performed by someone from client team. However there are 2 product owners now in local team. ▶ Scrum Master Role is performed by local / client ▶ Sprint Size: 2 to 4 weeks ▶ Product Owner makes Release and Sprint backlog in JIRA. ▶ Before starting a sprint, local team provides the capacity to client team considering public / personal holidays of local team members working on the sprint. ▶ Local team receive requirements for a given sprint (ppt, doc). client team also creates stories for each sprint in JIRA.
  • 10.
    www.unicomlearning.com Case Study project-Agile Metrics Dashboard (1/3) UNICOM Presents India Agile Week-2014 Velocity Ratio :- Objective is to Keep track of the velocity w.r.t. Baseline Velocity and analyse improvement. Target >=0 Indicators • > 0 : Positive Velocity improvement trend • = 0 : Velocity as per baseline • < 0 : Velocity not as per expectations; further analysis and actions needed Story Completion Ratio:- Objective is to Measure the budget and timeliness of deliverables of sprint Target >= 70% Indicators • 100% -> Deliverables exceeding expectations • > 70% and < 100% -> Deliverables meeting expectations • < 70% -> Deliverables NOT meeting expectations, need analysis and actions
  • 11.
    www.unicomlearning.com Case Study project-Agile Metrics Dashboard (2/3) UNICOM Presents India Agile Week-2014 Story Acceptance Ratio:- Objective is to Measure Quality of deliverables of sprint Target >= 90% Indicators • 100% -> Deliverables exceeding expectations > 90% and < 100% -> Deliverables meeting expectations • < 90% -> Deliverables NOT meeting expectations, need analysis and actions Average Cost Per Story Point:- Objective is to Measure effort / Cost spent to complete a story point. Ideally it needs to decrease over Sprints. Target <= Agreed baseline Indicators • Reducing Trend is good indicator • In case of increasing trend then analysis and actions needed.
  • 12.
    www.unicomlearning.com Case Study project-Agile Metrics Dashboard (3/3) UNICOM Presents India Agile Week-2014 Quality completeness by SPRINT:- Objective is to Measure Quality of overall sprint. It is based on • Product Backlog Stories Written (INVEST Model- Independent, Negotiable, Valuable, Estimable & Testable) • Sprint Organised • Sprint Content Proposed • Sprint Planned • Sprint Prepared • Sprint Executed • Sprint Reviewed • Sprint Retrospective Completed Phase wise Dashboard is also used to analyze Quality with in and across SPRINT. It is Quality check questionnaire based on various phases of Sprint life cycle.
  • 13.
    www.unicomlearning.com Case Study project- SONAR Dashboard UNICOM Presents India Agile Week-2014 Unit Test Success:- Objective is to Measure how many test cases are passed. It is run by J Units and it is delivered at the time of Sprint Review. Unit Test Coverage:- Objective is to Measure how much existing code is covered by the test cases. The objective is to cover 50% of legacy code in next one year. Rule Compliance :- As client has its own technology and platform. There are specific coding rules that had been defined and continuously updated by client and the developed code by local teams is expected too follow at least 95% of the rules.
  • 14.
    www.unicomlearning.com Industry best practices/ recommendations UNICOM Presents India Agile Week-2014 Here is a quick list that you may consider using: • Velocity Ratio, Acceleration Ratio • Resource Utilization, Burndown charts • Average Cost • Adherence to doneness/acceptance criteria, checklists (checklist item burnup), standards (PCI Standards) • Test coverage (Code Coverage, Branch Coverage), Running tested features • Rule Compliance (wrt. Customer standards), Team member peer reviews Category Metric Quality Defect Count, Technical Debt, Faults-Slip-Through Predictability Velocity, Running Automated Tests Value Customer Satisfaction Survey, Business Value Delivered (ROI, EV analysis) Lean Lead Time, Work In Progress, Queues Cost Average Cost Per Functions
  • 15.
  • 16.
    www.unicomlearning.com Agile Metrics -Agenda UNICOM Presents India Agile Week-2014 List of references • http://www.slideshare.net • http://www.scrumalliance.org/ • http://agile2009.agilealliance.org • http://www.toolsjournal.com/agile-articles
  • 17.
    www.unicomlearning.com Organized by UNICOM Trainings& Seminars Pvt. Ltd. contact@unicomlearning.com Suchitra Vasudevan Suchitra.vasudevan@atos.net Samir Umrikar Samir.umrikar@atos.net