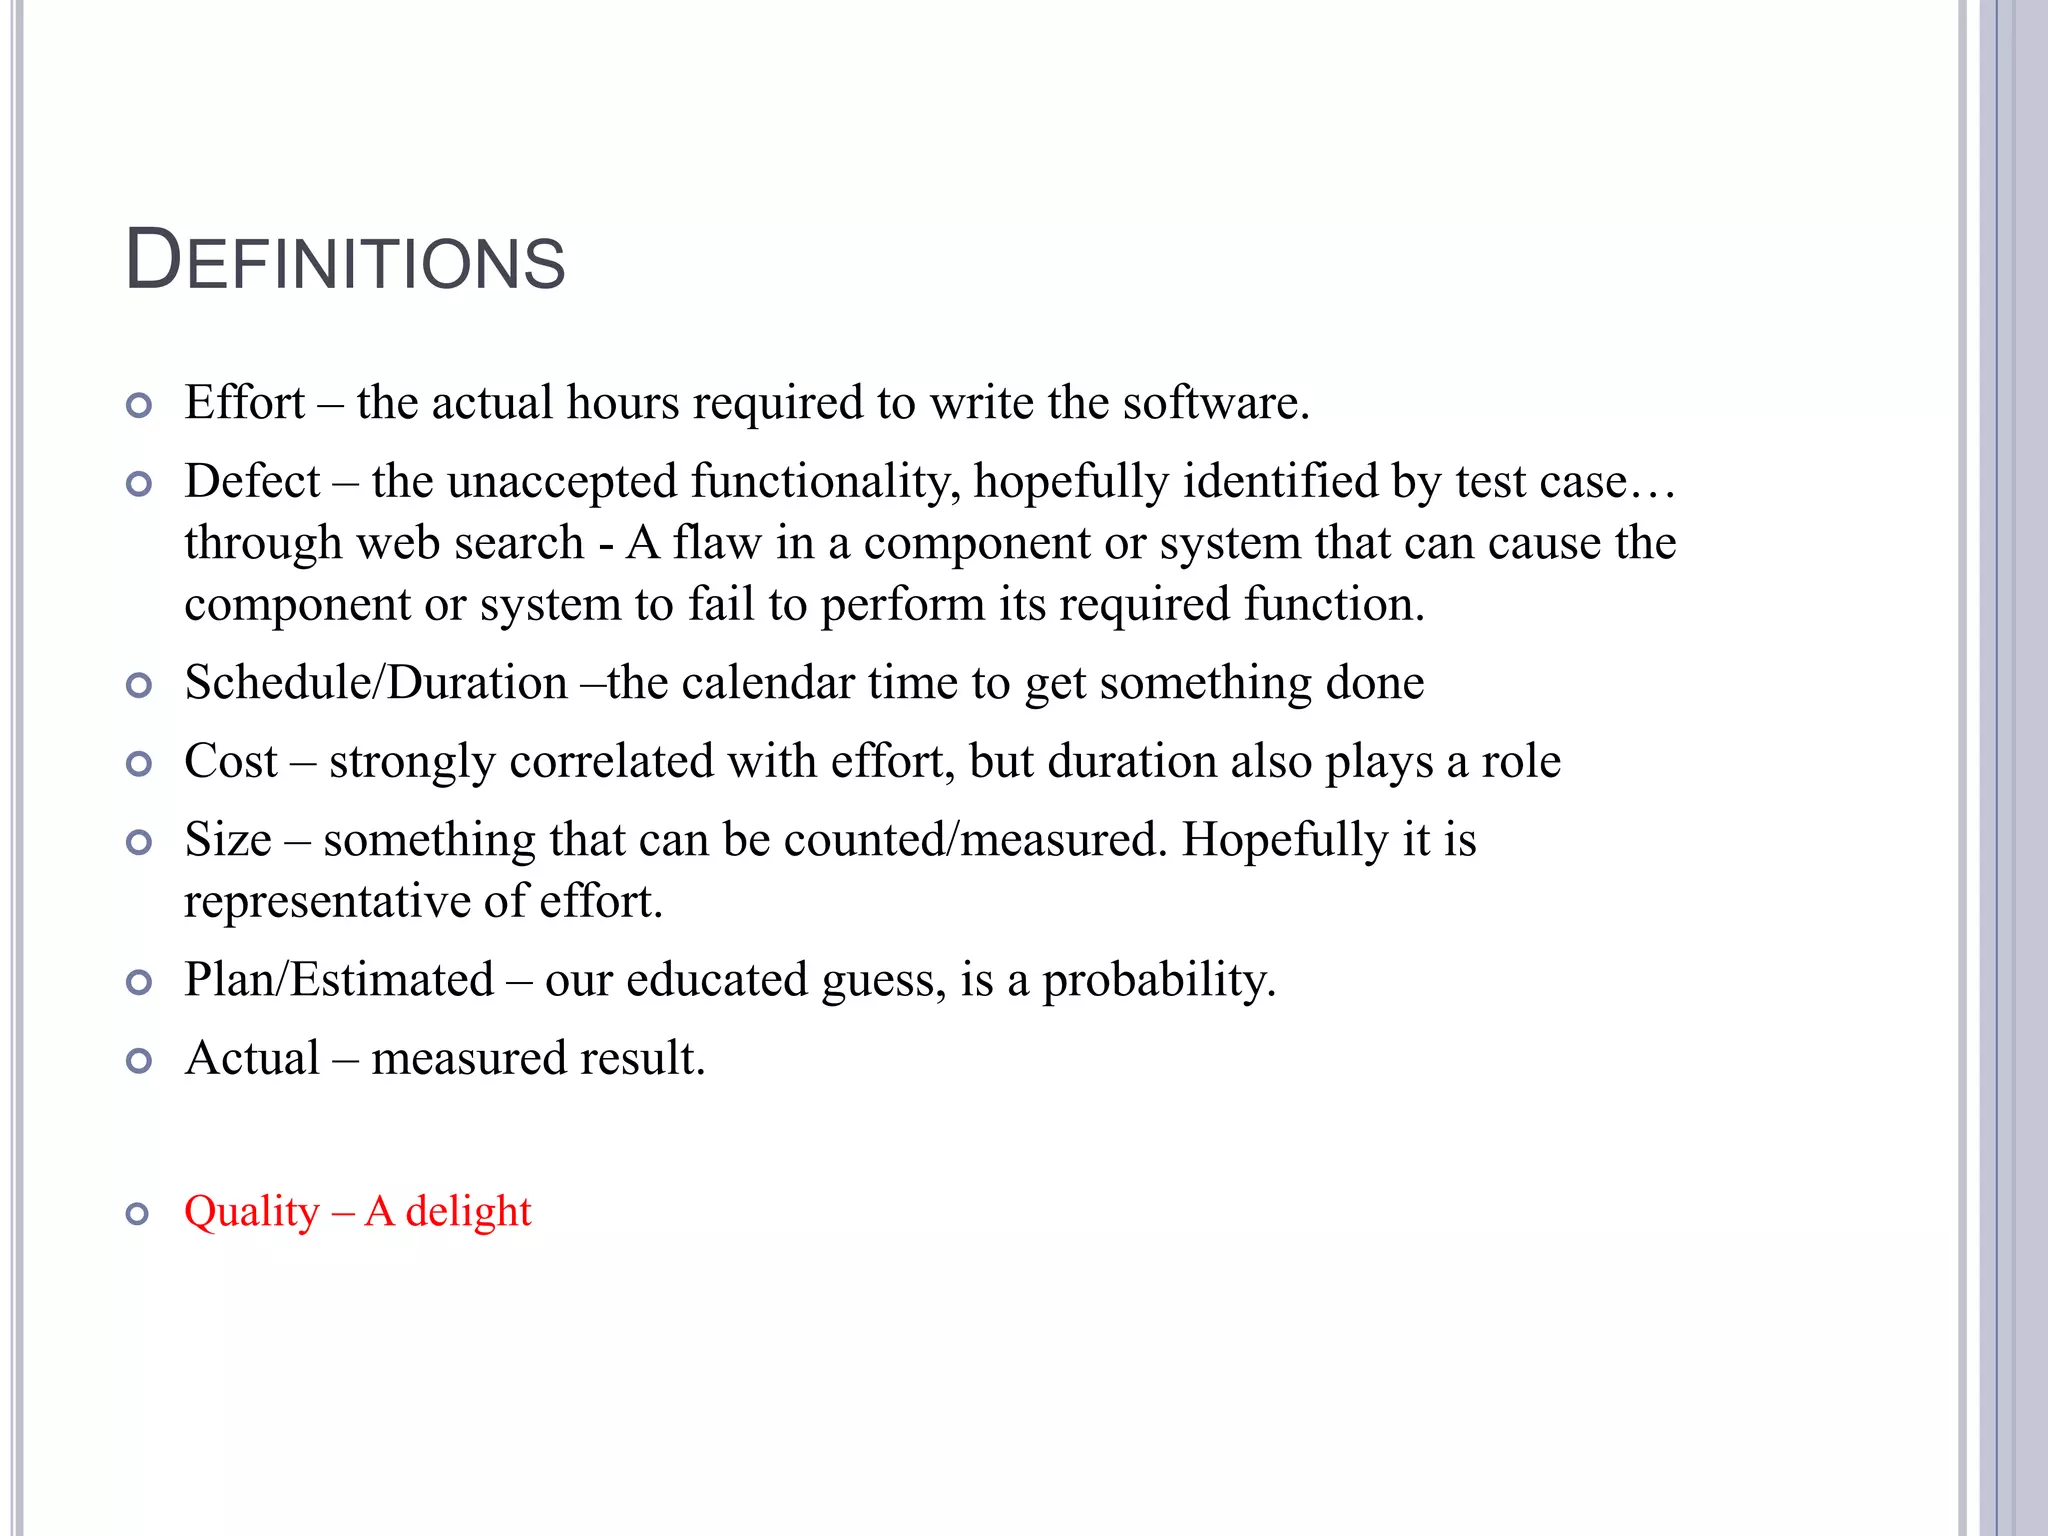
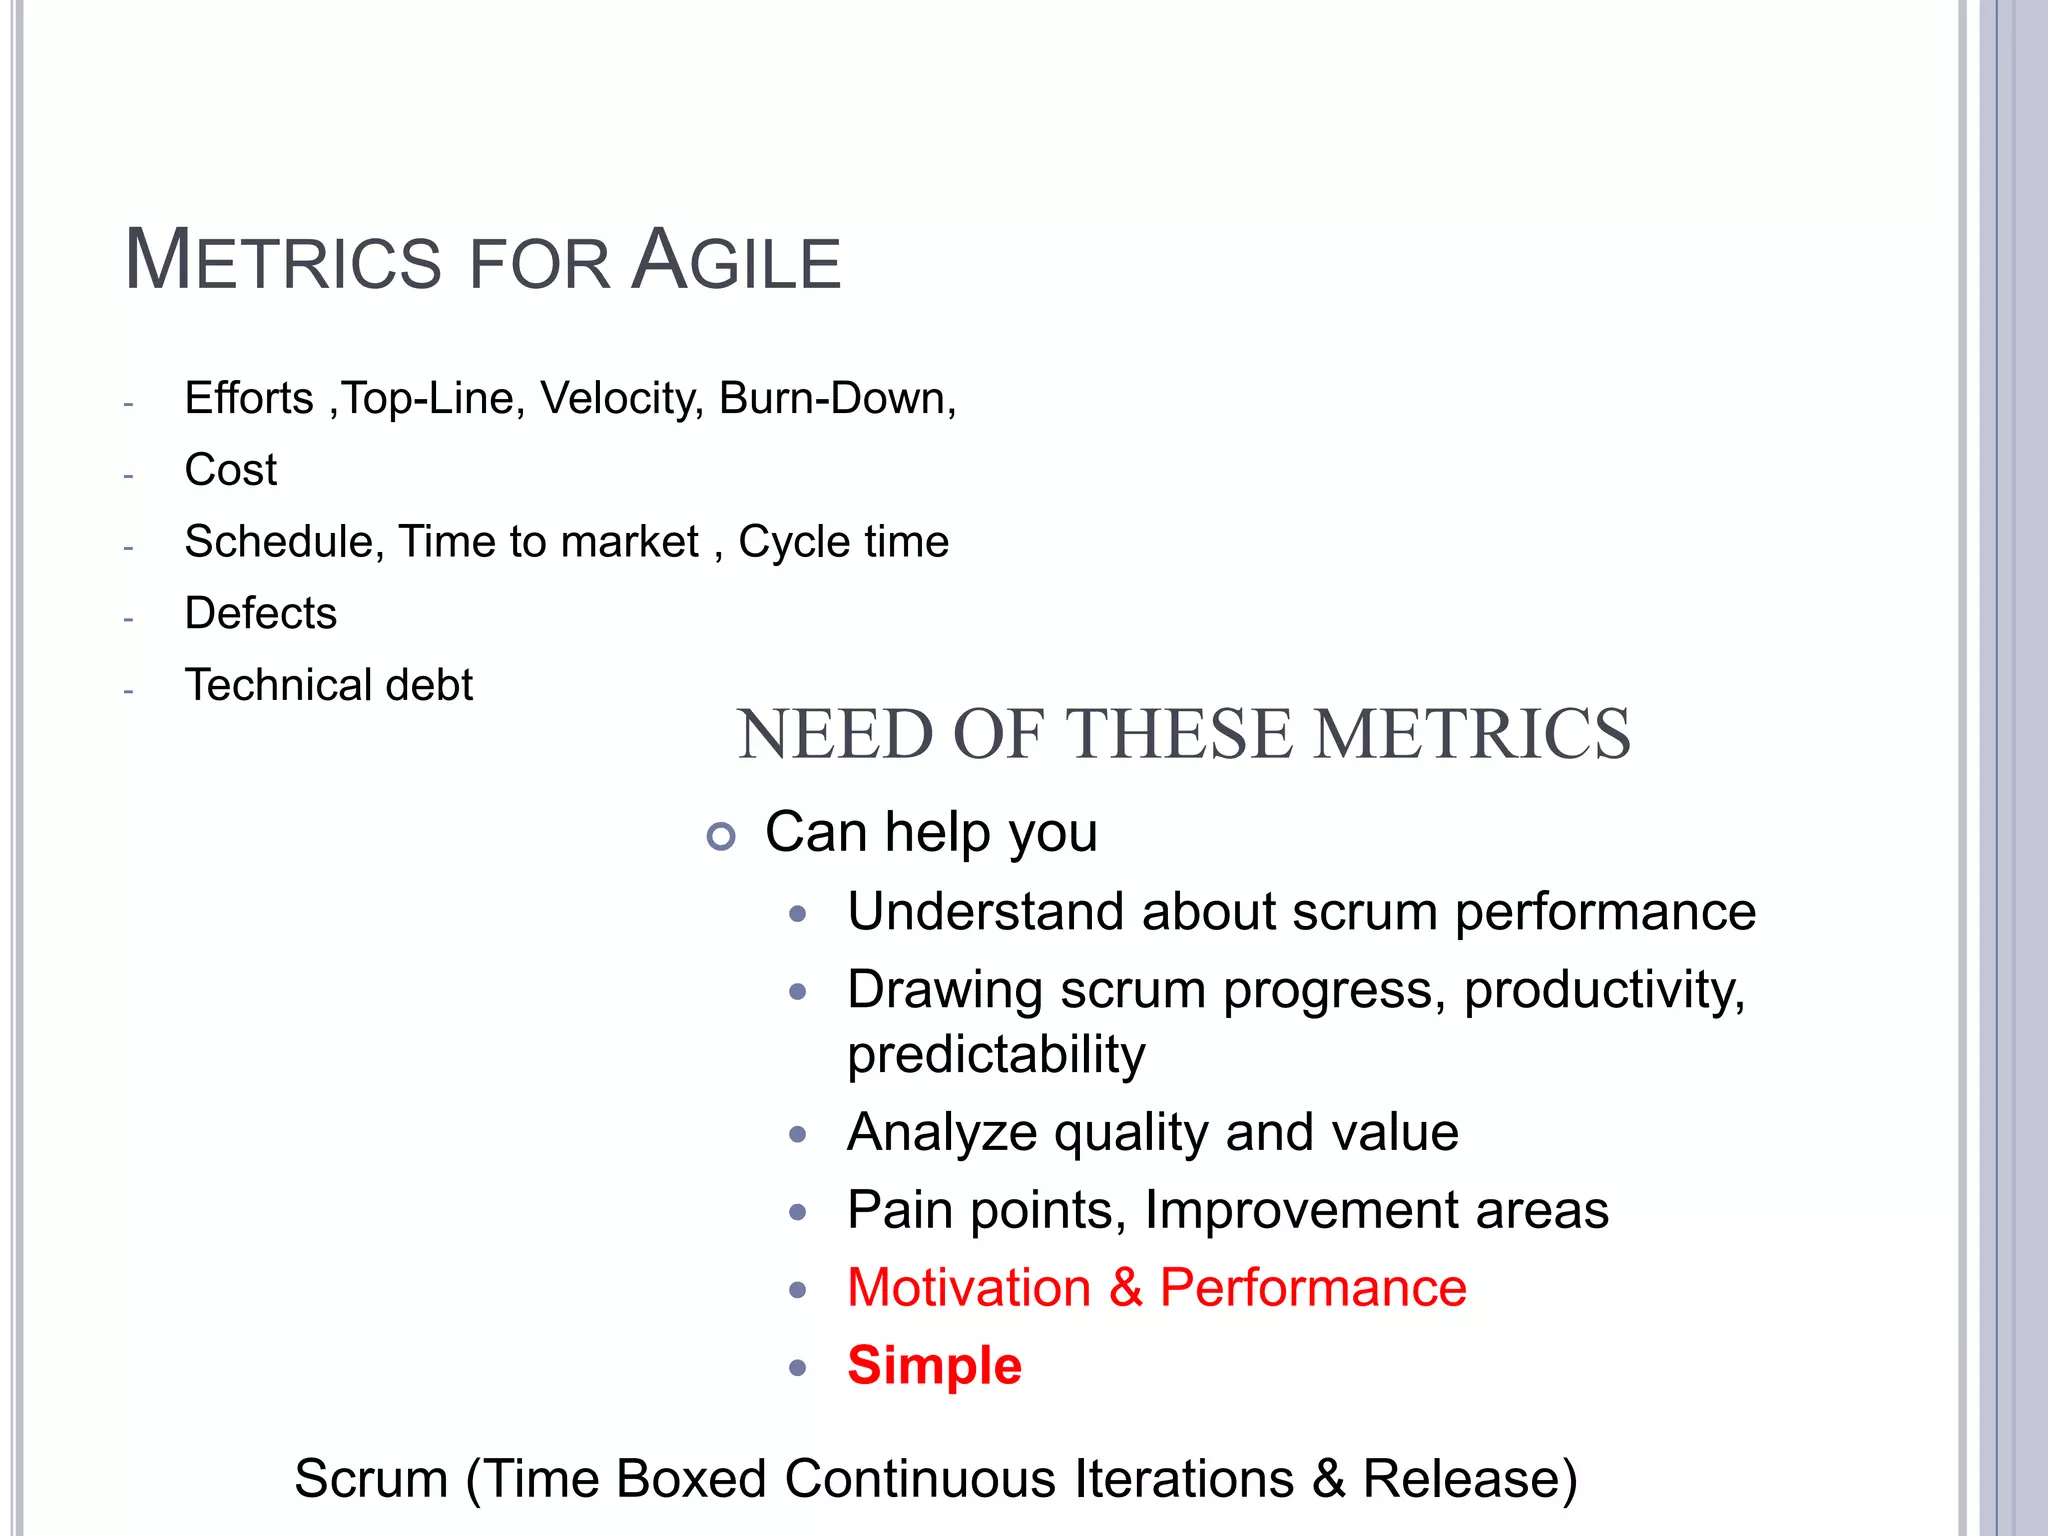
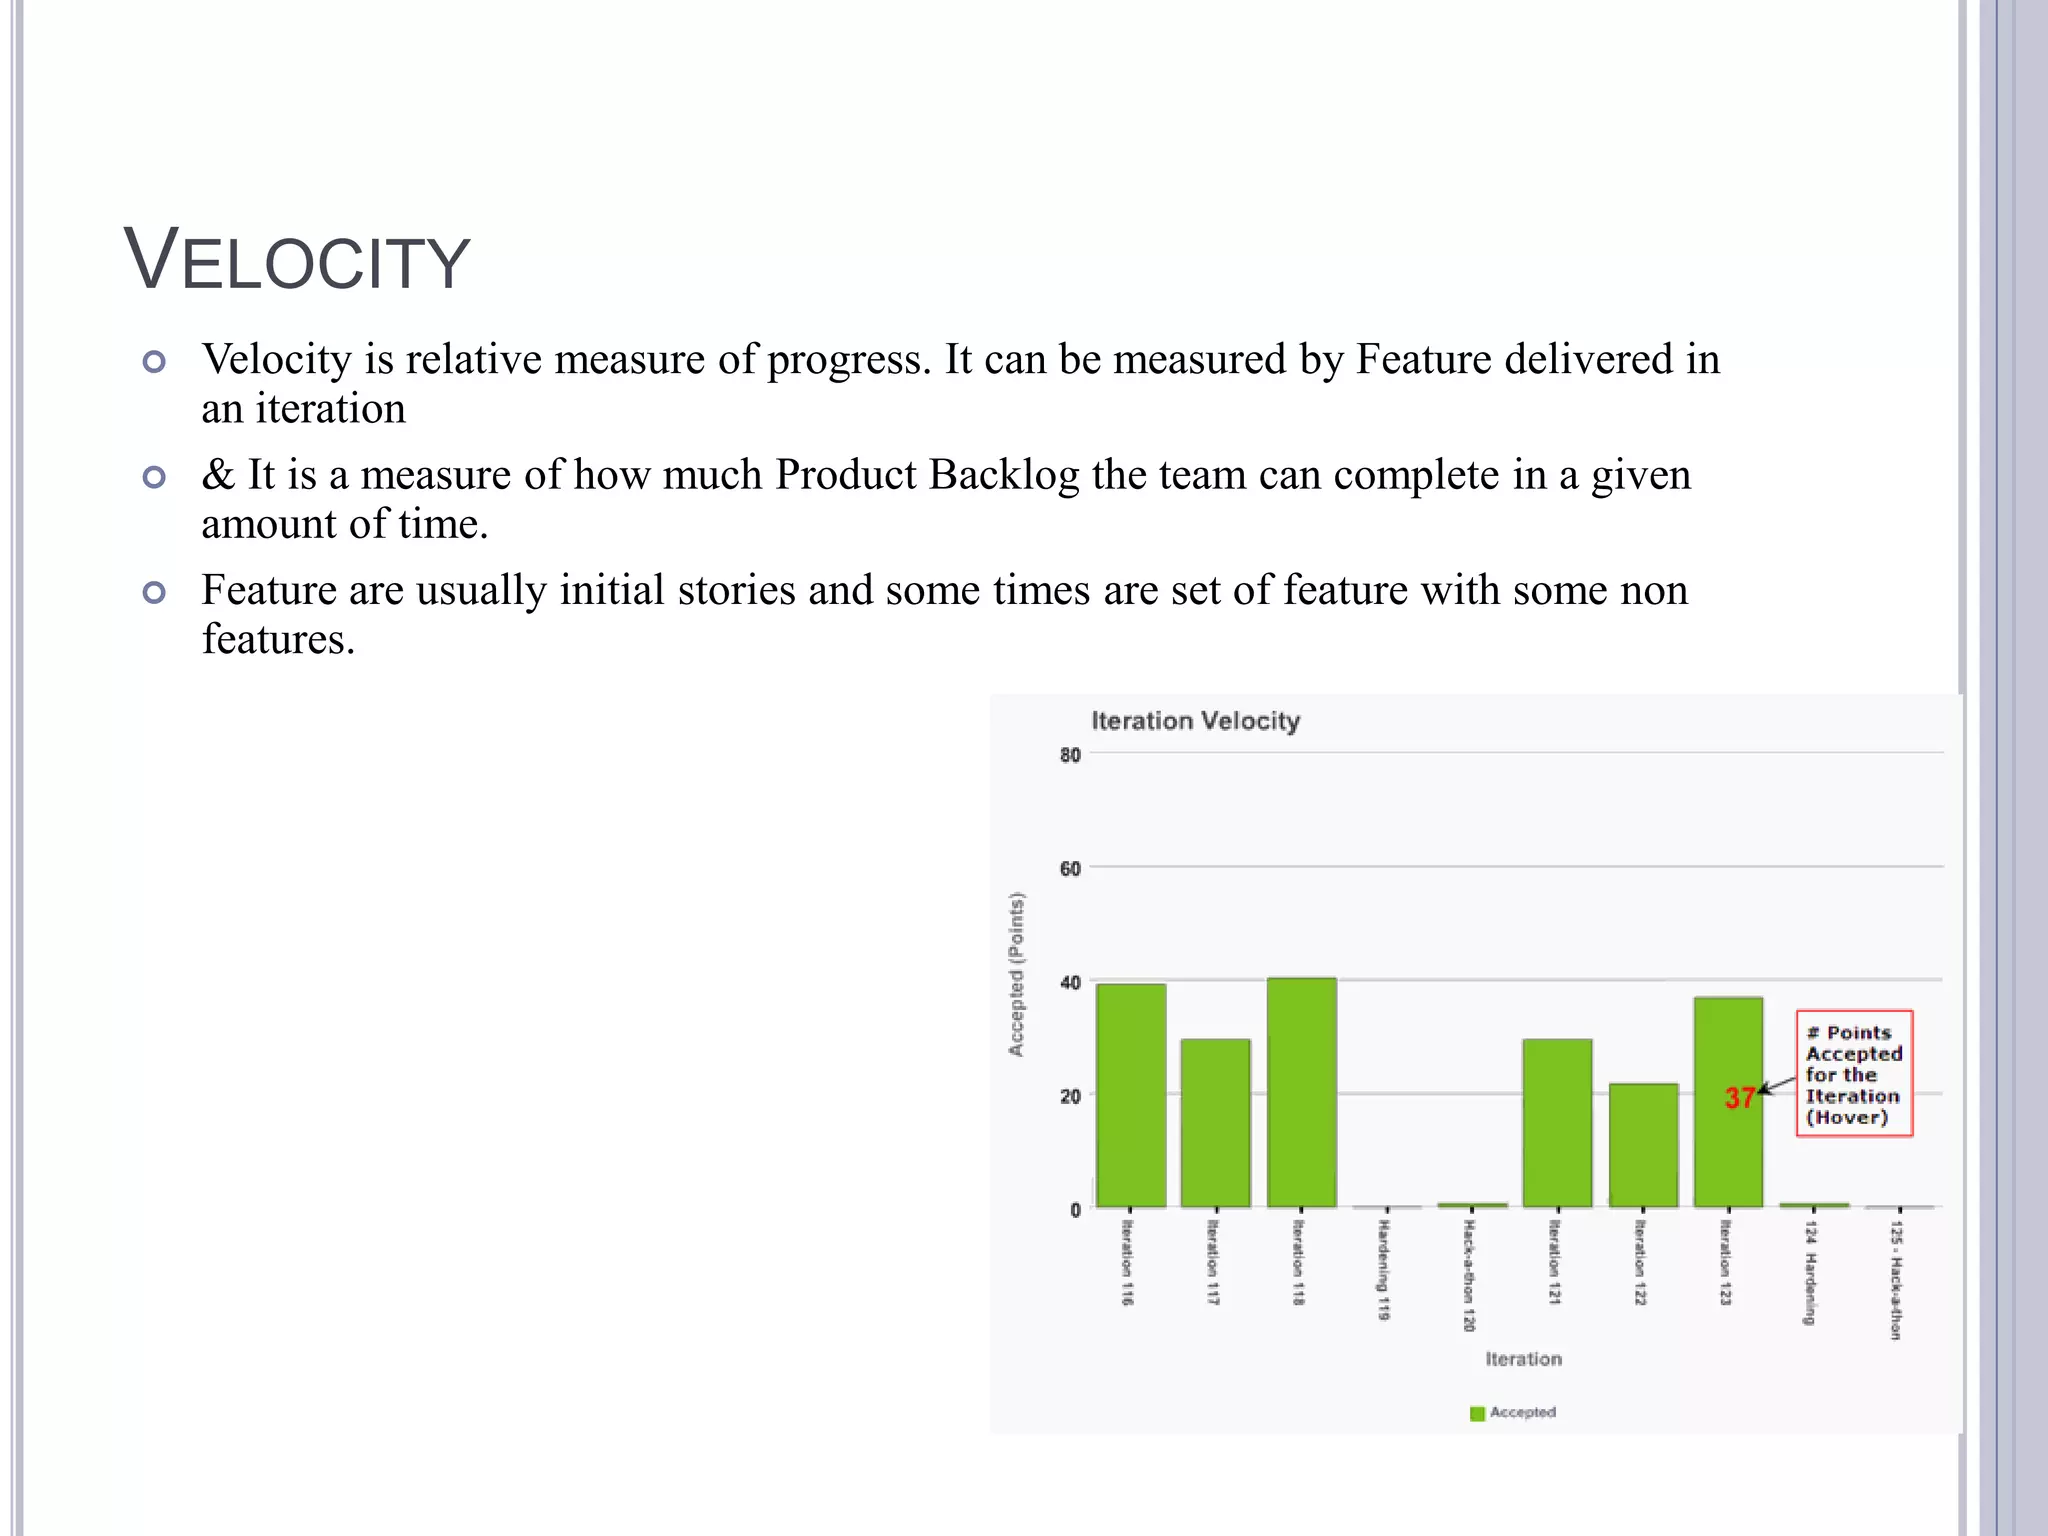
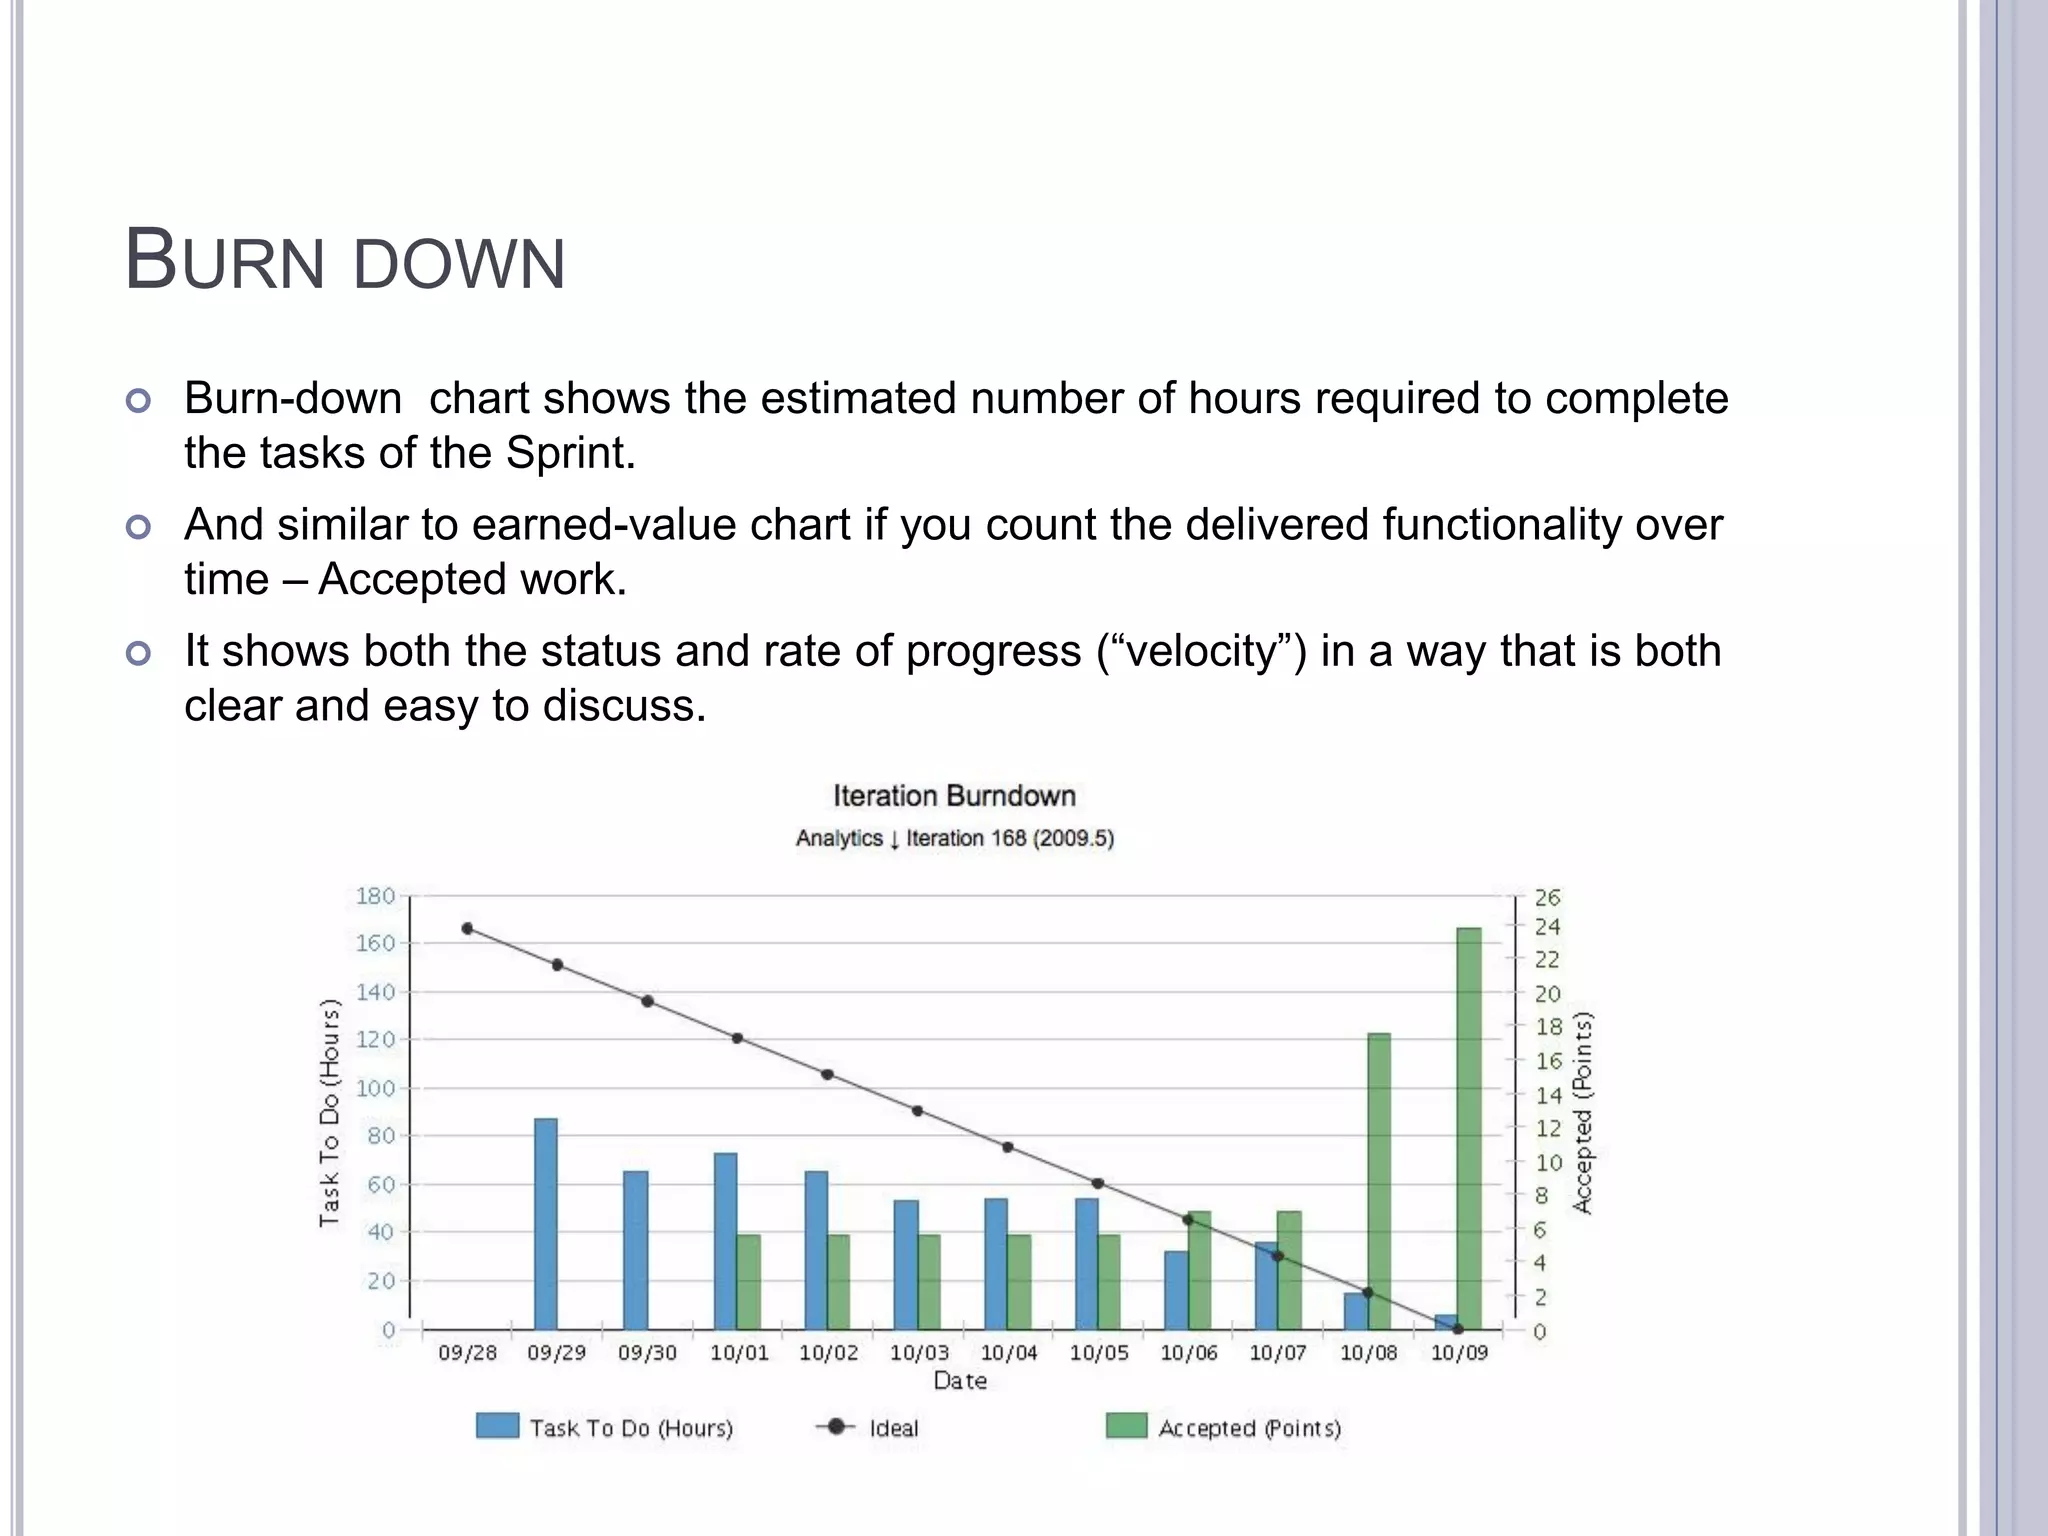
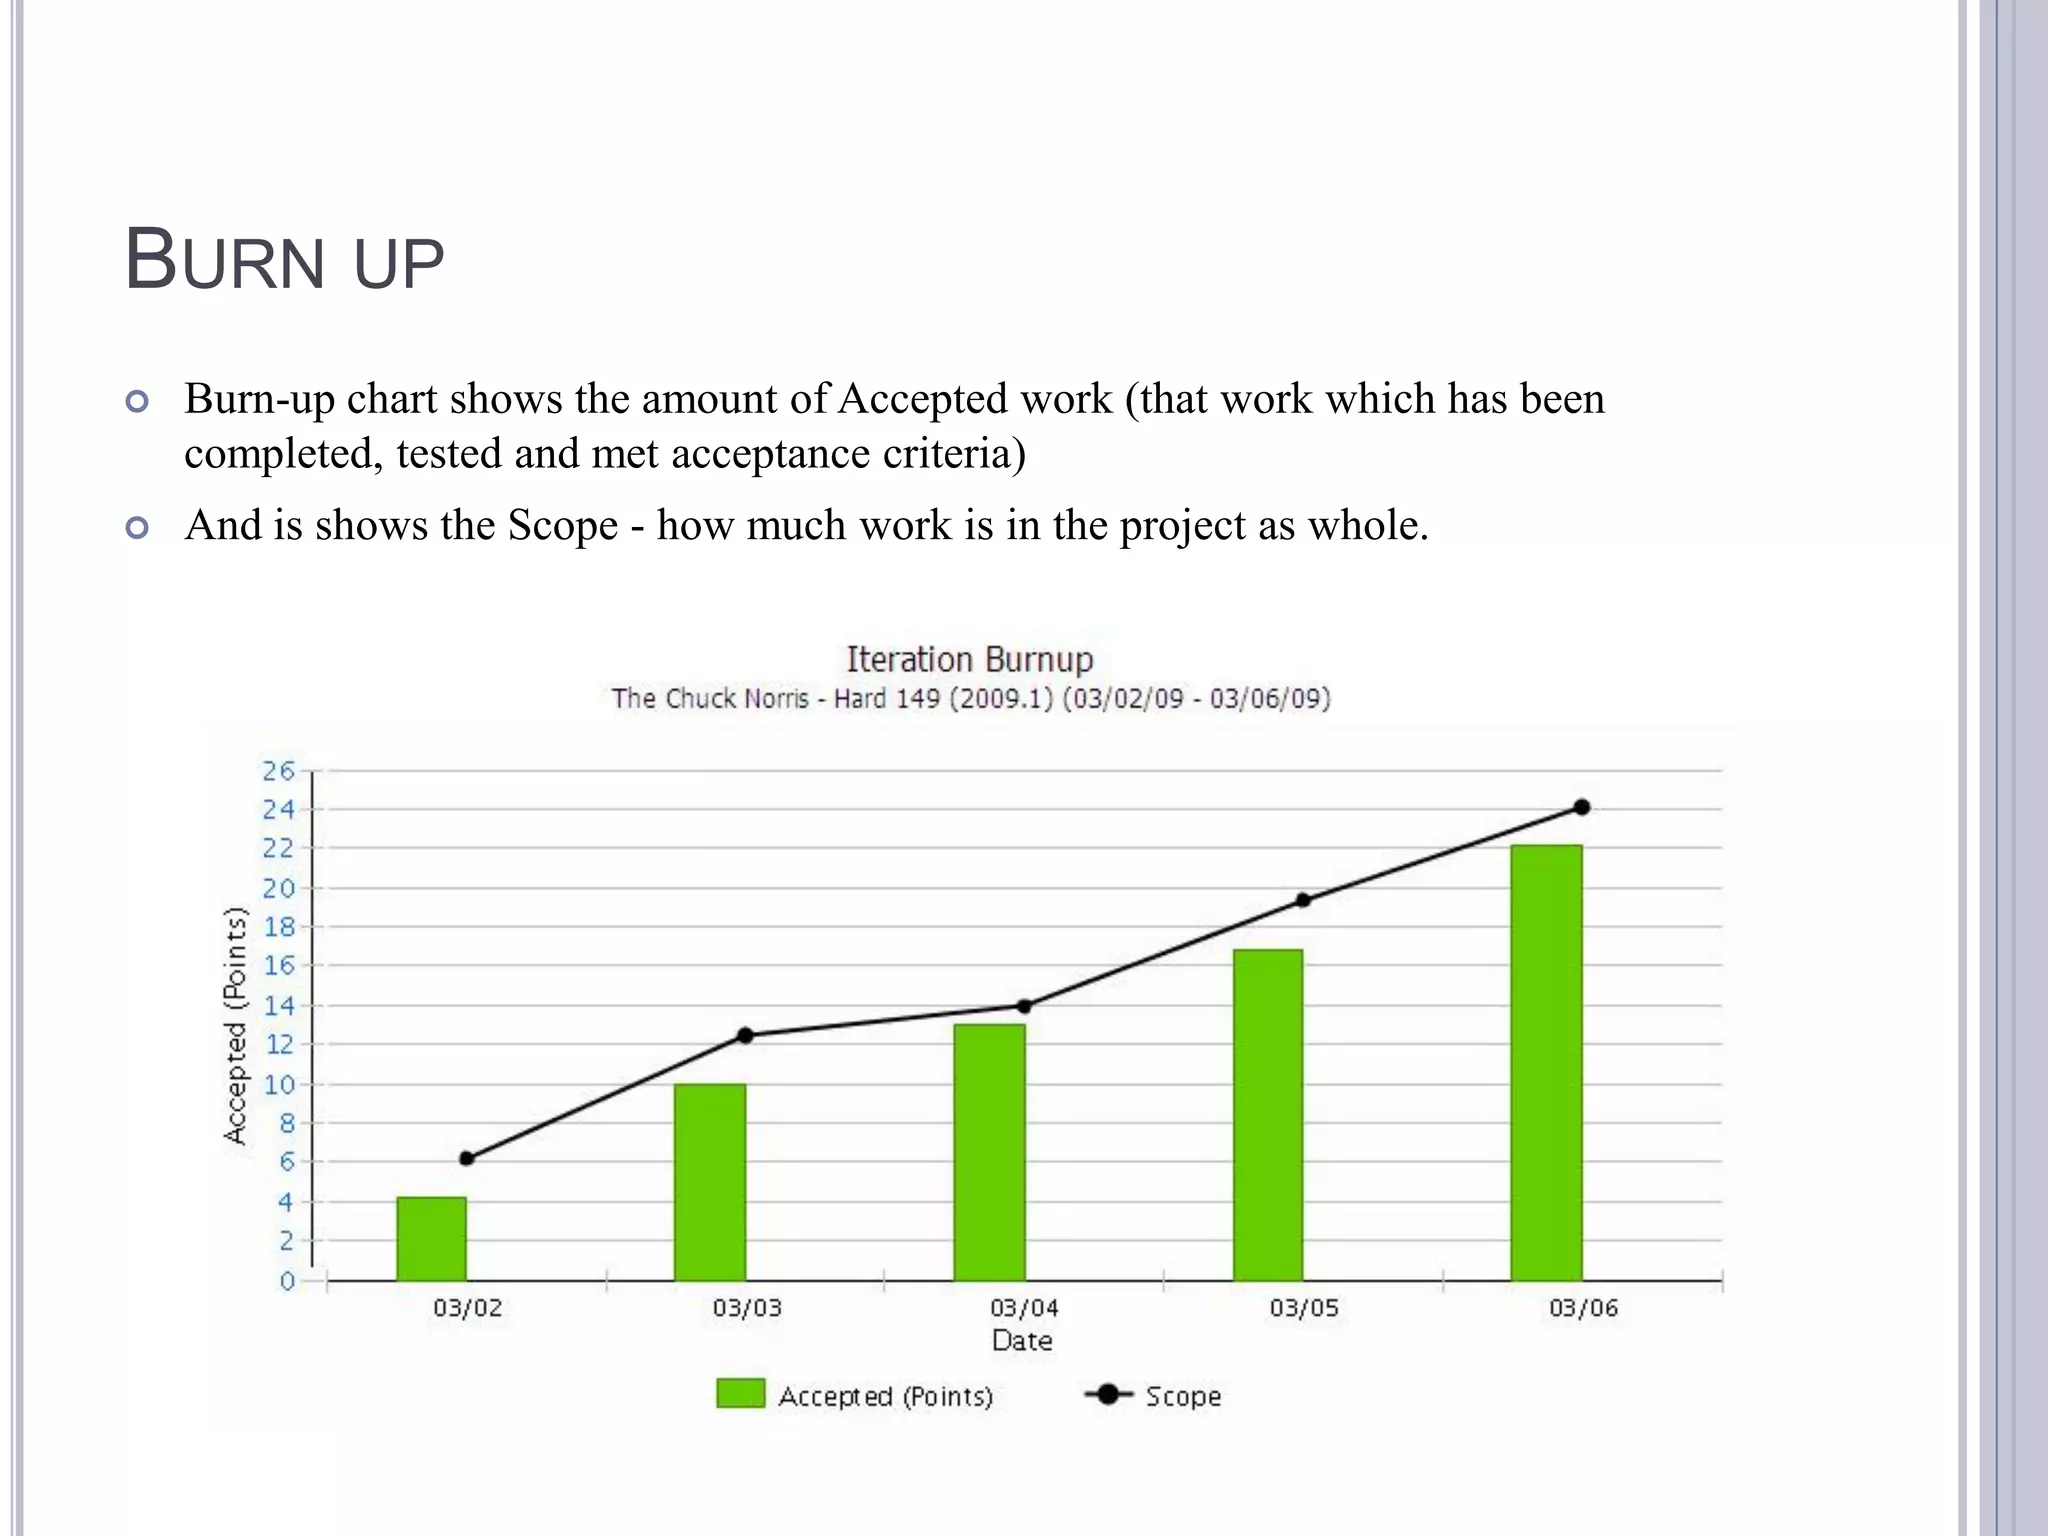
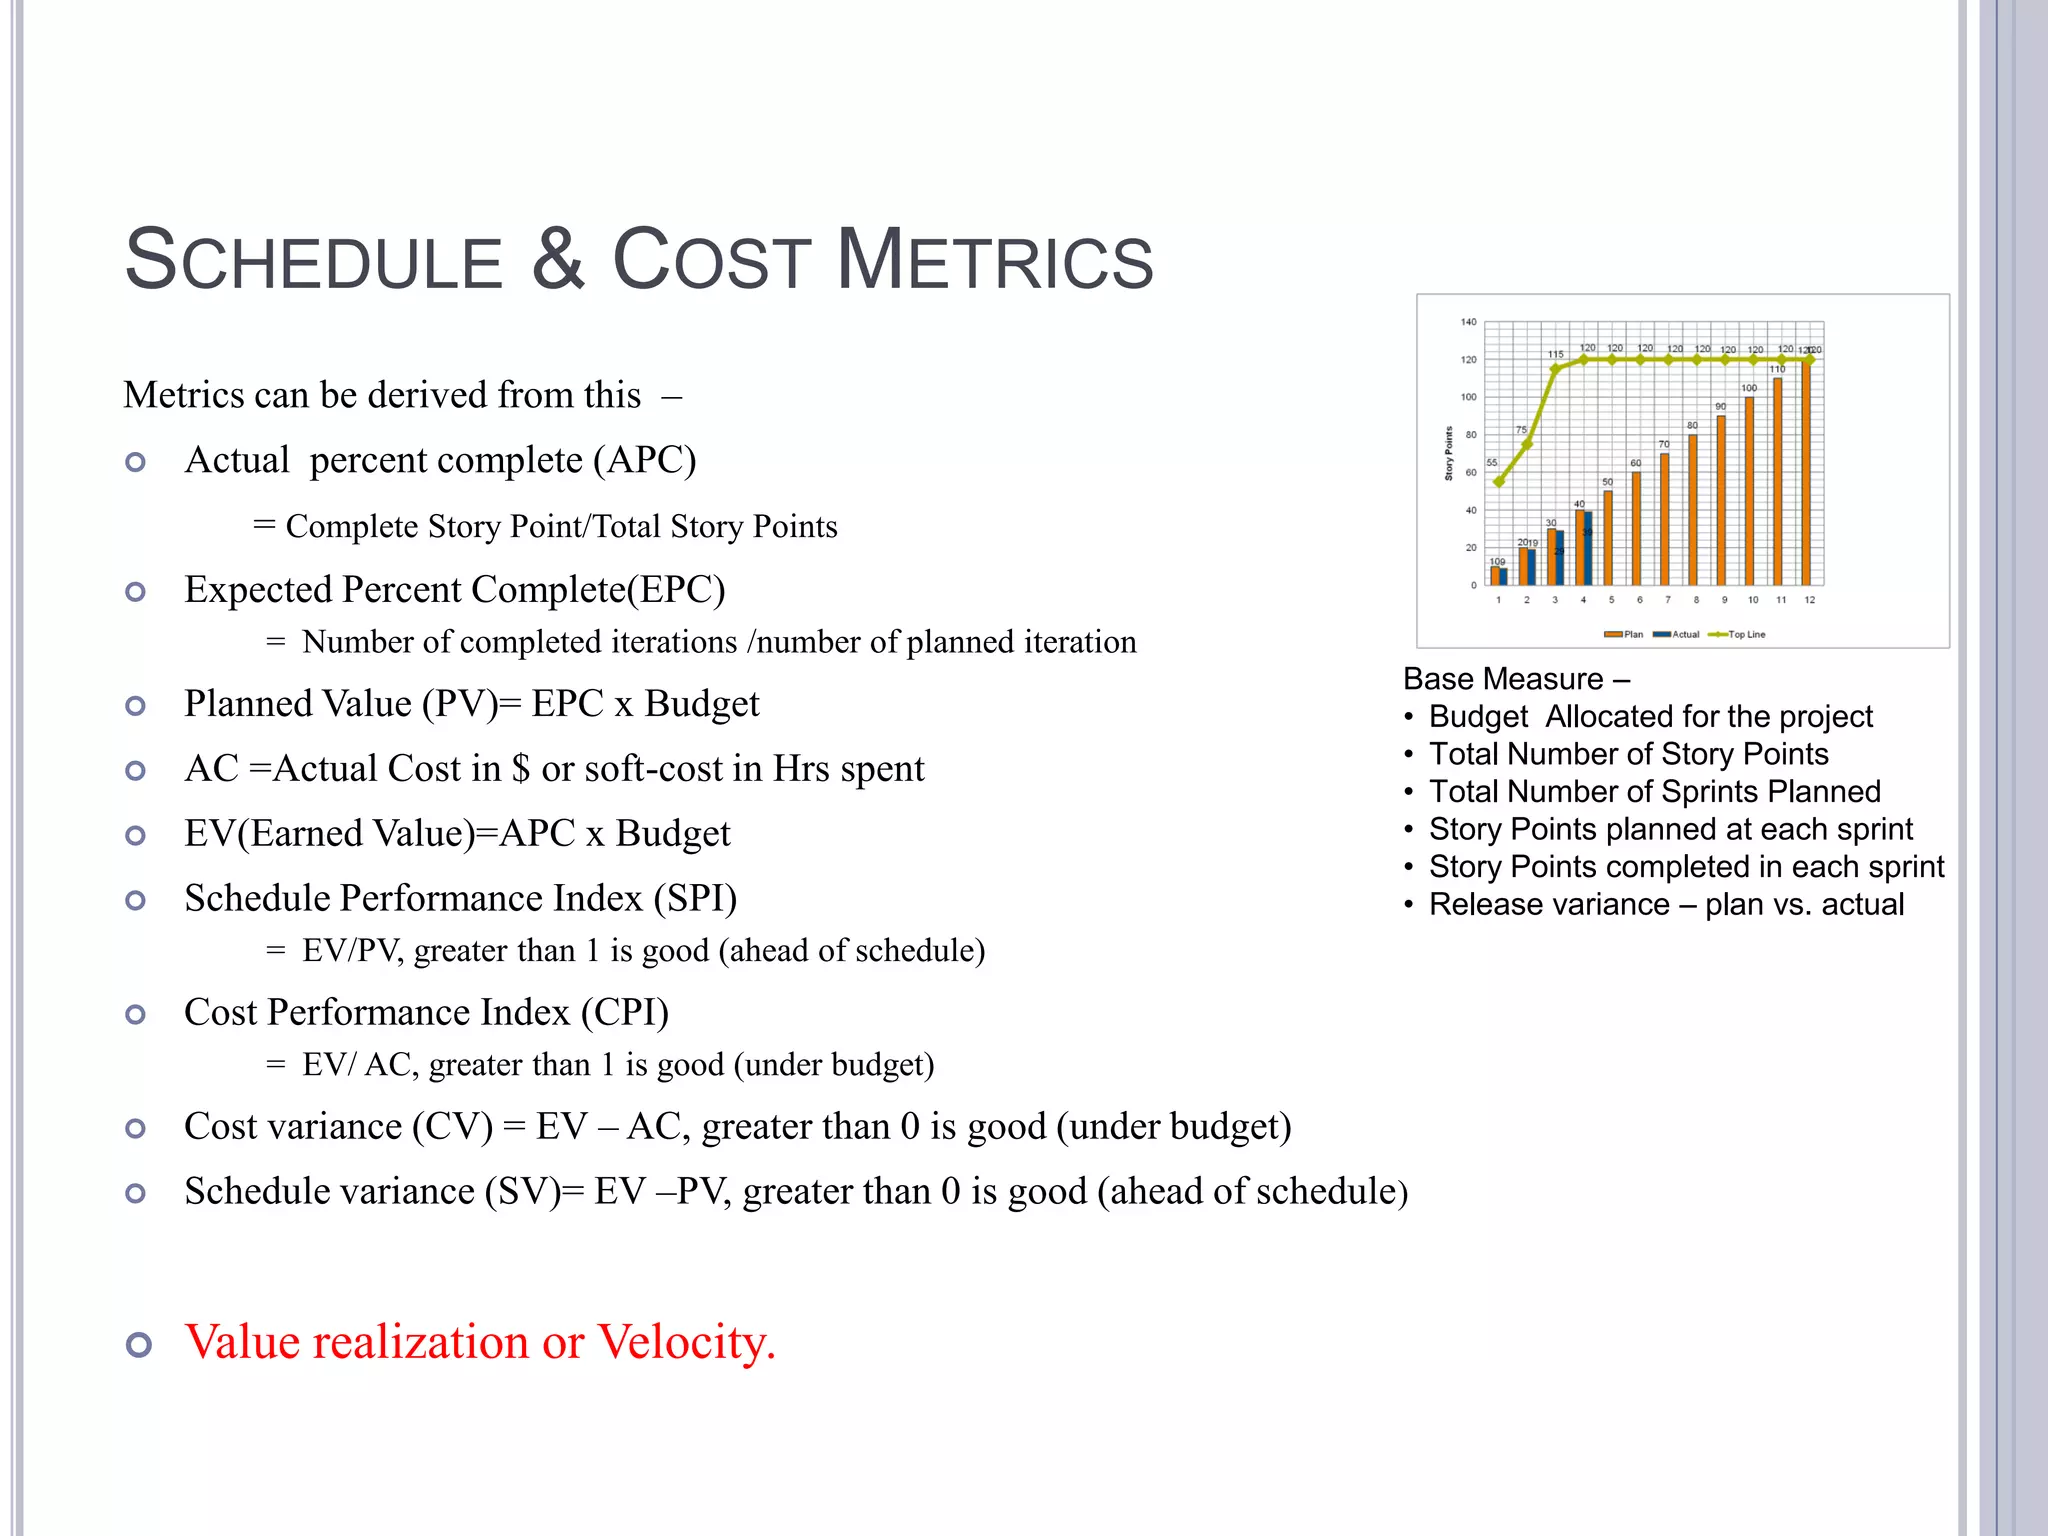
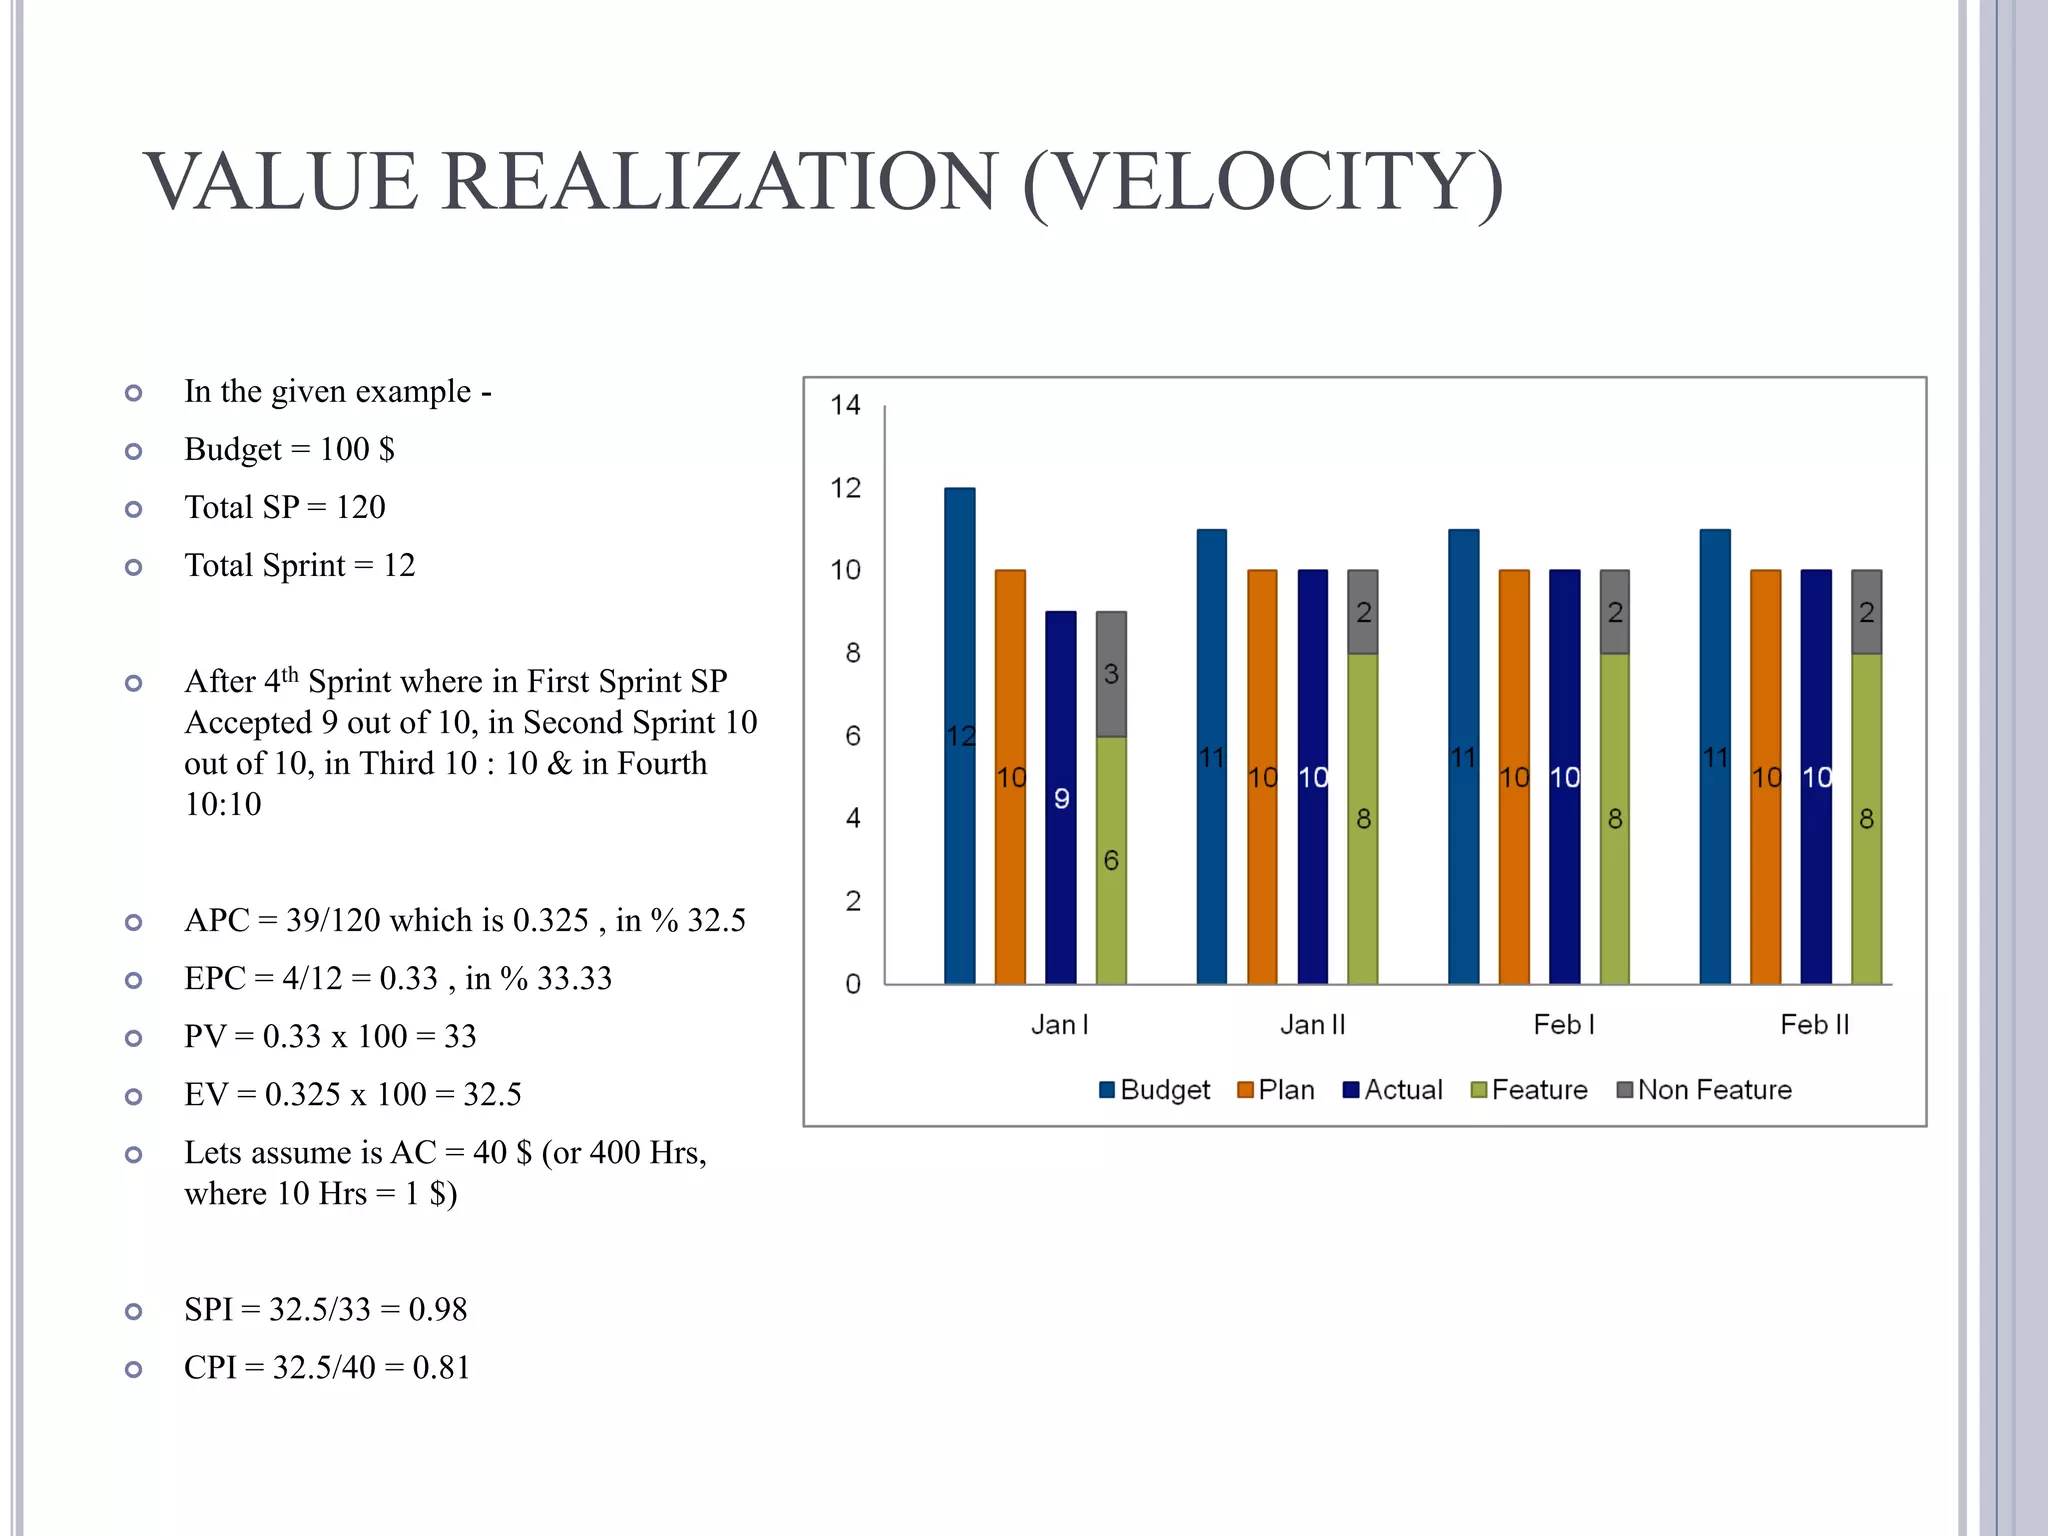
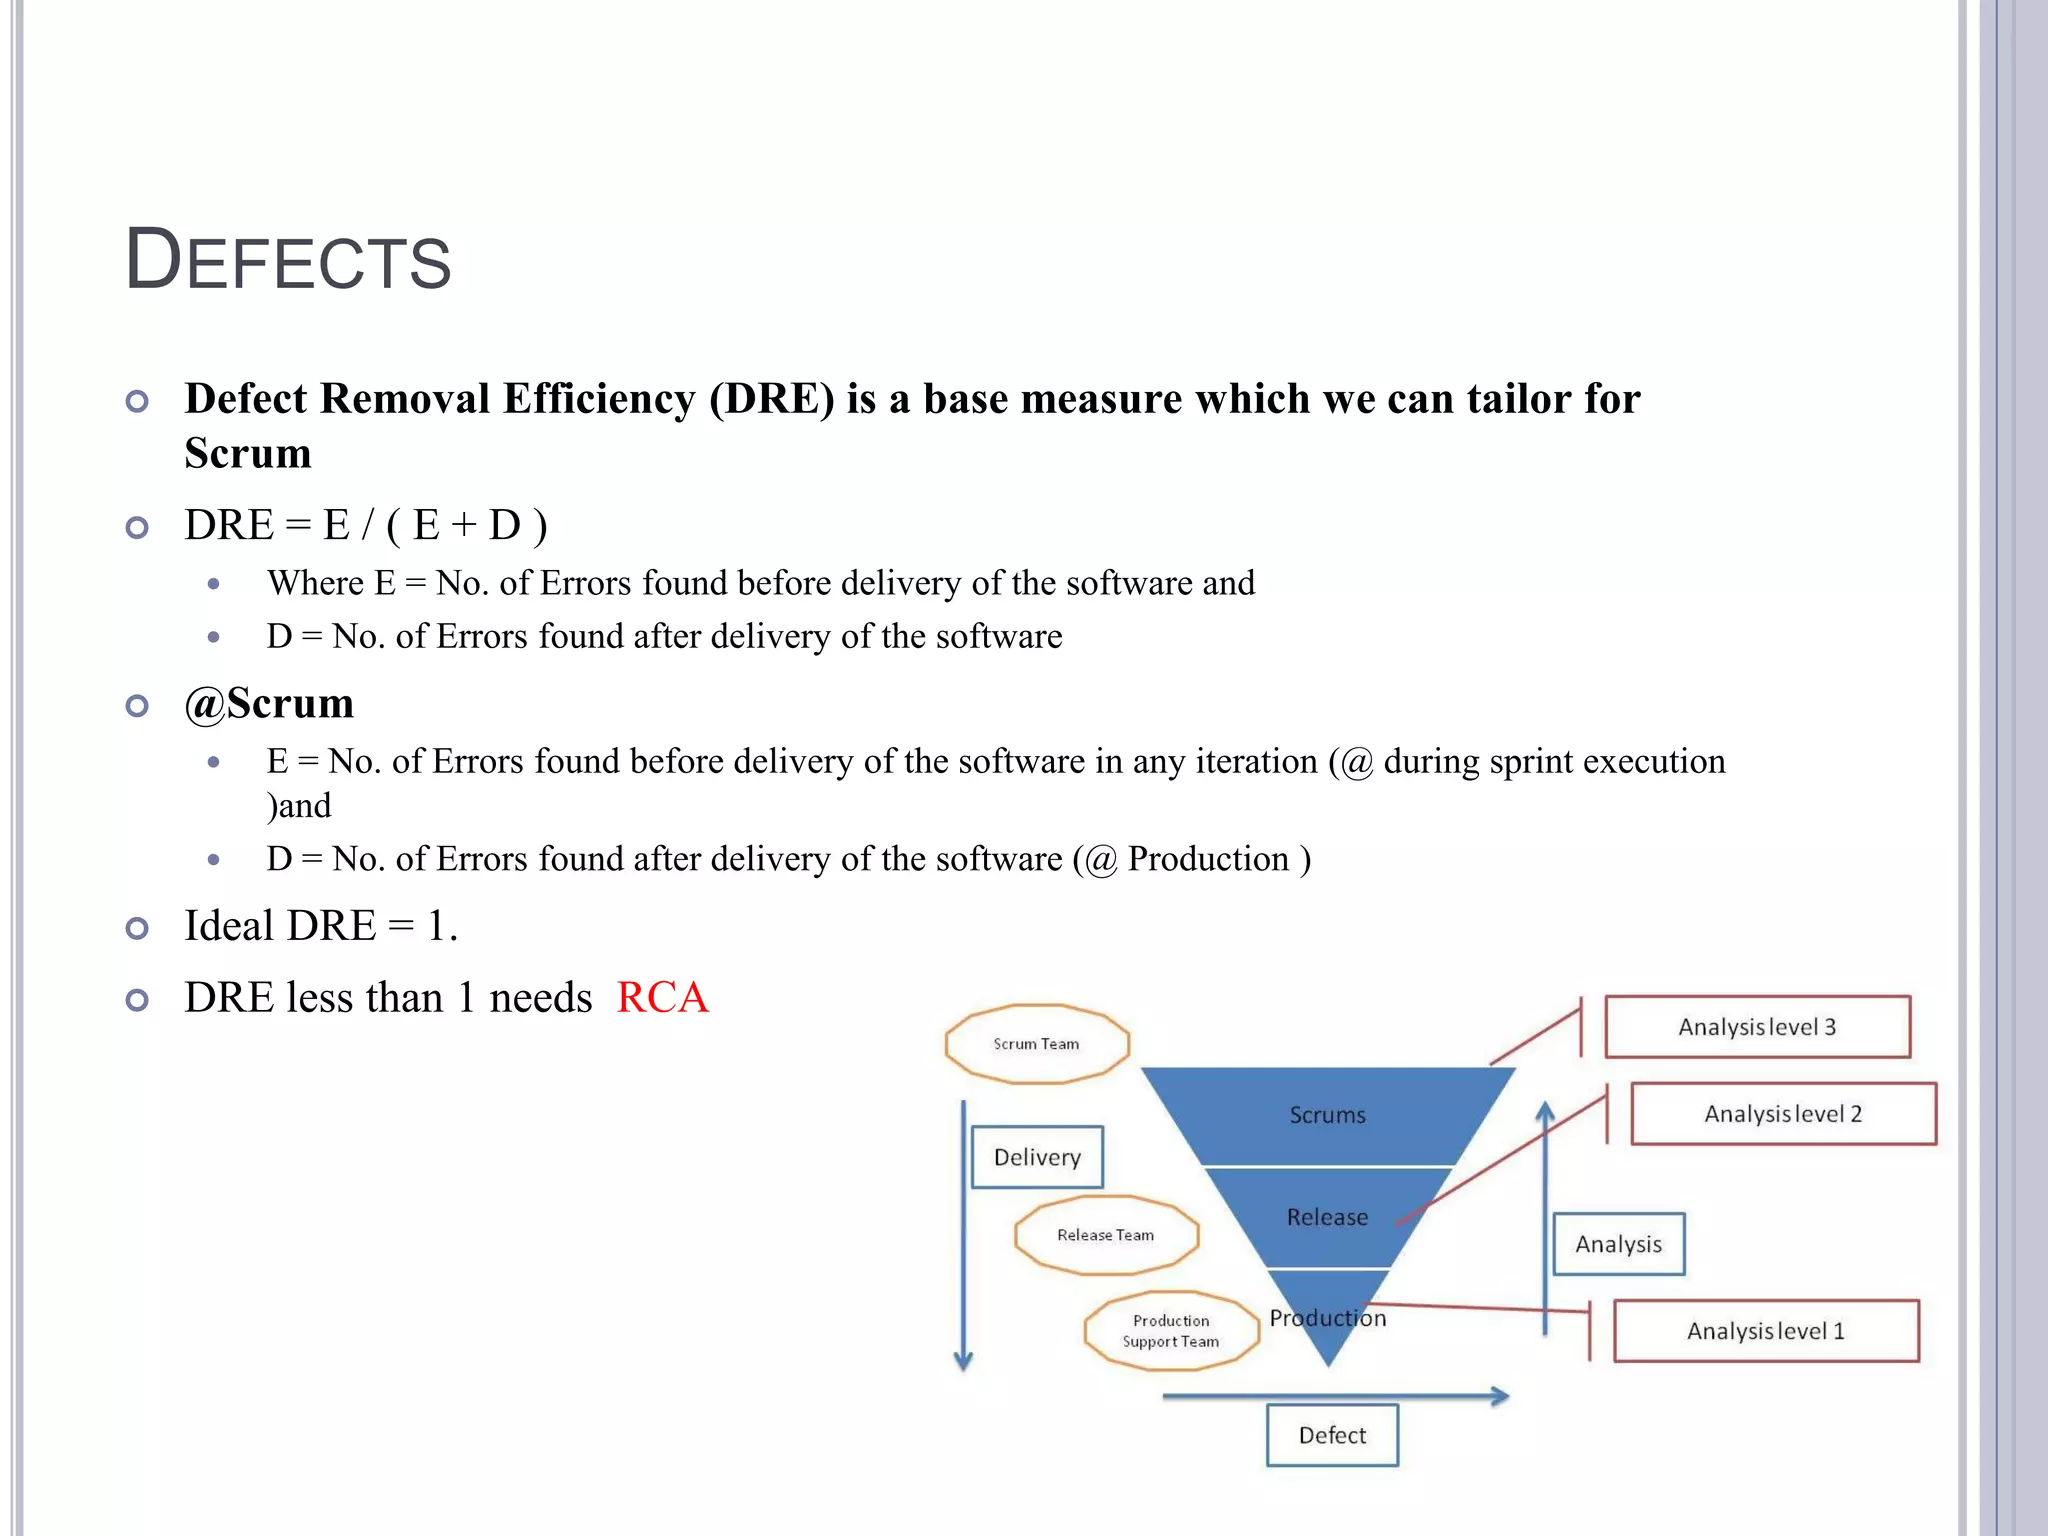
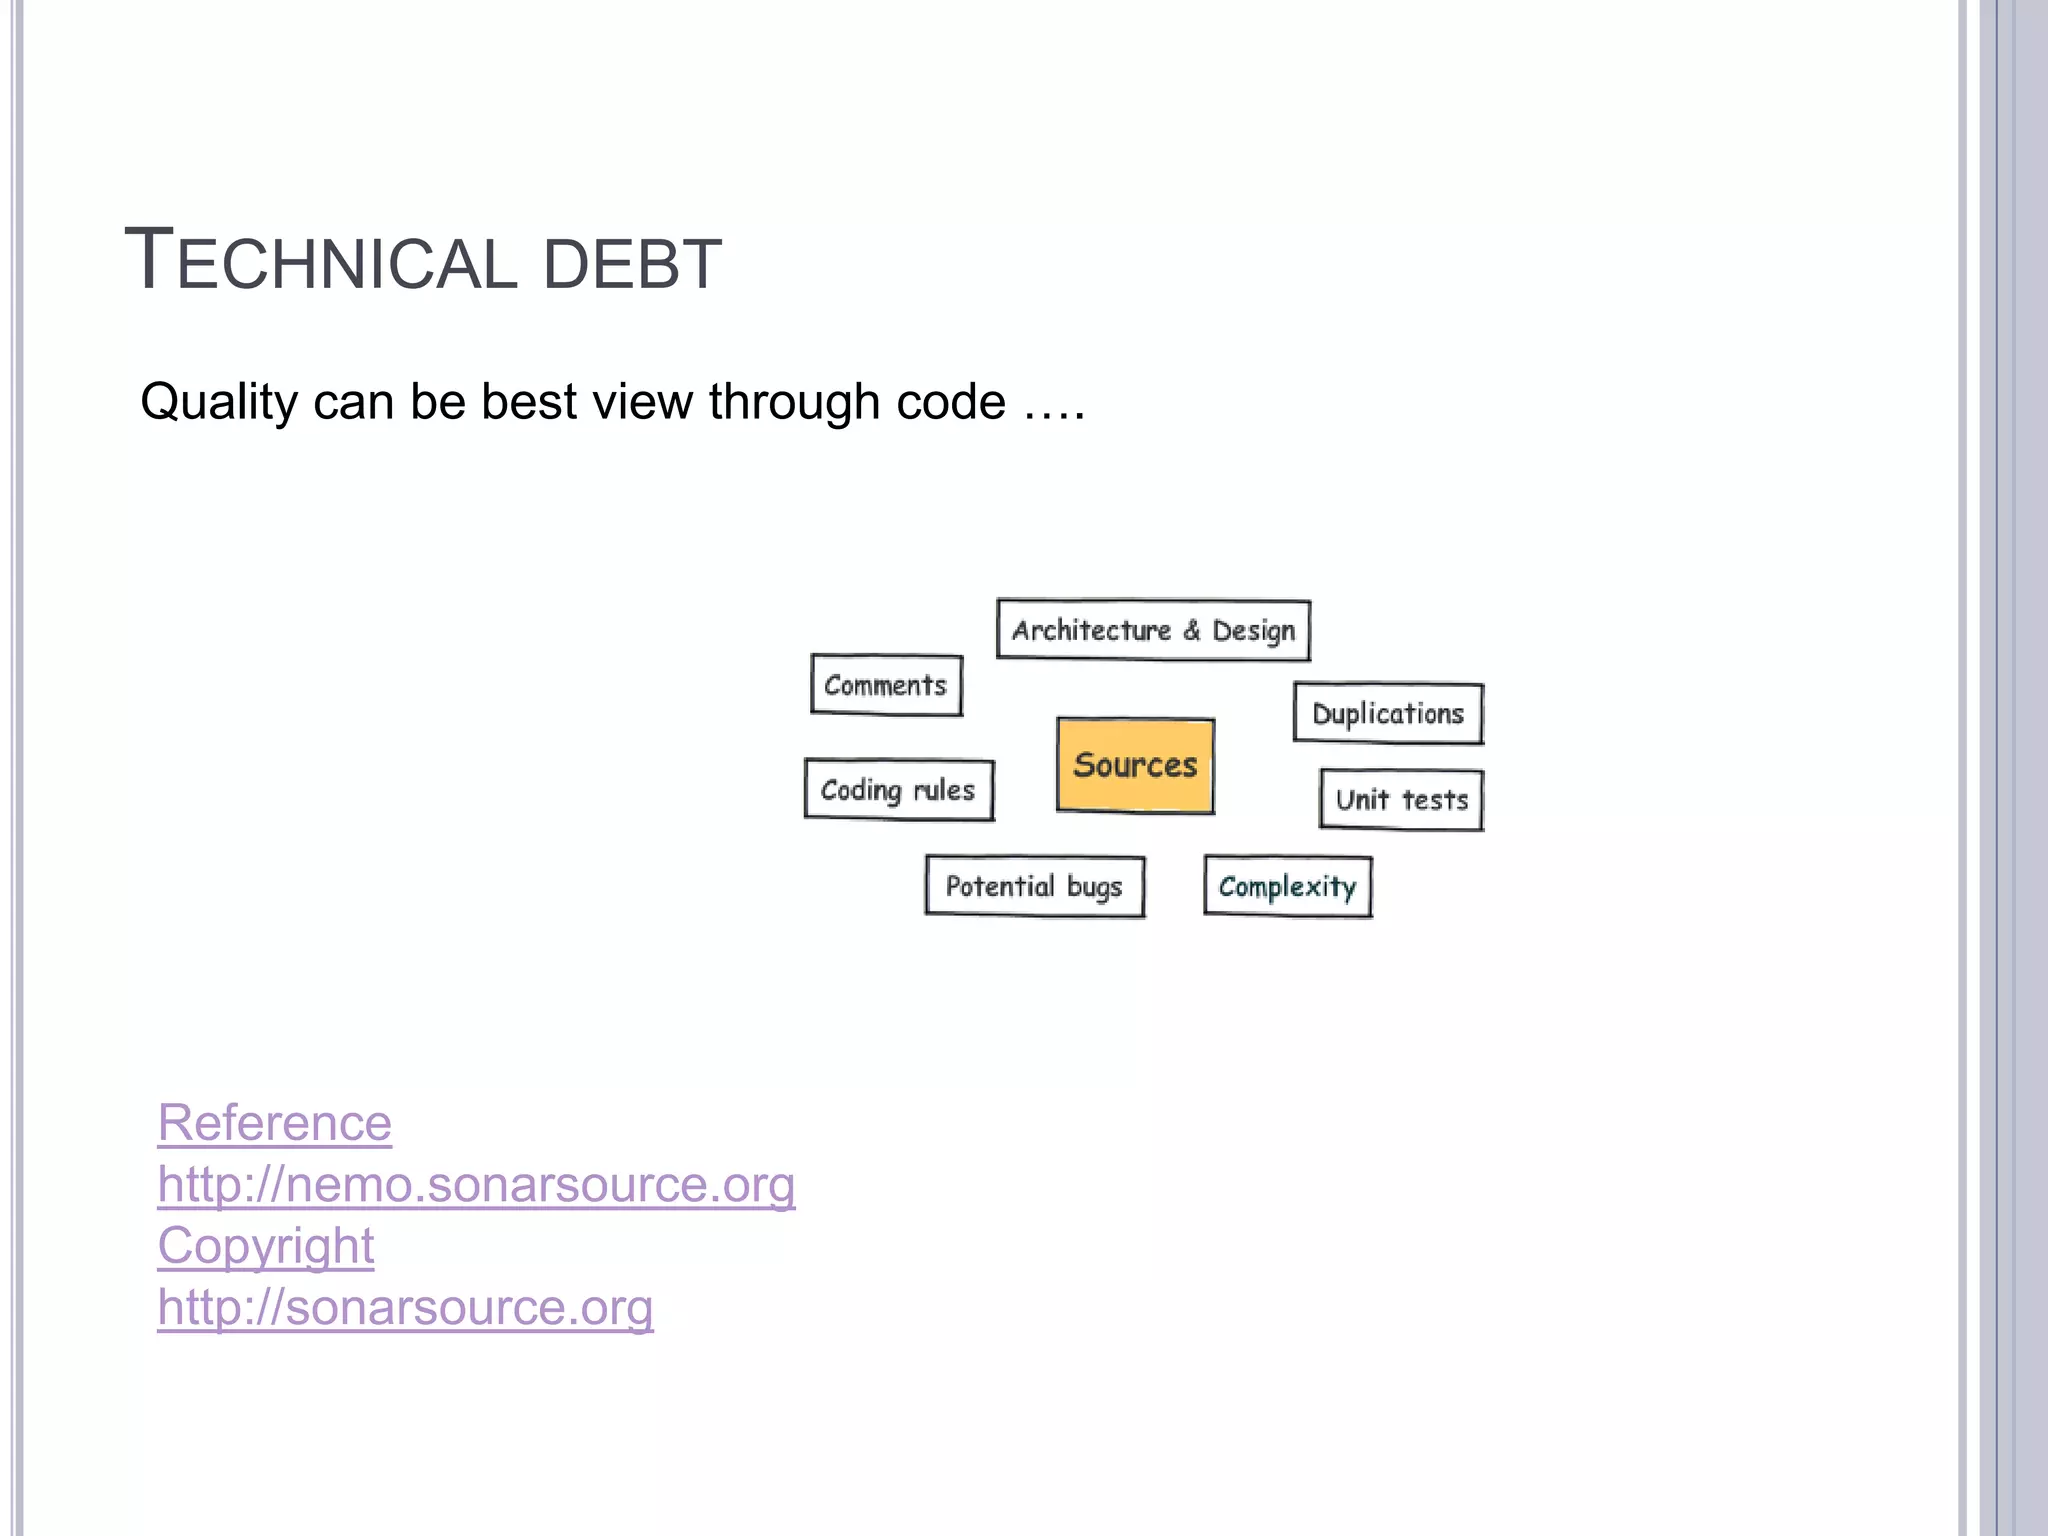
METRICS FOR AGILE

  CSI SPIN Mumbai Chapter 2011


                                        -Priyank
                 email: priyankdk@gmail.com

            © Cybercom Datamatics Information Solutions.
ABOUT US
Measure


Metrics
Qualitative         Quantitative


              © Cybercom Datamatics
FULLY SUPERVISED


                   PARTIAL SUPERVISED
                      © Cybercom Datamatics
DEFINITIONS
   Effort – the actual hours required to write the software.
   Defect – the unaccepted functionality, hopefully identified by test case…
    through web search - A flaw in a component or system that can cause the
    component or system to fail to perform its required function.
   Schedule/Duration –the calendar time to get something done
   Cost – strongly correlated with effort, but duration also plays a role
   Size – something that can be counted/measured. Hopefully it is
    representative of effort.
   Plan/Estimated – our educated guess, is a probability.
   Actual – measured result.

   Quality – A delight
METRICS FOR AGILE
-   Efforts ,Top-Line, Velocity, Burn-Down,
-   Cost
-   Schedule, Time to market , Cycle time
-   Defects
-   Technical debt
                               NEED OF THESE METRICS
                                 Can help you
                                     Understand about scrum performance
                                     Drawing scrum progress, productivity,
                                      predictability
                                     Analyze quality and value
                                     Pain points, Improvement areas
                                     Motivation & Performance
                                     Simple

           Scrum (Time Boxed Continuous Iterations & Release)
MANIFESTO FOR AGILE


        © Agile Alliance http://agilemanifesto.org
AGILE IS VALUE DRIVEN & ADAPTIVE

Constraints       Requirement           Cost        Schedule


                                           Value Driven


                   Plan Driven


Estimates     Schedule           Cost          Features

                 Predictive               Agile - Adaptive
TOP-LINE, RELEASE BURN-UP
                            Base Measure –
                            • Total Number of Story
                              Points
                            • Total Number of Sprints
                              Planned
                            • Story Points planned at
                              each sprint
                            • Story Points completed in
                              each sprint
VELOCITY
   Velocity is relative measure of progress. It can be measured by Feature delivered in
    an iteration
   & It is a measure of how much Product Backlog the team can complete in a given
    amount of time.
   Feature are usually initial stories and some times are set of feature with some non
    features.
BURN DOWN
   Burn-down chart shows the estimated number of hours required to complete
    the tasks of the Sprint.
   And similar to earned-value chart if you count the delivered functionality over
    time – Accepted work.
   It shows both the status and rate of progress (“velocity”) in a way that is both
    clear and easy to discuss.
BURN UP
   Burn-up chart shows the amount of Accepted work (that work which has been
    completed, tested and met acceptance criteria)
   And is shows the Scope - how much work is in the project as whole.
SCHEDULE & COST METRICS
Metrics can be derived from this –
   Actual percent complete (APC)
        = Complete Story Point/Total Story Points
   Expected Percent Complete(EPC)
         = Number of completed iterations /number of planned iteration
                                                                             Base Measure –
   Planned Value (PV)= EPC x Budget                                         • Budget Allocated for the project
                                                                             • Total Number of Story Points
   AC =Actual Cost in $ or soft-cost in Hrs spent
                                                                             • Total Number of Sprints Planned
   EV(Earned Value)=APC x Budget                                            • Story Points planned at each sprint
                                                                             • Story Points completed in each sprint
   Schedule Performance Index (SPI)                                         • Release variance – plan vs. actual
         = EV/PV, greater than 1 is good (ahead of schedule)
   Cost Performance Index (CPI)
         = EV/ AC, greater than 1 is good (under budget)
   Cost variance (CV) = EV – AC, greater than 0 is good (under budget)
   Schedule variance (SV)= EV –PV, greater than 0 is good (ahead of schedule)


   Value realization or Velocity.
VALUE REALIZATION (VELOCITY)

   In the given example -
   Budget = 100 $
   Total SP = 120
   Total Sprint = 12


   After 4th Sprint where in First Sprint SP
    Accepted 9 out of 10, in Second Sprint 10
    out of 10, in Third 10 : 10 & in Fourth
    10:10


   APC = 39/120 which is 0.325 , in % 32.5
   EPC = 4/12 = 0.33 , in % 33.33
   PV = 0.33 x 100 = 33
   EV = 0.325 x 100 = 32.5
   Lets assume is AC = 40 $ (or 400 Hrs,
    where 10 Hrs = 1 $)


   SPI = 32.5/33 = 0.98
   CPI = 32.5/40 = 0.81
DEFECTS
   Defect Removal Efficiency (DRE) is a base measure which we can tailor for
    Scrum
   DRE = E / ( E + D )
        Where E = No. of Errors found before delivery of the software and
        D = No. of Errors found after delivery of the software
   @Scrum
        E = No. of Errors found before delivery of the software in any iteration (@ during sprint execution
         )and
        D = No. of Errors found after delivery of the software (@ Production )
   Ideal DRE = 1.
   DRE less than 1 needs RCA
TECHNICAL DEBT
Quality can be best view through code ….


Reference
http://nemo.sonarsource.org
Copyright
http://sonarsource.org
FEW MORE BASICS QUALITY METRICS
 Technical debt
 Test case, Bugs

 Complexity

 Cyclomatic Complexity

 Violations

 Class, Methods, Duplication, Comments etc..
QUALITY METRICS -


Reference
http://nemo.sonarsource.org
Copyright
http://sonarsource.org
REFERENCES -

   http://www.mountaingoatsoftware.com
   http://www.agilemodeling.com
   http://jamesshore.com/Agile-Book/assess_your_agility.html
   http://java.net/projects/hudson/
   http://www.sonarsource.org/
   http://docs.codehaus.org/display/SONAR/Metric+definitions
   https://wiki.rallydev.com
   http://www.infoq.com/
cdis.in

Metrics For Agile @CSI SPIN Mumbai Mar2011

  • 1.
    METRICS FOR AGILE CSI SPIN Mumbai Chapter 2011 -Priyank email: priyankdk@gmail.com © Cybercom Datamatics Information Solutions.
  • 2.
  • 3.
  • 6.
    Qualitative Quantitative © Cybercom Datamatics
  • 7.
    FULLY SUPERVISED PARTIAL SUPERVISED © Cybercom Datamatics
  • 8.
    DEFINITIONS  Effort – the actual hours required to write the software.  Defect – the unaccepted functionality, hopefully identified by test case… through web search - A flaw in a component or system that can cause the component or system to fail to perform its required function.  Schedule/Duration –the calendar time to get something done  Cost – strongly correlated with effort, but duration also plays a role  Size – something that can be counted/measured. Hopefully it is representative of effort.  Plan/Estimated – our educated guess, is a probability.  Actual – measured result.  Quality – A delight
  • 9.
    METRICS FOR AGILE - Efforts ,Top-Line, Velocity, Burn-Down, - Cost - Schedule, Time to market , Cycle time - Defects - Technical debt NEED OF THESE METRICS  Can help you  Understand about scrum performance  Drawing scrum progress, productivity, predictability  Analyze quality and value  Pain points, Improvement areas  Motivation & Performance  Simple Scrum (Time Boxed Continuous Iterations & Release)
  • 10.
    MANIFESTO FOR AGILE © Agile Alliance http://agilemanifesto.org
  • 11.
    AGILE IS VALUEDRIVEN & ADAPTIVE Constraints Requirement Cost Schedule Value Driven Plan Driven Estimates Schedule Cost Features Predictive Agile - Adaptive
  • 12.
    TOP-LINE, RELEASE BURN-UP Base Measure – • Total Number of Story Points • Total Number of Sprints Planned • Story Points planned at each sprint • Story Points completed in each sprint
  • 13.
    VELOCITY  Velocity is relative measure of progress. It can be measured by Feature delivered in an iteration  & It is a measure of how much Product Backlog the team can complete in a given amount of time.  Feature are usually initial stories and some times are set of feature with some non features.
  • 14.
    BURN DOWN  Burn-down chart shows the estimated number of hours required to complete the tasks of the Sprint.  And similar to earned-value chart if you count the delivered functionality over time – Accepted work.  It shows both the status and rate of progress (“velocity”) in a way that is both clear and easy to discuss.
  • 15.
    BURN UP  Burn-up chart shows the amount of Accepted work (that work which has been completed, tested and met acceptance criteria)  And is shows the Scope - how much work is in the project as whole.
  • 16.
    SCHEDULE & COSTMETRICS Metrics can be derived from this –  Actual percent complete (APC) = Complete Story Point/Total Story Points  Expected Percent Complete(EPC) = Number of completed iterations /number of planned iteration Base Measure –  Planned Value (PV)= EPC x Budget • Budget Allocated for the project • Total Number of Story Points  AC =Actual Cost in $ or soft-cost in Hrs spent • Total Number of Sprints Planned  EV(Earned Value)=APC x Budget • Story Points planned at each sprint • Story Points completed in each sprint  Schedule Performance Index (SPI) • Release variance – plan vs. actual = EV/PV, greater than 1 is good (ahead of schedule)  Cost Performance Index (CPI) = EV/ AC, greater than 1 is good (under budget)  Cost variance (CV) = EV – AC, greater than 0 is good (under budget)  Schedule variance (SV)= EV –PV, greater than 0 is good (ahead of schedule)  Value realization or Velocity.
  • 17.
    VALUE REALIZATION (VELOCITY)  In the given example -  Budget = 100 $  Total SP = 120  Total Sprint = 12  After 4th Sprint where in First Sprint SP Accepted 9 out of 10, in Second Sprint 10 out of 10, in Third 10 : 10 & in Fourth 10:10  APC = 39/120 which is 0.325 , in % 32.5  EPC = 4/12 = 0.33 , in % 33.33  PV = 0.33 x 100 = 33  EV = 0.325 x 100 = 32.5  Lets assume is AC = 40 $ (or 400 Hrs, where 10 Hrs = 1 $)  SPI = 32.5/33 = 0.98  CPI = 32.5/40 = 0.81
  • 18.
    DEFECTS  Defect Removal Efficiency (DRE) is a base measure which we can tailor for Scrum  DRE = E / ( E + D )  Where E = No. of Errors found before delivery of the software and  D = No. of Errors found after delivery of the software  @Scrum  E = No. of Errors found before delivery of the software in any iteration (@ during sprint execution )and  D = No. of Errors found after delivery of the software (@ Production )  Ideal DRE = 1.  DRE less than 1 needs RCA
  • 19.
    TECHNICAL DEBT Quality canbe best view through code …. Reference http://nemo.sonarsource.org Copyright http://sonarsource.org
  • 20.
    FEW MORE BASICSQUALITY METRICS  Technical debt  Test case, Bugs  Complexity  Cyclomatic Complexity  Violations  Class, Methods, Duplication, Comments etc..
  • 21.
  • 22.
    REFERENCES -  http://www.mountaingoatsoftware.com  http://www.agilemodeling.com  http://jamesshore.com/Agile-Book/assess_your_agility.html  http://java.net/projects/hudson/  http://www.sonarsource.org/  http://docs.codehaus.org/display/SONAR/Metric+definitions  https://wiki.rallydev.com  http://www.infoq.com/
  • 23.