Download as PDF, PPTX

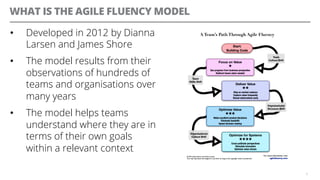
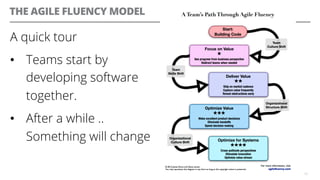
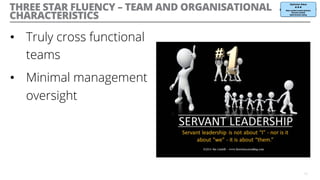
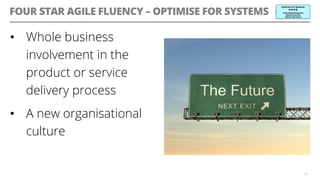
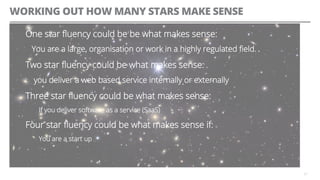
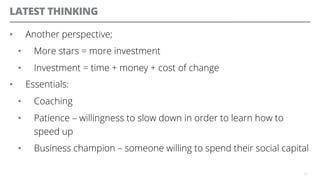
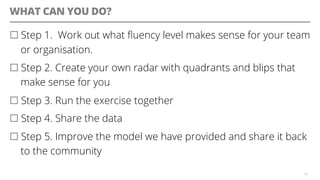

The document outlines the Agile Fluency Model, developed by Dianna Larsen and James Shore, which helps teams assess their progress towards agile practices based on their specific context. It describes four levels of fluency, ranging from basic value delivery to optimizing entire systems, each with associated team characteristics and metrics. A case study illustrates the application of the model in a large organization, highlighting practices, necessary data collection, and opportunities for improvement.


![Getting Started with Apache Spark: Big Data Made Simple [Free Meetup]](https://cdn.slidesharecdn.com/ss_thumbnails/apachesparkgettingstarted-260203175547-8361bcc3-thumbnail.jpg?width=640&height=640&fit=bounds)


