Download as PDF, PPTX


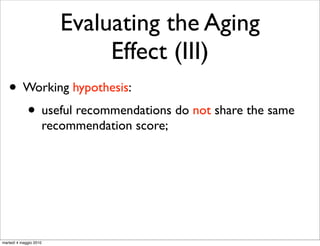
![The Query-Flow Graph
•
barcelona fc
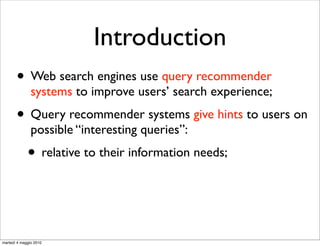
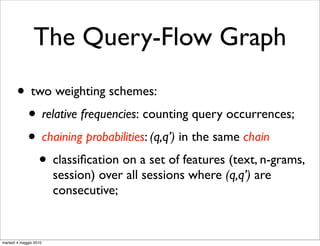
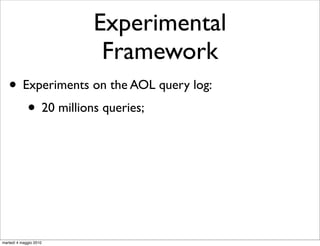
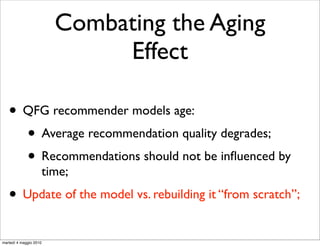
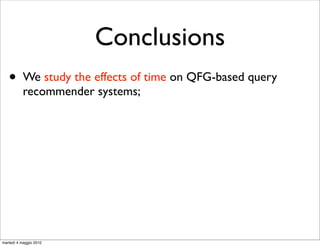
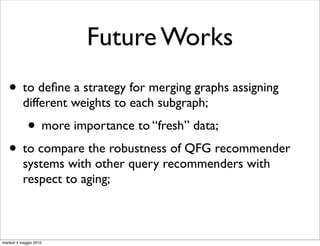
QFG [Boldi et al., CIKM’08] is a website
compact and powerful representation 0.043
barcelona fc
of Web Search engine users’ behavior; 0.031
fixtures
barcelona fc 0.017 real
madrid
0.080
0.011
0.506
0.439
barcelona
hotels 0.072
0.018 cheap
barcelona
0.023
hotels
0.029
<T>
barcelona luxury
0.043
barcelona
0.018
barcelona hotels
weather
0.416
0.523
0.100
barcelona
weather
online
martedì 4 maggio 2010](https://image.slidesharecdn.com/talk-riao-100504053928-phpapp02/85/The-Effects-of-Time-on-Query-Flow-Graph-based-Models-for-Query-Suggestion-12-320.jpg)
![The Query-Flow Graph
•
barcelona fc
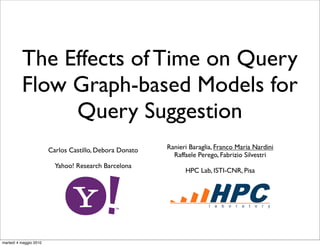
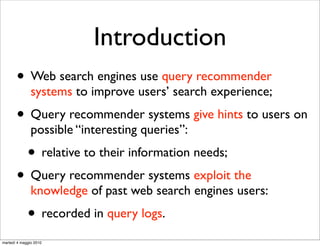
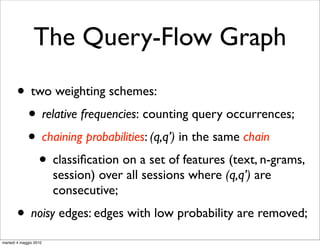
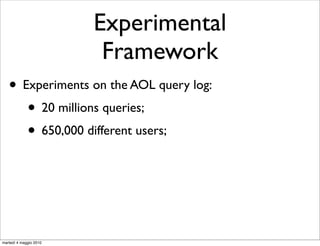
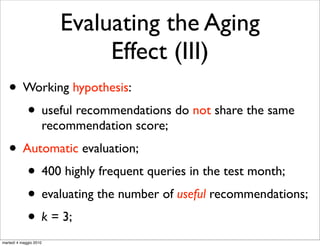
QFG [Boldi et al., CIKM’08] is a website
compact and powerful representation 0.043
barcelona fc
of Web Search engine users’ behavior; 0.031
fixtures
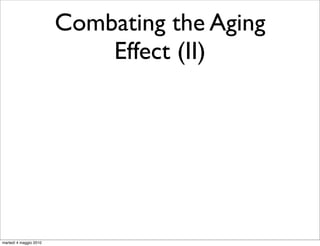
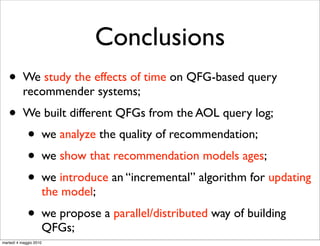
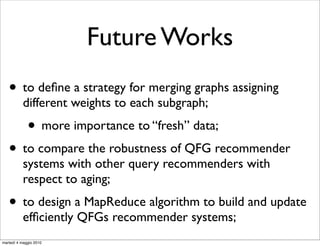
• QFG is a graph composed by:
0.080
barcelona fc 0.017 real
madrid
1. a set of nodes, V = Q ∪ {s,t}; 0.011
0.506
0.439
2. a set of directed edges, E ⊆ V x V: barcelona
hotels 0.072
0.018 cheap
•
barcelona
0.023
(q, q’) are connected if they are 0.029
hotels
<T>
consecutive at least one time in 0.043
barcelona luxury
at least one session;
barcelona
0.018
barcelona hotels
weather
0.416
3. a weighting function w = E --> (0, 1]:
•
0.523
assigning a weight w(q, q’) to 0.100
each edge; barcelona
weather
online
martedì 4 maggio 2010](https://image.slidesharecdn.com/talk-riao-100504053928-phpapp02/85/The-Effects-of-Time-on-Query-Flow-Graph-based-Models-for-Query-Suggestion-13-320.jpg)


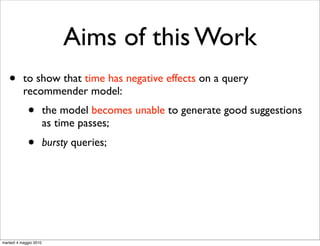
![Boldi et al. in [4]. This method uses chaining probabi
measured by means of a machine learning method. The
Experimental
tial step was thus to extract those features from each t
ing log, and storing them into a compressed graph re
sentation. In particular we extracted 25 different feat
Assumptions
(time-related, session and textual features) for each pa
queries (q, q ) that are consecutive in at least one sessio
the query log.
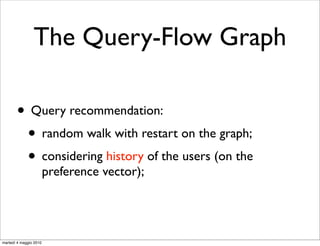
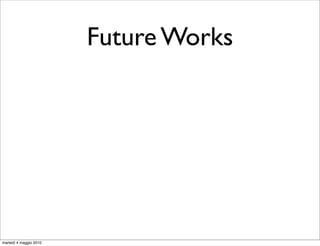
Table 1 shows the number of nodes and edges of the
• M , M are used for training;
1 2
ferent graphs corresponding to each query log segment
for training.
• two different QFGs; time window
March 06
id
M1
nodes
3,814,748
edges
6,129,629
April 06 M2 3,832,973 6,266,648
Table 1: Number of nodes and edges for the gra
corresponding to the two different training
ments.
It is important to remark that we have not re-trained
classification model for the assignment of weights associ
with QFG edges. We reuse the one that has been used i
for segmenting users sessions into query chains1 . Th
another point in favor of QFG-based models. Once you t
the classifier to assign weights to QFG edges, you can r
it on different data-sets without losing in effectiveness.
martedì 4 maggio 2010 1](https://image.slidesharecdn.com/talk-riao-100504053928-phpapp02/85/The-Effects-of-Time-on-Query-Flow-Graph-based-Models-for-Query-Suggestion-27-320.jpg)
![Boldi et al. in [4]. This method uses chaining probabi
measured by means of a machine learning method. The
Experimental
tial step was thus to extract those features from each t
ing log, and storing them into a compressed graph re
sentation. In particular we extracted 25 different feat
Assumptions
(time-related, session and textual features) for each pa
queries (q, q ) that are consecutive in at least one sessio
the query log.
Table 1 shows the number of nodes and edges of the
• M , M are used for training;
1 2
ferent graphs corresponding to each query log segment
for training.
• two different QFGs; time window
March 06
id
M1
nodes
3,814,748
edges
6,129,629
April 06 M2 3,832,973 6,266,648
• Queries in the third month Number of nodes testing; for the gra
Table 1: are used for and edges
corresponding to the two different training
ments.
It is important to remark that we have not re-trained
classification model for the assignment of weights associ
with QFG edges. We reuse the one that has been used i
for segmenting users sessions into query chains1 . Th
another point in favor of QFG-based models. Once you t
the classifier to assign weights to QFG edges, you can r
it on different data-sets without losing in effectiveness.
martedì 4 maggio 2010 1](https://image.slidesharecdn.com/talk-riao-100504053928-phpapp02/85/The-Effects-of-Time-on-Query-Flow-Graph-based-Models-for-Query-Suggestion-28-320.jpg)
![Boldi et al. in [4]. This method uses chaining probabi
measured by means of a machine learning method. The
Experimental
tial step was thus to extract those features from each t
ing log, and storing them into a compressed graph re
sentation. In particular we extracted 25 different feat
Assumptions
(time-related, session and textual features) for each pa
queries (q, q ) that are consecutive in at least one sessio
the query log.
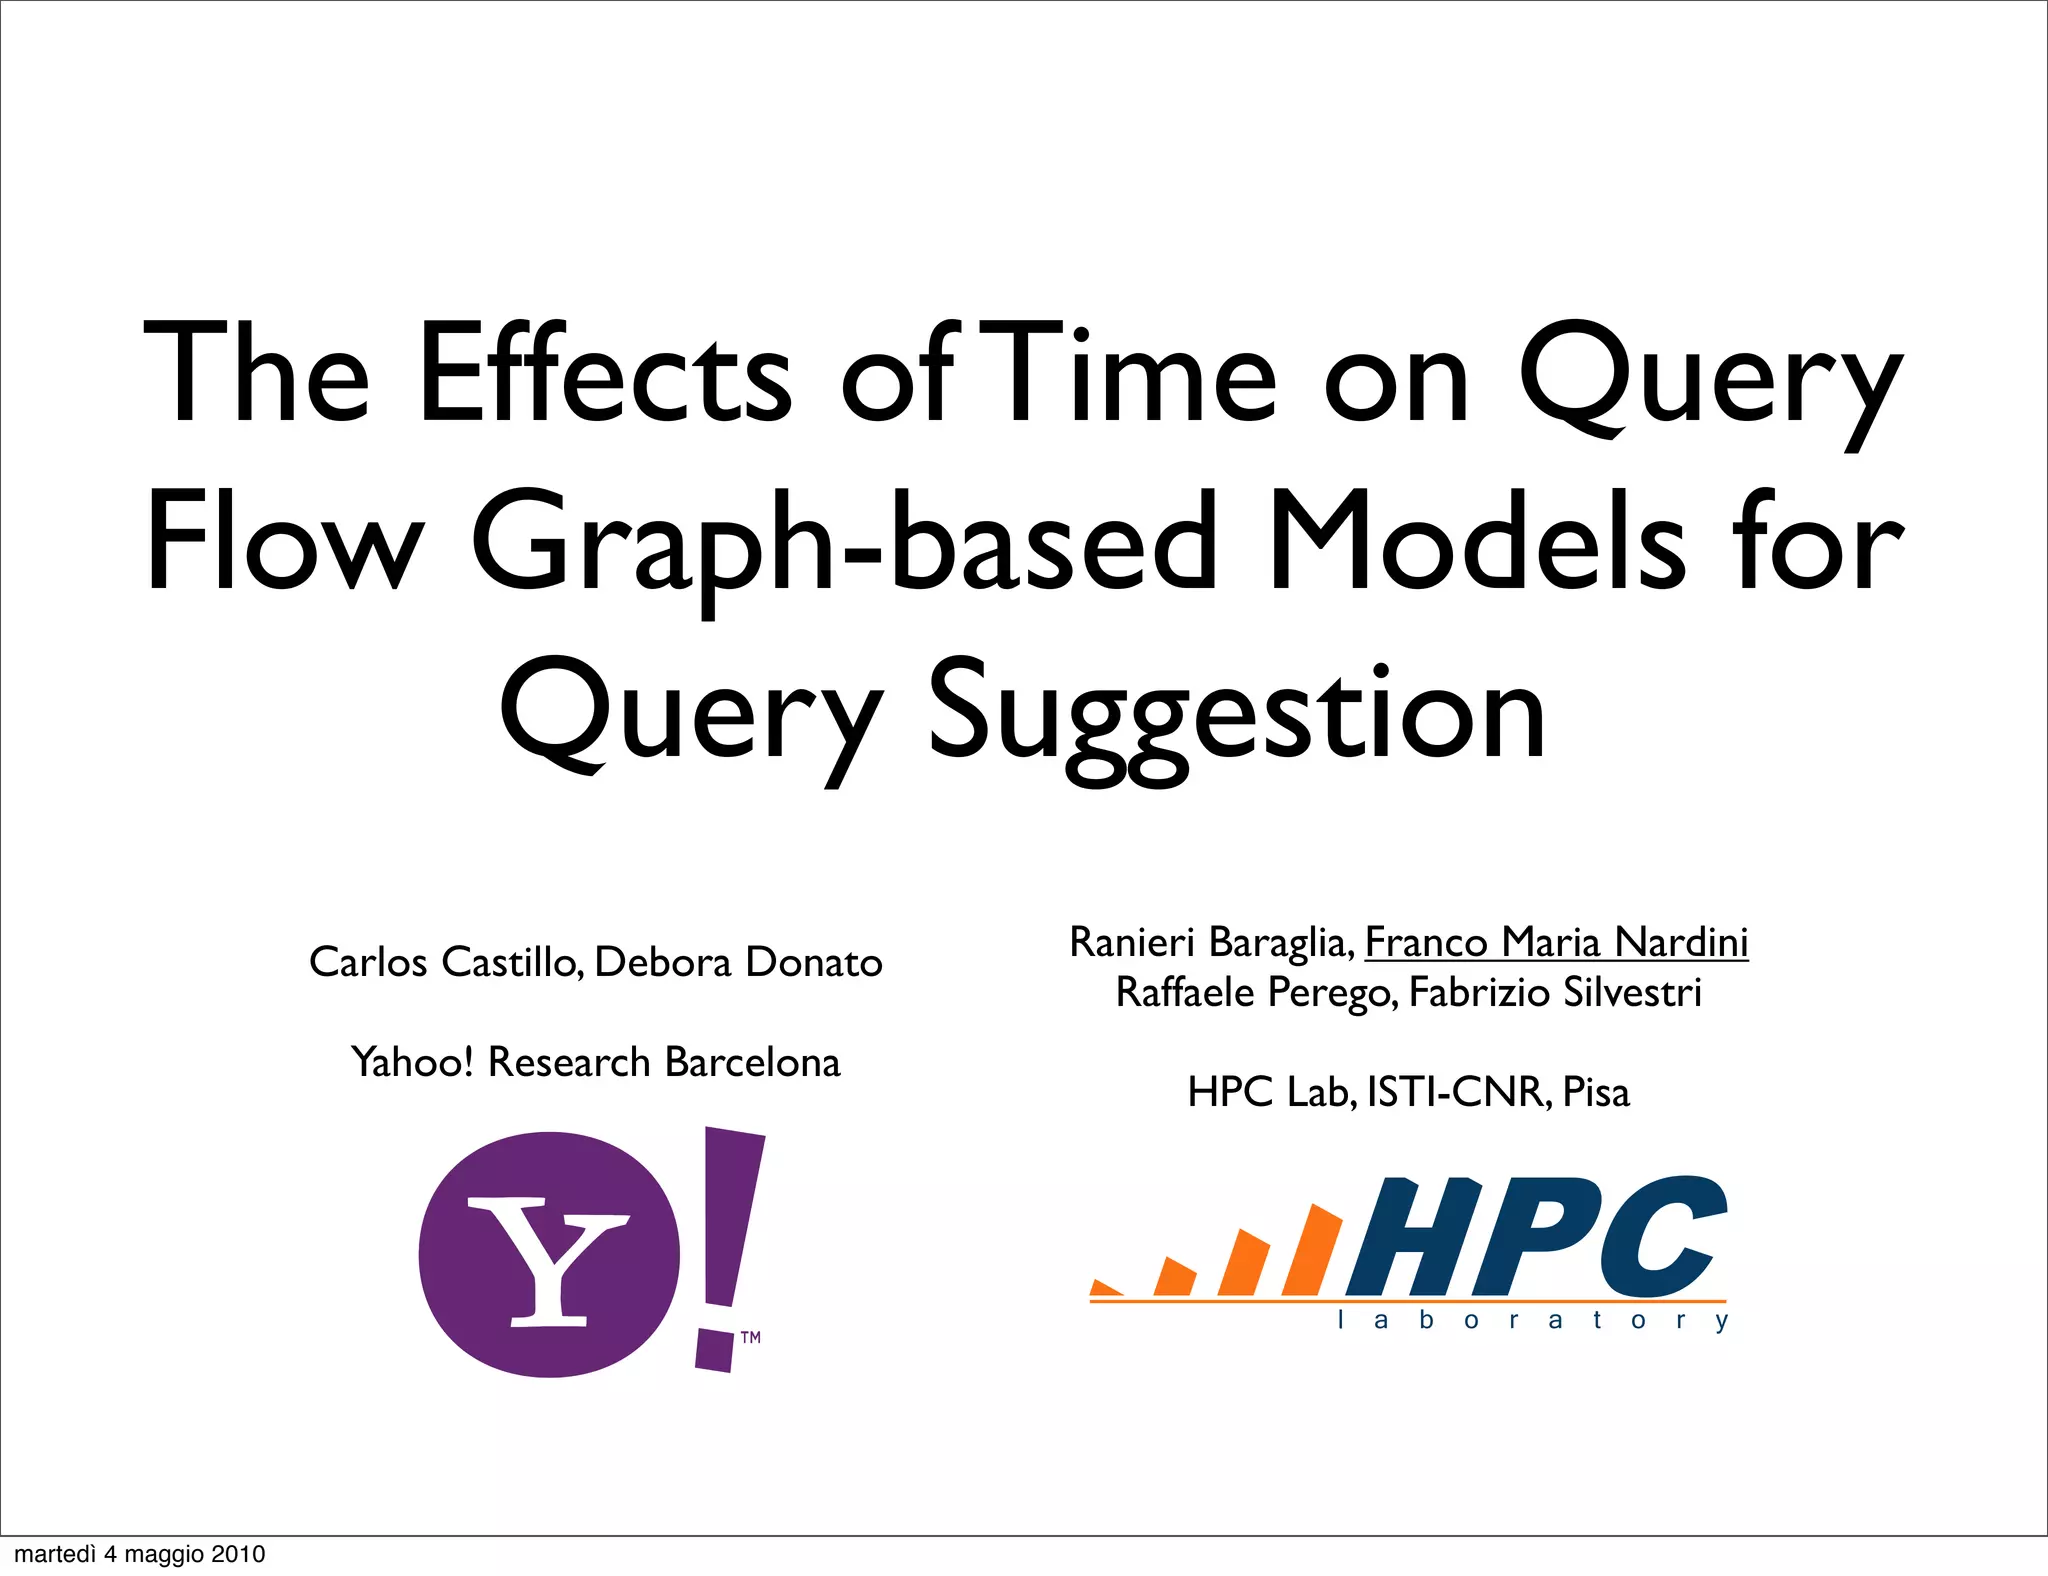
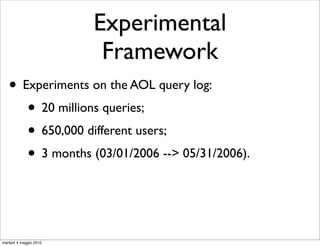
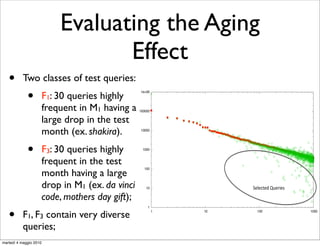
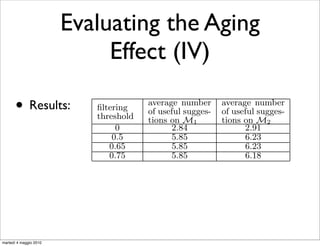
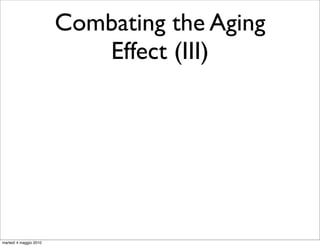
Table 1 shows the number of nodes and edges of the
• M , M are used for training;
1 2
ferent graphs corresponding to each query log segment
for training.
• two different QFGs; time window
March 06
id
M1
nodes
3,814,748
edges
6,129,629
April 06 M2 3,832,973 6,266,648
• Queries in the third month Number of nodes testing; for the gra
Table 1: are used for and edges
corresponding to the two different training
• We evaluate the aging effect by measuring the quality
ments.
of suggestions produced by models on M , and M ;
It is important to remark that we have not re-trained
1 2
classification model for the assignment of weights associ
• If the model ages M
with QFG edges. We reuse the one that has been used i
outperforms M , in terms of
for segmenting users sessions1into query chains1 . Th
2
another point in favor of QFG-based models. Once you t
quality of suggestions;
the classifier to assign weights to QFG edges, you can r
it on different data-sets without losing in effectiveness.
martedì 4 maggio 2010 1](https://image.slidesharecdn.com/talk-riao-100504053928-phpapp02/85/The-Effects-of-Time-on-Query-Flow-Graph-based-Models-for-Query-Suggestion-29-320.jpg)


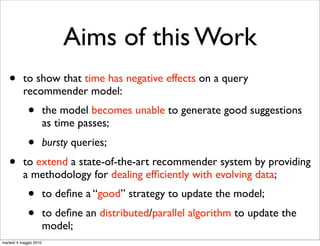
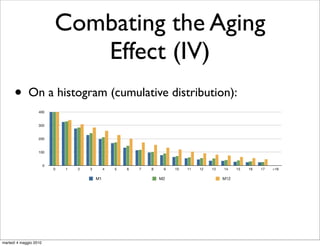
![Combating the Aging
t a model
or which Effect (II)
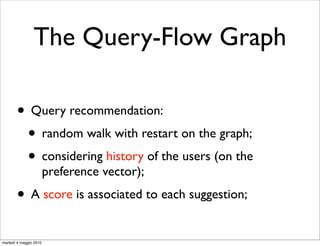
QFGs. Suppose the model used to generate recommenda-
tions consists of a portion of data representing one month
(for M1 and M2 ) or two months (for M12 ) of the query
commen- log. The model is being updated every 15 days (for M1
•
to always and M2 ) or every 30 days (for M12 ). By using the first ap-
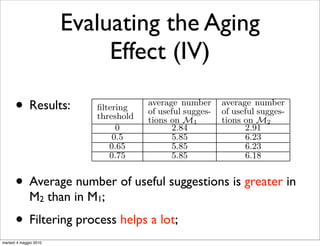
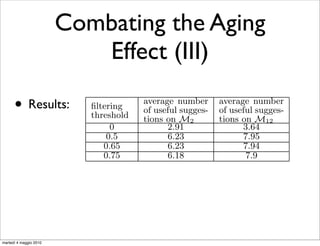
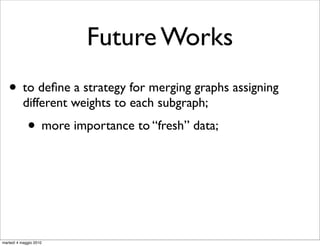
Solution: incremental update of Mevery means days to rebuild
proach, we pay 22 (44) minutes 1 by 15 (30) of “fresh data” in M2
•
the new model from scratch on a new set of data obtained
Graph the last two months of the query log. Instead, by using
from algebra [Bordino et al., 2008];
FLOW
•
the second approach, we need to pay only 15 (32) minutes
Some measures on the two different approaches:
for updating the one-month (two-months) QFG.
apidly in
“From scratch” “Incremental”
commen-
Dataset strategy [min.] strategy [min.]
endation M1 (March 2006) 21 14
tive queries. M2 (April 2006) 22 15
both fre- M12 (March and April) 44 32
heir value
ariation). Table 5: Time needed to build a Query Flow Graph
o movies, from scratch and using our “incremental” approach
eral with (from merging two QFG representing an half of
it is easy data).
martedì 4 maggio 2010](https://image.slidesharecdn.com/talk-riao-100504053928-phpapp02/85/The-Effects-of-Time-on-Query-Flow-Graph-based-Models-for-Query-Suggestion-52-320.jpg)
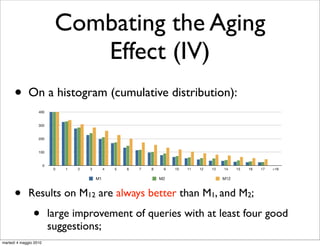
![Combating the Aging
t a model
or which Effect (II)
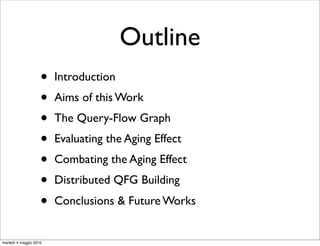
QFGs. Suppose the model used to generate recommenda-
tions consists of a portion of data representing one month
(for M1 and M2 ) or two months (for M12 ) of the query
commen- log. The model is being updated every 15 days (for M1
•
to always and M2 ) or every 30 days (for M12 ). By using the first ap-
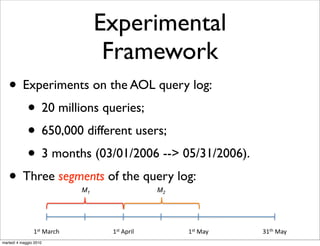
Solution: incremental update of Mevery means days to rebuild
proach, we pay 22 (44) minutes 1 by 15 (30) of “fresh data” in M2
•
the new model from scratch on a new set of data obtained
Graph the last two months of the query log. Instead, by using
from algebra [Bordino et al., 2008];
FLOW
•
the second approach, we need to pay only 15 (32) minutes
Some measures on the two different approaches:
for updating the one-month (two-months) QFG.
apidly in
“From scratch” “Incremental”
commen-
Dataset strategy [min.] strategy [min.]
endation M1 (March 2006) 21 14
tive queries. M2 (April 2006) 22 15
both fre- M12 (March and April) 44 32
•
heir value
Incremental updates: 2/3 of the build w.r.t. “from scratch” strategy;
ariation). Table 5: Time needed to time a Query Flow Graph
from scratch and using our “incremental” approach
•
o movies,
Evaluation onmerging two QFG representing an half of
eral with (from the same set of 400 queries;
it is easy data).
martedì 4 maggio 2010](https://image.slidesharecdn.com/talk-riao-100504053928-phpapp02/85/The-Effects-of-Time-on-Query-Flow-Graph-based-Models-for-Query-Suggestion-53-320.jpg)


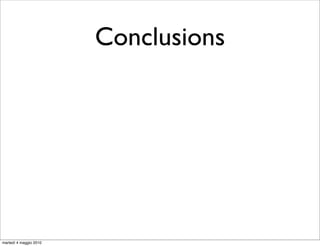
![Distributed QFG
4. using the graph algebra described in [8], each pa
graph is iteratively merged. Each iteration is do
parallel on the different available nodes of the clo
Building
5. the final resulting data-graph is now processed
other steps [4] (normalization, chain extraction,
dom walk) to obtain the complete and usable QF
• a parallel way to update QFGs:
01)2()*+,'#3456#7)8#
Divide-and-Conquer approach;
• the query log is split in m
!#$%'# !#$%'# !#$%'# !#$%'#
parts;
• parallel extraction of the
-./# -./# -./# -./#
features;
• compressing step;
!#()*+,#-./# !#()*+,#-./#
• merging graphs;
• final operations 9#()*+,'#-./#
(normalization, pagerank, etc.);
martedì 4 maggio 2010 Figure 6: Example of the building of a two mo](https://image.slidesharecdn.com/talk-riao-100504053928-phpapp02/85/The-Effects-of-Time-on-Query-Flow-Graph-based-Models-for-Query-Suggestion-61-320.jpg)

![References
• [Boldi et al., CIKM’08]: The Query Flow Graph: model
and applications. Boldi, Bonchi, Castillo, Donato,
Gionis,Vigna. CIKM’08.
• [Boldi et al., WSCD’09]: Query Suggestions using
Query-Flow Graphs. Boldi, Bonchi, Castillo, Donato,
Vigna. WSCD’09.
• [Bordino et al., 2008]: Algebra for the joint mining of
query log graphs, 2008.
martedì 4 maggio 2010](https://image.slidesharecdn.com/talk-riao-100504053928-phpapp02/85/The-Effects-of-Time-on-Query-Flow-Graph-based-Models-for-Query-Suggestion-70-320.jpg)

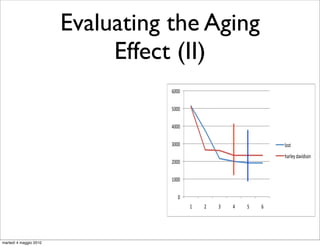
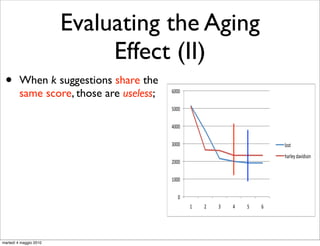
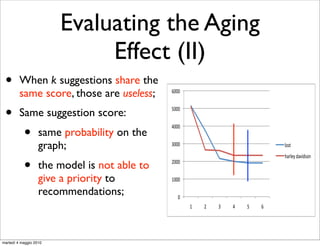
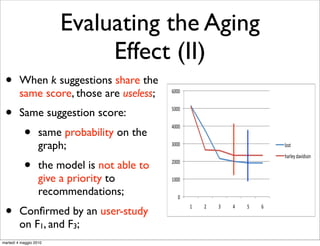
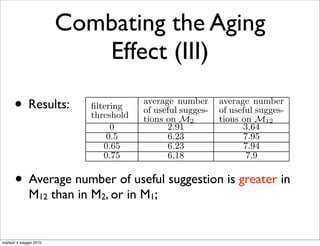
The document discusses the negative effects of time on query flow graph (QFG)-based models used for query suggestion in search engines, highlighting that the ability to generate relevant suggestions diminishes over time. It aims to extend existing models by introducing methodologies for effectively updating them to adapt to evolving data and outlines an experimental framework based on AOL query logs to evaluate these models. Attempts to counter aging effects in query suggestion, including the implementation of a distributed algorithm for model updates, are explored.