SlideShare a Scribd company logo
1 of 13
Download to read offline
Consolidated Report to the Financial Community
Third Quarter 2007
(Released October 30, 2007) (Unaudited)

HIGHLIGHTS                                        After-Tax EPS Variance Analysis                3rd Qtr.
                                                  3Q 2006 Basic EPS – GAAP Basis                  $1.41
   Normalized non-GAAP* earnings, excluding         Special Items – 2006                            0.01
   special items, were $1.32 per share for the    3Q 2006 Normalized Earnings – Non-GAAP Basis* $1.42
                                                    Distribution Deliveries                       (0.03)
   third quarter of 2007, compared with $1.42
                                                    Met-Ed and Penelec Distribution Rate Decrease (0.07)
   per share for the third quarter of 2006.         Generation Revenues                             0.20
   GAAP earnings for the third quarter of 2007      Purchased Power                               (0.11)
   were $1.36 per share compared with $1.41         Sale of Emission Allowances - 2006            (0.06)
                                                    Pensions and Other Post-retirement Benefits     0.06
   per share in the prior year.
                                                    Depreciation                                  (0.02)
                                                    General Taxes                                 (0.02)
3Q 2007 Results vs. 3Q 2006
                                                    Investment Income – NDT and COLI              (0.04)
                                                    Financing Costs                               (0.03)
   Electric distribution deliveries declined        Income Tax Benefit - 2006                     (0.05)
   slightly primarily due to milder weather in      Reduced Common Shares                           0.08
   the eastern portion of our service area          Other                                         (0.01)
                                                  3Q 2007 Normalized Earnings – Non-GAAP Basis* $1.32
   compared to the previous year. Residential
                                                    Special Items - 2007                            0.04
   and industrial deliveries decreased 2% and
                                                  3Q 2007 Basic EPS – GAAP Basis                   $1.36
   1%,     respectively,    while    commercial
   deliveries increased 1%.       The change in
   customer class and geographic sales mix, along with the slight overall decrease in distribution
   deliveries, reduced earnings by $0.03 per share, while the impact of the distribution rate
   decrease at Metropolitan Edison Company (Met-Ed) and Pennsylvania Electric Company
   (Penelec), effective January 2007, reduced earnings by $0.07 per share.
   Total electric generation sales increased 1%, as an increase of 0.9 million megawatt hours
   (MWh) or 16% in wholesale sales was partially offset by a 0.6 million MWh or 2% reduction in
   retail generation sales. Generation revenues, excluding power sourced from third-party auction
   suppliers for our Jersey Central Power & Light Company (JCP&L) and Pennsylvania Power
   Company (Penn Power) customers, increased earnings by $0.20 per share. This increase was
   attributable to higher wholesale and retail prices, as well as higher sales volumes.
   Higher purchased power expense, excluding JCP&L and Penn Power purchases from third-party
   auction suppliers, reduced earnings by $0.11 per share due to replacement power purchases for
   the 25-day outage at the Perry Nuclear Power Plant and higher market prices.
   The absence of any material sales of emission allowances in the third quarter of 2007, compared
   to the same period last year, reduced earnings by $0.06 per share.
   Reduced pension and other post-retirement benefit costs increased earnings by $0.06 per share,
   mainly due to retiree health care design changes and the impact of the $300-million voluntary
   contribution to the pension plan made in January 2007.
   Incremental property additions increased depreciation expense by $0.02 per share.
Higher general taxes reduced earnings by $0.02 per share, primarily due to increased property
    taxes and Pennsylvania gross receipts taxes.
    Decreased investment income related to nuclear decommissioning trusts and corporate-owned
    life insurance reduced earnings by $0.04 per share.
    Increased financing costs lowered earnings by $0.03 per share, primarily attributable to the
    interim financing of the accelerated share repurchase program and the January 2007 pension
    plan contribution.
    A $0.05 per share reduction in earnings resulted from an income tax benefit that increased
    earnings in the third quarter last year. The benefit principally related to the 2005 estimated
    manufacturing deduction in connection with the filing of the 2005 federal income tax return in
    September 2006.
    The reduction in shares outstanding due to the accelerated repurchases of 10.6 million and
    14.4 million common shares in August 2006 and March 2007, respectively, enhanced earnings
    by $0.08 per share.
    During the quarter, a $0.04 per share increase in earnings was recognized from gains related to
    the sale of a portion of our ownership interest in First Communications.


2007 Earnings Guidance

    Normalized non-GAAP earnings guidance for 2007, excluding special items, has been revised
    to $4.15 to $4.25 per share from our previous non-GAAP guidance of $4.05 to $4.25 per share.
    The increase toward the top half of the prior guidance reflects the strong performance during the
    first nine months of the year. Year-to-date normalized non-GAAP earnings through September
    now stand at $3.33 per share.


* The 2007 GAAP to non-GAAP reconciliation statements can be found on page 10 of this report and all GAAP to non-GAAP
reconciliation statements are available on the Investor Information section of FirstEnergy Corp.'s Web site at
www.firstenergycorp.com/ir.


For additional information, please contact:
    Ronald E. Seeholzer                       Kurt E. Turosky                       Rey Y. Jimenez
    Vice President, Investor Relations        Director, Investor Relations          Principal, Investor Relations
    (330) 384-5783                            (330) 384-5500                        (330) 761-4239

Consolidated Report to the Financial Community –3rd Quarter 2007                                                    2
FirstEnergy Corp.
                                                     Consolidated Statements of Income
                                                                     (Unaudited)
                                                    (In millions, except for per share amounts)

                                                                  Three Months Ended Sept. 30,              Nine Months Ended Sept. 30,
                                                                2007         2006         Change         2007          2006         Change
           Revenues
       (1) Electric sales                                   $     3,394    $   3,115    $     279    $     9,062    $   8,179     $     883
       (2) FE Facilities                                              -           10          (10)             -           48           (48)
       (3) Other                                                    247          239            8            661          594            67
       (4) Total Revenues                                         3,641        3,364          277          9,723        8,821           902
           Expenses
       (5) Fuel                                                     327          344          (17)           887          929           (42)
       (6) Purchased power                                        1,168          973          195          2,914        2,377           537
       (7) Other operating expenses                                 756          748            8          2,255        2,180            75
       (8) FE Facilities                                              -           10          (10)             -           50           (50)
       (9) Provision for depreciation                               162          153            9            477          445            32
      (10) Amortization of regulatory assets                        288          243           45            785          665           120
      (11) Deferral of new regulatory assets                       (107)        (153)          46           (399)        (379)          (20)
      (12) General taxes                                            197          187           10            589          553            36
      (13) Total Expenses                                         2,791        2,505          286          7,508        6,820           688
      (14) Operating Income                                        850          859            (9)         2,215        2,001           214
             Other Income (Expense)
      (15)     Investment income                                     30           46          (16)            93          120           (27)
      (16)     Interest expense                                    (203)        (185)         (18)          (593)        (528)          (65)
      (17)     Capitalized interest                                   9            7            2             21           21             -
      (18)     Subsidiaries' preferred stock dividends                -           (2)           2              -           (6)            6
      (19)                                                         (164)        (134)         (30)          (479)        (393)          (86)
             Total Other Income (Expense)
      (20) Income From Continuing Operations
                                                                   686          725           (39)         1,736        1,608           128
             Before Income Taxes
      (21) Income taxes                                            273          273             -            695          625            70
      (22) Income From Continuing Operations                       413          452           (39)         1,041          983            58
      (23) Discontinued operations                                   -            2            (2)             -           (4)            4
      (24) Net Income                                       $      413     $    454     $     (41)   $     1,041    $     979     $      62

           Basic Earnings Per Common Share:
      (25) Income from continuing operations                $      1.36    $    1.40    $   (0.04)   $      3.39    $     3.00    $    0.39
      (26) Discontinued operations                                    -         0.01        (0.01)             -         (0.01)        0.01
      (27) Basic Earnings Per Common Share                  $      1.36    $    1.41    $   (0.05)   $      3.39    $     2.99    $    0.40
      (28) Weighted Average Number of
                                                                                                                                        (19)
                                                                   304          322           (18)          307           326
           Basic Shares Outstanding

           Diluted Earnings Per Common Share:
      (29) Income from continuing operations                $      1.34    $    1.39    $   (0.05)   $      3.35    $     2.98    $    0.37
      (30) Discontinued operations                                    -         0.01        (0.01)             -         (0.01)        0.01
      (31) Diluted Earnings Per Common Share                $      1.34    $    1.40    $   (0.06)   $      3.35    $     2.97    $    0.38
      (32) Weighted Average Number of
                                                                   307          325           (18)          311           329           (18)
           Diluted Shares Outstanding


______________________________________________________________________________________________________
Consolidated Report to the Financial Community – 3rd Quarter 2007                             3
FirstEnergy Corp.
                                                              Consolidated Income Segments
                                                                               (Unaudited)
                                                                               (In millions)

                                                                                       Three Months Ended September 30, 2007

                                                                                               Ohio
                                                      Energy            Competitive         Transitional
                                                                          Energy                                                     Reconciling
                                                     Delivery                               Generation
                                                                        Services (b)                                                 Adjustments
                                                    Services (a)                            Services (c)           Other (d)                           Consolidated
        Revenues
 (1)     Electric sales                            $        2,340      $          338      $          716      $               -     $          -      $        3,394
 (2)     FE Facilities                                          -                   -                   -                      -                -                   -
 (3)     Other                                                180                  32                   7                      9               19                 247
 (4)     Internal revenues                                      -                 806                   -                      -             (806)                  -
 (5)                                                        2,520               1,176                 723                      9             (787)              3,641
        Total Revenues

        Expenses
  (6)    Fuel                                                   2                 325                   -                      -                -                 327
  (7)    Purchased power                                    1,114                 229                 631                      -             (806)              1,168
  (8)    Other operating expenses                             436                 264                  80                      3              (27)                756
  (9)    FE Facilities                                          -                   -                   -                      -                -                   -
 (10)    Provision for depreciation                           102                  51                   -                      1                8                 162
 (11)    Amortization of regulatory assets                    279                   -                   9                      -                -                 288
 (12)    Deferral of new regulatory assets                    (82)                  -                 (25)                     -                -                (107)
 (13)    General taxes                                        166                  26                   1                      1                3                 197
 (14)   Total Expenses                                      2,017                 895                 696                      5             (822)              2,791
 (15)   Operating Income                                      503                 281                   27                     4               35                850
        Other Income (Expense)
 (16)    Investment income                                     58                    5                   -                      1              (34)                30
 (17)    Interest expense                                    (120)                 (44)                  -                     (1)             (38)              (203)
 (18)    Capitalized interest                                   3                    5                   -                      -                1                  9
 (19)    Subsidiaries' preferred stock dividends                -                    -                   -                      -                -                  -
 (20)                                                         (59)                 (34)                  -                      -              (71)              (164)
        Total Other Income (Expense)
 (21)   Income From Continuing Operations
                                                              444                 247                  27                       4              (36)              686
          Before Income Taxes
 (22)     Income taxes                                        175                  99                  11                      (2)             (10)              273

 (23)                                                         269                 148                   16                     6               (26)              413
        Income From Continuing Operations
 (24)     Discontinued operations                               -                   -                    -                     -                 -                 -
 (25)   Net Income                                 $          269      $          148      $            16     $               6     $         (26)    $         413

(a) Consists of regulated transmission and distribution operations, including transition cost recovery, and provider of last resort generation service for
     FirstEnergy's Pennsylvania and New Jersey electric utility subsidiaries.
(b) Consists of unregulated generation and commodity operations, including competitive electric sales, and generation sales to affiliated electric utilities.
(c) Represents provider of last resort generation service by FirstEnergy's Ohio electric utility subsidiaries.
(d) Primarily consists of telecommunications services.


 ______________________________________________________________________________________________________
 Consolidated Report to the Financial Community – 3rd Quarter 2007                             4
FirstEnergy Corp.
                                                           Consolidated Income Segments
                                                                             (Unaudited)
                                                                             (In millions)

                                                                                         Three Months Ended September 30, 2006

                                                                                                 Ohio
                                                        Energy            Competitive         Transitional
                                                                            Energy                                                     Reconciling
                                                       Delivery                               Generation
                                                                          Services (b)                                                 Adjustments
                                                      Services (a)                            Services (c)           Other (d)                           Consolidated
        Revenues
  (1)    Electric sales                              $        2,120      $          313      $          682      $            -        $          -      $       3,115
  (2)    FE Facilities                                            -                   -                   -                  10                   -                 10
  (3)    Other                                                  186                  40                   8                  14                  (9)               239
  (4)    Internal revenues                                        -                 762                   -                   -                (762)                 -
        Total Revenues
  (5)                                                         2,306               1,115                 690                  24                (771)             3,364

      Expenses
  (6)  Fuel                                                       2                 342                   -                   -                   -                344
  (7)  Purchased power                                          958                 173                 604                   -                (762)               973
  (8)  Other operating expenses                                 468                 218                  76                   1                 (15)               748
  (9)  FE Facilities                                              -                   -                   -                  10                   -                 10
 (10) Provision for depreciation                                 97                  49                   -                   1                   6                153
 (11) Amortization of regulatory assets                         237                   -                   6                   -                   -                243
 (12) Deferral of new regulatory assets                        (107)                  -                 (46)                  -                   -               (153)
 (13) General taxes                                             157                  21                   5                  (1)                  5                187
 (14) Total Expenses                                          1,812                 803                 645                  11                (766)             2,505
 (15) Operating Income                                          494                 312                  45                  13                   (5)             859
        Other Income (Expense)
 (16)    Investment income                                       80                  18                    -                      -             (52)                46
 (17)    Interest expense                                      (109)                (52)                   -                     (2)            (22)              (185)
 (18)    Capitalized interest                                     4                   3                    -                      -               -                  7
 (19)    Subsidiaries' preferred stock dividends                 (2)                  -                    -                      -               -                 (2)
 (20)                                                           (27)                (31)                   -                     (2)            (74)              (134)
        Total Other Income (Expense)
 (21) Income From Continuing Operations
                                                                467                 281                  45                   11                (79)              725
        Before Income Taxes
 (22) Income taxes                                              187                 112                  18                  (14)               (30)              273
 (23) Income From Continuing Operations                         280                 169                  27                  25                 (49)              452
 (24) Discontinued operations                                     -                   -                   -                   2                   -                 2
 (25) Net Income                                     $          280      $          169      $           27      $           27        $        (49)     $        454

 (a) Consists of regulated transmission and distribution operations, including transition cost recovery, and provider of last resort generation service for
      FirstEnergy's Pennsylvania and New Jersey electric utility subsidiaries.
 (b) Consists of unregulated generation and commodity operations, including competitive electric sales, and generation sales to affiliated electric utilities.
 (c) Represents provider of last resort generation service by FirstEnergy's Ohio electric utility subsidiaries.
 (d) Consists of telecommunications services and non-core businesses divested in 2006 (Facilities Services Group and MYR).


______________________________________________________________________________________________________
Consolidated Report to the Financial Community – 3rd Quarter 2007                             5
FirstEnergy Corp.
                                                            Consolidated Income Segments
                                                                                (Unaudited)
                                                                                (In millions)

                                                                         Three Months Ended Sept. 30, 2007 vs. Three Months Ended Sept. 30, 2006

                                                                                                  Ohio
                                                         Energy              Competitive       Transitional
                                                                               Energy                                                   Reconciling
                                                        Delivery                               Generation
                                                                             Services (b)                                               Adjustments
                                                       Services (a)                            Services (c)           Other (d)                           Consolidated
        Revenues
  (1)    Electric sales                               $          220        $          25     $            34     $             -       $           -     $       279
  (2)    FE Facilities                                             -                    -                   -                 (10)                  -             (10)
  (3)    Other                                                    (6)                  (8)                 (1)                 (5)                 28               8
  (4)    Internal revenues                                         -                   44                   -                   -                 (44)              -
  (5)                                                            214                   61                  33                 (15)                (16)            277
        Total Revenues

      Expenses
  (6)  Fuel                                                        -                  (17)                  -                   -                   -             (17)
  (7)  Purchased power                                           156                   56                  27                   -                 (44)            195
  (8)  Other operating expenses                                  (32)                  46                   4                   2                 (12)              8
  (9)  FE Facilities                                               -                    -                   -                 (10)                  -             (10)
 (10) Provision for depreciation                                   5                    2                   -                   -                   2               9
 (11) Amortization of regulatory assets                           42                    -                   3                   -                   -              45
 (12) Deferral of new regulatory assets                           25                    -                  21                   -                   -              46
 (13) General taxes                                                9                    5                  (4)                  2                  (2)             10
 (14) Total Expenses                                             205                   92                  51                  (6)                (56)            286
 (15) Operating Income                                              9                 (31)                (18)                    (9)              40               (9)
        Other Income (Expense)
 (16)    Investment income                                        (22)                (13)                  -                     1                18              (16)
 (17)    Interest expense                                         (11)                  8                   -                     1               (16)             (18)
 (18)    Capitalized interest                                      (1)                  2                   -                     -                 1                2
 (19)    Subsidiaries' preferred stock dividends                    2                   -                   -                     -                 -                2
 (20)                                                             (32)                 (3)                  -                     2                 3              (30)
        Total Other Income (Expense)
 (21) Income From Continuing Operations
                                                                  (23)                (34)                (18)                    (7)              43              (39)
        Before Income Taxes
 (22)    Income taxes                                             (12)                (13)                 (7)                 12                  20                -
 (23) Income From Continuing Operations                           (11)                (21)                (11)                (19)                 23              (39)
 (24) Discontinued operations                                       -                   -                   -                  (2)                  -               (2)
 (25) Net Income                                      $           (11)      $         (21)    $           (11)    $           (21)      $          23     $        (41)

 (a) Consists of regulated transmission and distribution operations, including transition cost recovery, and provider of last resort generation service for
      FirstEnergy's Pennsylvania and New Jersey electric utility subsidiaries.
 (b) Consists of unregulated generation and commodity operations, including competitive electric sales, and generation sales to affiliated electric utilities.
 (c) Represents provider of last resort generation service by FirstEnergy's Ohio electric utility subsidiaries.
 (d) Consists of telecommunications services and non-core businesses divested in 2006 (Facilities Services Group and MYR).


______________________________________________________________________________________________________
Consolidated Report to the Financial Community – 3rd Quarter 2007                             6
FirstEnergy Corp.
                                                       Financial Statements
                                                                 (Unaudited)
                                                                 (In millions)

  Condensed Consolidated Balance Sheets
                                                                 As of                   As of
                                                            As of June 30,           As Dec. 31,
                                                                                        of Dec 31,
                                                               Sept. 30,
                                                                2007                     2006
                                                                 2007                    2006
  Assets
  Current Assets:
    Cash and cash equivalents                               $            30          $              90
    Receivables                                                       1,626                      1,267
    Other                                                               750                        726
  Total Current Assets                                                2,406                      2,083
  Property, Plant and Equipment                                      15,038                     14,667
  Investments                                                         3,665                      3,534
  Deferred Charges and Other Assets                                  10,544                     10,912
  Total Assets                                              $        31,653          $          31,196

  Liabilities and Capitalization
  Current Liabilities:
     Currently payable long-term debt                       $         2,265          $           1,867
     Short-term borrowings                                              573                      1,108
     Accounts payable                                                   760                        726
     Other                                                            1,780                      1,554
  Total Current Liabilities                                           5,378                      5,255
  Capitalization:
    Common stockholders' equity (a)                                   8,768                      9,035
    Long-term debt and other long-term obligations                    8,617                      8,535
  Total Capitalization                                               17,385                     17,570
  Noncurrent Liabilities                                              8,890                      8,371
  Total Liabilities and Capitalization                      $        31,653          $          31,196

(a) Reduction reflects $900 million common share repurchase in 2007.


  General Information                                           Three Months Ended Sept. 30,                 Nine Months Ended Sept. 30,


                                                                   2007                  2006                  2007              2006

  Debt and equity securities redemptions                     $          (176)    $         (1,185)       $        (1,565)   $       (1,700)
  New long-term debt issues                                  $           300     $            182        $         1,100    $        1,235
  Short-term debt increase/(decrease)                        $        (1,843)    $            111        $          (535)   $          482
  Capital expenditures                                       $          (430)    $           (251)       $        (1,127)   $         (990)


  Adjusted Capitalization (Including Off-Balance Sheet Items) - Rating Agency View
                                                                                       As of September 30,
                                                                   2007              % Total           2006                     % Total
  Total common equity                                       $         8,768                40%     $       9,208                      42%
  Preferred stock                                                         -                   -               80                        0%
  Long-term debt (a)                                                 10,478                48%             9,994                      46%
  Short-term debt                                                       573                  3%            1,213                        6%
  Off-balance sheet debt equivalents:
    Sale-leaseback net debt equivalents (b)                           2,032                   9%                  1,255                6%
  Total                                                     $        21,851                 100%         $       21,750              100%


(a) Includes amount due to be paid within one year and excludes JCP&L securitization debt of $404 million and $434 million in 2007
    and 2006, respectively.
(b) Associated with 1987 and 2007 sale and leaseback transactions.


______________________________________________________________________________________________________
Consolidated Report to the Financial Community – 3rd Quarter 2007                             7
FirstEnergy Corp.
                                                               Financial Statements
                                                                       (Unaudited)
                                                                       (In millions)

  Condensed Consolidated Statements of Cash Flows
                                                                                   Three Months Ended Sept. 30,                  Nine Months Ended Sept. 30,
                                                                                      2007            2006                          2007           2006
  Cash flows from operating activities:
  Net income                                                                       $            413       $            454      $       1,041           $         979
  Adjustments to reconcile net income to net cash from operating activities:
      Depreciation, amortization, and deferral of regulatory assets                          343                       244                863                      731
      Deferred purchased power and other costs                                               (80)                      (84)              (265)                    (323)
      Deferred income taxes and investment tax credits*                                     (243)                        4               (158)                      36
      Deferred rents and lease market valuation liability                                     51                        51                (41)                     (54)
      Electric service prepayment programs                                                   (16)                      (16)               (52)                     (45)
      Cash collateral, net                                                                   (31)                      (43)               (50)                     (98)
      Pension trust contribution                                                               -                         -               (300)                       -
      Change in working capital and other*                                                   583                       148                113                       17
                                                                                           1,020                       758              1,151                    1,243
  Cash flows provided from operating activities

                                                                                          (1,896)                    (1,062)            (1,442)                   (444)
  Cash flows used for financing activities

                                                                                                869                   (238)                  231                  (822)
  Cash flows provided from (used for) investing activities
                                                                                   $             (7)      $           (542)     $            (60)       $          (23)
  Net decrease in cash and cash equivalents

  * The Bruce Mansfield sale and leaseback transaction reduced deferred income taxes by $187 million and increased accrued taxes included in
    working capital changes by the same amount in the 2007 periods.


  Deferrals and Amortizations
                                                                Three Months Ended Sept. 30,                                    Nine Months Ended Sept. 30,
                                                             2007            2006          Change                            2007          2006          Change
  Ohio Regulatory Assets
                                                        $         1,826        $       1,882                            $      1,844     $          1,924
  Deferred Balance - Beginning
                                                                       -                   -                                        -
   Deferral of shopping incentives                                                                    $         -                                      3     $           (3)
   Interest on shopping incentives                                    9                  11                    (2)               28                   32                 (4)
   Deferral of MISO costs and interest                                7                   4                     3                45                   11                 34
   Deferral of RCP distribution reliability costs                    52                  40                    12               143                  121                 22
   Deferral of RCP fuel costs                                        21                  43                   (22)               62                   94                (32)
   Deferral of other regulatory assets                                6                   1                     5                17                    7                 10
                                                        $            95        $         99           $        (4)      $       295      $           268     $           27
  Current period deferrals
  Amortization
   Ohio transition costs amortization                   $           (83)       $         (77)         $        (6)      $       (222)    $           (211)   $          (11)
   Shopping incentives amortization                                 (34)                 (34)                   -                (94)                 (93)               (1)
   MISO costs amortization                                           (9)                  (5)                  (4)               (20)                 (15)               (5)
   Other                                                             (7)                  (8)                   1                (15)                 (16)                1
                                                        $          (133)       $        (124)         $        (9)      $       (351)    $           (335)   $          (16)
  Current period amortization

                                                        $         1,788        $       1,857                            $      1,788     $          1,857
  Deferred Balance - Ending
  Pennsylvania Deferred PJM Costs
                                                        $           216        $         57                             $       157      $             -
  Beginning Balance
      Deferrals                                                      13                  54           $       (41)               81                  111     $          (30)
                                                                                           -                                                            -
      Interest                                                        1                                         1                 3                                       3
                                                                                           -                                                            -
      Amortizations                                                  (3)                                       (3)              (14)                                    (14)
                                                        $           227        $        111                             $       227      $           111
  Ending Balance

  New Jersey Deferred Energy Costs
                                                        $           392        $         638                            $       369      $            541
  Beginning Balance
                                                                                                      $       236                                            $          162
   Deferral of energy costs                                         (62)                (298)                                   (39)                 (201)
                                                        $           330        $         340                            $       330      $            340
  Ending Balance


______________________________________________________________________________________________________
Consolidated Report to the Financial Community – 3rd Quarter 2007                             8
FirstEnergy Corp.
                                                         Statistical Summary
                                                               (Unaudited)
  ELECTRIC SALES STATISTICS                          Three Months Ended September 30,                 Nine Months Ended September 30,
  (in millions of kWhs)                              2007          2006       Change                  2007         2006        Change
  Electric Generation Sales
  Retail - Regulated                                  25,659          26,281             -2.4%         73,653         72,878            1.1%
  Retail - Competitive                                 3,449           3,442              0.2%          9,940          8,901           11.7%
         Total Retail                                 29,108          29,723             -2.1%         83,593         81,779            2.2%
  Wholesale                                            6,148           5,296             16.1%         17,571         17,279            1.7%
  Total Electric Generation Sales                     35,256          35,019              0.7%        101,164         99,058            2.1%
  Electric Distribution Deliveries
  Ohio               - Residential                     4,676           4,642              0.7%           13,342       12,666            5.3%
                     - Commercial                      4,028           3,985              1.1%           11,497       11,145            3.2%
                     - Industrial                      6,073           6,111             -0.6%           17,661       17,673           -0.1%
                     - Other                              93              95             -2.1%              278          280           -0.7%
                     Total Ohio                       14,870          14,833              0.2%           42,778       41,764            2.4%
  Pennsylvania        - Residential                    2,987           2,987                 -            8,855        8,444            4.9%
                      - Commercial                     2,997           2,930              2.3%            8,499        8,182            3.9%
                      - Industrial                     2,622           2,671             -1.8%            7,730        7,845           -1.5%
                      - Other                             20              20                 -               61           62           -1.6%
                      Total Pennsylvania               8,626           8,608              0.2%           25,145       24,533            2.5%
  New Jersey          - Residential                    2,878           3,092             -6.9%            7,617        7,447            2.3%
                      - Commercial                     2,732           2,708              0.9%            7,444        7,204            3.3%
                      - Industrial                       739             749             -1.3%            2,166        2,142            1.1%
                      - Other                             23              22              4.5%               66           65            1.5%
                      Total New Jersey                 6,372           6,571             -3.0%           17,293       16,858            2.6%
  Total Residential                                   10,541          10,721             -1.7%           29,814       28,557            4.4%
  Total Commercial                                     9,757           9,623              1.4%           27,440       26,531            3.4%
  Total Industrial                                     9,434           9,531             -1.0%           27,557       27,660           -0.4%
  Total Other                                            136             137             -0.7%              405          407           -0.5%
  Total Distribution Deliveries                       29,868          30,012             -0.5%           85,216       83,155            2.5%
  Electric Sales Shopped
  Ohio              - Residential                        635             672             -5.5%             1,687       1,766           -4.5%
                    - Commercial                         957           1,045             -8.4%             2,712       2,910           -6.8%
                    - Industrial                         719             761             -5.5%             2,048       2,204           -7.1%
                    Total Ohio                         2,311           2,478             -6.7%             6,447       6,880           -6.3%
  Pennsylvania        - Residential                       33                -             -                   44           1               -
                      - Commercial                       182              143         27.3%                  446           1               -
                      - Industrial                       513                -             -                1,389         368          277.5%
                      Total Pennsylvania                 728              143        409.1%                1,879         370          407.7%
  New Jersey          - Residential                        -               -                -                  -           -               -
                      - Commercial                       603             555             8.6%              1,598       1,449           10.3%
                      - Industrial                       567             555             2.2%              1,641       1,578            4.0%
                      Total New Jersey                 1,170           1,110             5.4%              3,239       3,027            7.0%
  Total Electric Sales Shopped                         4,209           3,731             12.8%           11,565       10,277           12.5%


  Operating Statistics
                                           Three Months Ended Sept. 30,                          Nine Months Ended Sept. 30,
                                             2007              2006                                2007              2006
  Capacity Factors:
           Fossil - Baseload                 85%               86%                                 80%               90%
           Fossil - Load Following           71%               72%                                 73%               69%
           Peaking                           4%                4%                                   2%               1%
           Nuclear                           89%               97%                                 89%               88%
  Generation Output:
           Fossil - Baseload                 40%               39%                                 39%               42%
           Fossil - Load Following           22%               22%                                 23%               22%
           Peaking                           1%                1%                                   0%               0%
           Nuclear                           37%               38%                                 38%               36%
                                                Three Months Ended Sept. 30,                           Nine Months Ended Sept. 30,
  Weather                                    2007              2006             Normal             2007              2006            Normal
  Composite Heating-Degree-Days               57                92               100               3,619             3,183            3,557
  Composite Cooling-Degree-Days              683               678               647                969               885              906


______________________________________________________________________________________________________
Consolidated Report to the Financial Community – 3rd Quarter 2007                             9
FirstEnergy Corp.
                                                          2007 EPS Reconciliations
                                                                       (Unaudited)
                                                   (In millions, except for per share amounts)


  Special Items
                                                                        Three Months Ended Sept. 30,                         Nine Months Ended Sept. 30,
                                                                         2007                         2006                    2007                     2006
  Pre-tax Items - Income Increase (Decrease)
  Gain (Loss) on Non-Core Asset Sales of:
       Loss on sale on MYR 60% interest (a)                        $                  -         $               -       $               -      $               (5)
       Gain on sale of First Communications (h)                                  21                             -                    21                         -
       All other (a)(f)                                                               -                         -                       -                       6
  Total Gain on Non-Core Asset Sales                                             21                             -                    21                         1
  Saxton decommissioning costs regulatory assets (b)                                  -                         -                    27                         -
  Trust securities impairment (c)                                                    (4)                        -                    (16)                       -
  FE Facilities sales/impairment (d)(e)(g)                                            -                       (1)                       -                     (13)
  PA NUG purchased power adjustment applicable to 2005 (i)                            -                      (10)                       -                     (10)
                                                                   $             17               $          (11)       $            32         $             (22)
       Total-Pretax Items

  EPS Effect                                                       $            0.04              $       (0.01)        $         0.06          $         (0.05)
   (a) Included in quot;Other operating expensesquot;                                              (f) Before first quarter 2006 tax benefit of $2.5 million
   (b) Included in quot;Deferral of new regulatory assetsquot;                                     (g) Non-tax deductible
   (c) Included in quot;Investment incomequot;                                                     (h) Located in quot;Other Revenuequot;
   (d) Included in quot;FE Facilities expensesquot;                                                (i) Located in quot;Purchased Powerquot;
   (e) Included in quot;Discontinued Operationsquot;


                                                 2007 Earnings Per Share (EPS)
                                             (Reconciliation of GAAP to Non-GAAP)

                                                                   ACTUAL                           ACTUAL                  Non-GAAP
                                                              Three Months                    Nine Months               Guidance For
                                                              Ended Sept. 30                 Ended Sept. 30                 Year 2007

  Basic EPS (GAAP basis)                                       $           1.36               $          3.39            $4.21 - $4.31
  Excluding Special Items:
    New regulatory asset authorized by PPUC                                      -                      (0.05)                    (0.05)
    Gain on sale of non-core assets                                        (0.04)                       (0.04)                    (0.04)
    Trust securities impairment                                                  -                       0.03                        0.03
  Basic EPS (Non-GAAP basis)                                   $           1.32               $          3.33            $4.15 - $4.25


______________________________________________________________________________________________________
Consolidated Report to the Financial Community – 3rd Quarter 2007                             10
RECENT DEVELOPMENTS
Ohio Senate Bill 221 – Energy Plan Proposal
On September 25, 2007, Ohio Governor Strickland’s proposed energy plan for the State of Ohio was introduced as
Senate Bill 221. The principles of the proposed bill are similar to those outlined in the Governor’s “Energy, Jobs, and
Progress for Ohio” plan announced on August 29. The bill seeks to revise state energy policy to address electric
service price regulation (market rate option or electric security plan), establish energy efficiency standards, adopt
advanced energy portfolio standards (advanced energy technologies to provide 25% of standard service offer
generation supply by 2025, with at least one-half coming from renewables), and create greenhouse gas emission
reporting and carbon-control planning requirements.

Senate Bill 221 was referred to the Senate Energy & Public Utilities Committee, which has been conducting hearings
on the bill with testimony from interested parties. These include the Governor’s Energy Advisor, the Chairman of the
Public Utilities Commission of Ohio (PUCO), consumer groups, and utility executives among others. On October 4,
FirstEnergy CEO Tony Alexander provided testimony to the Committee, citing several concerns with the current
version of the bill, including its lack of context and clarity in establishing generation prices. He recommended that the
PUCO be provided clear statutory authority to negotiate rate plans and, in the event that negotiations do not result in
rate plan agreements, that a competitive bid process be used to establish generation prices for customers who do not
choose alternative suppliers. He also proposed that the PUCO’s statutory authority include the flexibility to address
recovery for societal programs such as energy efficiency, demand response, renewable power, and infrastructure
improvements. Several proposed amendments to the bill have been submitted, including those from Ohio's investor-
owned electric utilities. A substitute version of the bill, which incorporated certain of the proposed amendments, was
introduced into the Senate Energy & Public Utilities Committee on October 25.

Ohio Competitive Generation Supply Plan Filing
On August 16, 2007, the PUCO held a technical conference for interested parties to gain a better understanding of the
competitive generation supply plan filed with the PUCO by FirstEnergy subsidiaries Ohio Edison Company (OE), The
Cleveland Electric Illuminating Company (CEI), and The Toledo Edison Company (TE) (collectively Ohio Companies)
on July 10. The proposal seeks approval to conduct a competitive bidding process to provide generation service,
beginning January 1, 2009, to customers who choose not to purchase electricity from an alternative supplier.
Intervening parties filed their initial comments on the proposal on September 5, while the PUCO Staff filed its
comments on September 21. Parties then filed reply comments on October 12. The proposal is pending before the
PUCO.

Ohio Supreme Court Remand on Rate Certainty Plan
On August 29, 2007, the Supreme Court of Ohio upheld rulings by the PUCO approving several provisions of the Ohio
Companies’ Rate Certainty Plan. However, the Court remanded the portion of the order authorizing the Ohio
Companies to collect deferred fuel costs through distribution rates back to the PUCO for further consideration. Under
the Court’s interpretation, recovery of generation service costs through distribution rates would be unlawful. The Court
didn’t dispute the Commission’s authority to allow recovery of the deferred fuel costs, just the recovery mechanism.
The PUCO’s order authorized the Ohio Companies to defer increased fuel costs incurred from January 1, 2006, through
December 31, 2008, including interest on the deferred balances, and to recover these deferred costs over a 25-year
period beginning in 2009. On September 7, 2007, the Ohio Companies filed a motion for reconsideration with the
Court to contest its interpretation. The Court has not yet issued an order. Separately, on September 10, the Ohio
Companies filed an application on remand with the PUCO proposing that the increased fuel costs be recovered via two
generation-related fuel cost recovery riders during the period of October 2007 through December 2008. This matter is
pending before the PUCO.

Ohio Companies’ Green Option for Customers Update
On August 15, 2007, the PUCO approved a stipulation that creates a green pricing option for FirstEnergy’s Ohio
Companies’ customers and resolves the remand from the Supreme Court of Ohio related to the Rate Stabilization Plan.
The stipulation was filed on May 29 by FirstEnergy’s Ohio Companies, the PUCO Staff, and the Office of the Ohio
Consumers’ Counsel. The Green Resource Program enables customers to support the development of alternative
energy resources through voluntary purchases of Renewable Energy Certificates (RECs). The Ohio Companies
acquired the right to purchase the RECs on behalf of participating customers through a PUCO-monitored competitive
process.

Consolidated Report to the Financial Community –3rd Quarter 2007                                               11
Penn Power Default Service Plan Update
On September 28, 2007, a Joint Petition for Settlement was filed with the Pennsylvania Public Utility Commission
(PPUC) for approval of Pennsylvania Power Company’s (Penn Power’s) Interim Default Service Supply Plan for the
three-year period covering June 1, 2008, through May 31, 2011. For customers who choose not to shop, the Plan
provides for Penn Power to obtain market-based generation supply via a Request for Proposal (RFP) by rate class for
residential and commercial customers, with industrial customers being supplied through short-term markets. The
settlement agreement resolves all issues in the proceeding, except those regarding incremental uncollectible accounts
expense, and is either supported, or not opposed, by all parties. On September 11, a PPUC hearing was held on the
uncollectible expense issue. An Administrative Law Judge recommended decision is expected shortly with a PPUC
Order expected on or about November 29, 2007.

Met-Ed and Penelec Commonwealth Court Appeals Update
On September 21 and October 5, 2007, response and reply briefs, respectively, were filed by the parties in the appeal of
the PPUC’s January 2007 transition rate plan order to the Pennsylvania Commonwealth Court. Metropolitan Edison
Company (Met-Ed) and Pennsylvania Electric Company (Penelec) have appealed the PPUC’s decision on the denial of
generation rate relief and on a consolidated income tax adjustment related to cost of capital, while other parties
appealed the PPUC’s decision on transmission rate relief. Oral arguments are expected to take place in late 2007 or
early 2008.

Penelec Debt Offering
On August 30, 2007, Penelec issued $300 million of 6.05% Senior Unsecured Notes due 2017. Proceeds from the
transaction were used to repay short-term borrowings and to repurchase Penelec common stock from FirstEnergy Corp.

Transfer of Pollution Control Revenue Bonds
On October 4, 2007, FirstEnergy Solutions Corp.’s generation company subsidiaries (GenCos) closed on the issuance
of $427 million of pollution control revenue bonds (PCRBs). Proceeds from the issuance will be used to redeem,
during the fourth quarter, an equal amount of outstanding PCRBs originally issued on behalf of the Ohio Companies.
This transaction brings the total amount of PCRBs transferred from the Ohio Companies and Penn Power to the
GenCos to approximately $1.9 billion, with approximately $265 million remaining to be transferred. The transfer of
these PCRBs supports the intra-system generation asset transfer that was completed in 2005.

Nuclear Update
On August 21, 2007, FirstEnergy Nuclear Operating Company (FENOC) announced plans to expand used nuclear fuel
storage capacity at the Perry Nuclear Power Plant. The plan calls for installing above-ground, airtight steel and
concrete cylindrical canisters, cooled by natural air circulation, to store used fuel assemblies. Initially, six canisters
will be installed, with the capability to add up to 74 canisters as needed. Construction of the new fuel storage system,
which is expected to cost approximately $30 million, is scheduled to begin in the spring of 2008, with completion
planned for 2010.

On October 24, the 911-megawatt Beaver Valley Unit 1 returned to service following completion of its regularly
scheduled refueling outage that began on September 24.

In late August, FENOC filed an application with the Nuclear Regulatory Commission (NRC) seeking renewal of the
operating licenses for Beaver Valley Units 1 & 2 for an additional 20 years, which would extend the operating licenses
to January 29, 2036, for Unit 1; and May 27, 2047, for Unit 2. The NRC accepted the application for review on
October 24.

Economic Development Award
For the fourth time in the last five years, Site Selection magazine has selected FirstEnergy as one of the top utilities in
the country for helping to promote economic development in its service area. The award is based upon economic
development in four categories in 2006 – capital investment, job creation, capital investment per capita, and jobs per
10,000 in population – and gauges the ability of utility companies to help foster corporate investment in their service
areas. FirstEnergy’s work with state and local development agencies helped attract more than $1.6 billion in capital
investment and helped create nearly 11,500 new jobs throughout Ohio, Pennsylvania and New Jersey in 2006.


Consolidated Report to the Financial Community –3rd Quarter 2007                                               12
Forward-Looking Statements: This Consolidated Report to the Financial Community includes forward-looking statements based on
information currently available to management. Such statements are subject to certain risks and uncertainties. These statements include
declarations regarding our, or our management’s, intents, beliefs and current expectations. These statements typically contain, but are not
limited to, the terms “anticipate,” “potential,” “expect,” “believe,” “estimate” and similar words. Forward-looking statements involve
estimates, assumptions, known and unknown risks, uncertainties and other factors that may cause our actual results, performance or
achievements to be materially different from any future results, performance or achievement expressed or implied by such forward-looking
statements. Actual results may differ materially due to the speed and nature of increased competition in the electric utility industry and
legislative and regulatory changes affecting how generation rates will be determined following the expiration of existing rate plans in Ohio
and Pennsylvania, economic or weather conditions affecting future sales and margins, changes in markets for energy services, changing
energy and commodity market prices, replacement power costs being higher than anticipated or inadequately hedged, the continued ability
of FirstEnergy’s regulated utilities to collect transition and other charges or to recover increased transmission costs, maintenance costs
being higher than anticipated, other legislative and regulatory changes including revised environmental requirements, the uncertainty of the
timing and amounts of the capital expenditures needed to, among other things, implement the Air Quality Compliance Plan (including that
such amounts could be higher than anticipated) or levels of emission reductions related to the Consent Decree resolving the New Source
Review litigation or other potential regulatory initiatives, adverse regulatory or legal decisions and outcomes (including, but not limited to,
the revocation of necessary licenses or operating permits and oversight by the Nuclear Regulatory Commission including, but not limited
to, the Demand for Information issued to FENOC on May 14, 2007) as disclosed in our SEC filings, the timing and outcome of various
proceedings before the PUCO (including, but not limited to, the Distribution Rate Cases and the generation supply plan filing for the Ohio
Companies and the successful resolution of the issues remanded to the PUCO by the Supreme Court of Ohio regarding the Rate
Stabilization Plan and the Rate Certainty Plan, including the deferral of fuel costs) and the PPUC (including the resolution of the Petitions
for Review filed with the Commonwealth Court of Pennsylvania with respect to the transition rate plan for Met-Ed and Penelec), the
continuing availability of generating units and their ability to continue to operate at or near full capacity, the ability to comply with
applicable state and federal reliability standards, the inability to accomplish or realize anticipated benefits from strategic goals (including
employee workforce initiatives), the ability to improve electric commodity margins and to experience growth in the distribution business,
the ability to access the public securities and other capital markets and the cost of such capital, the outcome, cost and other effects of
present and potential legal and administrative proceedings and claims related to the August 14, 2003 regional power outage, the risks and
other factors discussed from time to time in our SEC filings, and other similar factors. The foregoing review of factors should not be
construed as exhaustive. New factors emerge from time to time, and it is not possible for us to predict all such factors, nor can we assess
the impact of any such factor on our business or the extent to which any factor, or combination of factors, may cause results to differ
materially from those contained in any forward-looking statements. We expressly disclaim any current intention to update any forward-
looking statements contained herein as a result of new information, future events, or otherwise.


Consolidated Report to the Financial Community –3rd Quarter 2007                                                                  13

More Related Content

What's hot

aetna table 2006 2nd
aetna table 2006 2ndaetna table 2006 2nd
aetna table 2006 2ndfinance9
 
danaher 07_2Q_Release
danaher 07_2Q_Releasedanaher 07_2Q_Release
danaher 07_2Q_Releasefinance24
 
aetna table 2005 3rd
aetna table 2005 3rdaetna table 2005 3rd
aetna table 2005 3rdfinance9
 
energy east Q12007ER
energy east Q12007ERenergy east Q12007ER
energy east Q12007ERfinance40
 
aetna table 2005 4th
aetna table 2005 4thaetna table 2005 4th
aetna table 2005 4thfinance9
 
danaher 07_3Q_Release
danaher 07_3Q_Releasedanaher 07_3Q_Release
danaher 07_3Q_Releasefinance24
 
bnsf 2Q 2008 investors Report
bnsf 2Q 2008 investors Reportbnsf 2Q 2008 investors Report
bnsf 2Q 2008 investors Reportfinance16
 
energy east 2Q08_EAS_release
energy east 2Q08_EAS_releaseenergy east 2Q08_EAS_release
energy east 2Q08_EAS_releasefinance40
 

What's hot (9)

aetna table 2006 2nd
aetna table 2006 2ndaetna table 2006 2nd
aetna table 2006 2nd
 
danaher 07_2Q_Release
danaher 07_2Q_Releasedanaher 07_2Q_Release
danaher 07_2Q_Release
 
aetna table 2005 3rd
aetna table 2005 3rdaetna table 2005 3rd
aetna table 2005 3rd
 
EAS_Q407_ER
EAS_Q407_EREAS_Q407_ER
EAS_Q407_ER
 
energy east Q12007ER
energy east Q12007ERenergy east Q12007ER
energy east Q12007ER
 
aetna table 2005 4th
aetna table 2005 4thaetna table 2005 4th
aetna table 2005 4th
 
danaher 07_3Q_Release
danaher 07_3Q_Releasedanaher 07_3Q_Release
danaher 07_3Q_Release
 
bnsf 2Q 2008 investors Report
bnsf 2Q 2008 investors Reportbnsf 2Q 2008 investors Report
bnsf 2Q 2008 investors Report
 
energy east 2Q08_EAS_release
energy east 2Q08_EAS_releaseenergy east 2Q08_EAS_release
energy east 2Q08_EAS_release
 

Viewers also liked

first energy
first energy first energy
first energy finance21
 
ConAgra%20Foods%20Q1%20FY09%20Q&A
ConAgra%20Foods%20Q1%20FY09%20Q&AConAgra%20Foods%20Q1%20FY09%20Q&A
ConAgra%20Foods%20Q1%20FY09%20Q&Afinance21
 
first energy AnnualAnalystMtg2-01-07
first energy AnnualAnalystMtg2-01-07first energy AnnualAnalystMtg2-01-07
first energy AnnualAnalystMtg2-01-07finance21
 
first energy AnalystMtg_120607
first energy AnalystMtg_120607first energy AnalystMtg_120607
first energy AnalystMtg_120607finance21
 
williams 1Q 2008
williams 1Q 2008williams 1Q 2008
williams 1Q 2008finance21
 
SHW_JPMorgan_060408
SHW_JPMorgan_060408SHW_JPMorgan_060408
SHW_JPMorgan_060408finance21
 

Viewers also liked (6)

first energy
first energy first energy
first energy
 
ConAgra%20Foods%20Q1%20FY09%20Q&A
ConAgra%20Foods%20Q1%20FY09%20Q&AConAgra%20Foods%20Q1%20FY09%20Q&A
ConAgra%20Foods%20Q1%20FY09%20Q&A
 
first energy AnnualAnalystMtg2-01-07
first energy AnnualAnalystMtg2-01-07first energy AnnualAnalystMtg2-01-07
first energy AnnualAnalystMtg2-01-07
 
first energy AnalystMtg_120607
first energy AnalystMtg_120607first energy AnalystMtg_120607
first energy AnalystMtg_120607
 
williams 1Q 2008
williams 1Q 2008williams 1Q 2008
williams 1Q 2008
 
SHW_JPMorgan_060408
SHW_JPMorgan_060408SHW_JPMorgan_060408
SHW_JPMorgan_060408
 

Similar to first energy 3Q 2007

first energy 4Q 07
first energy 4Q 07first energy 4Q 07
first energy 4Q 07finance21
 
first energy 2q 07
first energy 2q 07first energy 2q 07
first energy 2q 07finance21
 
first energy 3Q 08 Consolidated Finan Community
first energy 3Q 08 Consolidated Finan Communityfirst energy 3Q 08 Consolidated Finan Community
first energy 3Q 08 Consolidated Finan Communityfinance21
 
first energy 1q 07 consolidated
first energy 1q 07 consolidatedfirst energy 1q 07 consolidated
first energy 1q 07 consolidatedfinance21
 
first energy NEW8/08
first energy NEW8/08first energy NEW8/08
first energy NEW8/08finance21
 
first energy 1Q/08N
first energy 1Q/08Nfirst energy 1Q/08N
first energy 1Q/08Nfinance21
 
first energy 3Q 06
first energy 3Q 06first energy 3Q 06
first energy 3Q 06finance21
 
first energy 4Q06 Consolidated Report to the Financial_Community
first energy 4Q06 Consolidated Report to the Financial_Communityfirst energy 4Q06 Consolidated Report to the Financial_Community
first energy 4Q06 Consolidated Report to the Financial_Communityfinance21
 
xcel energy C5D23DB6-FFE8-47B3-9F6C-CCCE26FC3192_Q408_Presentation
xcel energy  C5D23DB6-FFE8-47B3-9F6C-CCCE26FC3192_Q408_Presentationxcel energy  C5D23DB6-FFE8-47B3-9F6C-CCCE26FC3192_Q408_Presentation
xcel energy C5D23DB6-FFE8-47B3-9F6C-CCCE26FC3192_Q408_Presentationfinance26
 
xcel energy C5D23DB6-FFE8-47B3-9F6C-CCCE26FC3192_Q408_Presentation
xcel energy  C5D23DB6-FFE8-47B3-9F6C-CCCE26FC3192_Q408_Presentationxcel energy  C5D23DB6-FFE8-47B3-9F6C-CCCE26FC3192_Q408_Presentation
xcel energy C5D23DB6-FFE8-47B3-9F6C-CCCE26FC3192_Q408_Presentationfinance26
 
tribune earnings_q2_06_tables
tribune  earnings_q2_06_tablestribune  earnings_q2_06_tables
tribune earnings_q2_06_tablesfinance47
 
tribune earnings_q3_06_tables
tribune  earnings_q3_06_tablestribune  earnings_q3_06_tables
tribune earnings_q3_06_tablesfinance47
 

Similar to first energy 3Q 2007 (20)

first energy 4Q 07
first energy 4Q 07first energy 4Q 07
first energy 4Q 07
 
first energy 2q 07
first energy 2q 07first energy 2q 07
first energy 2q 07
 
first energy 3Q 08 Consolidated Finan Community
first energy 3Q 08 Consolidated Finan Communityfirst energy 3Q 08 Consolidated Finan Community
first energy 3Q 08 Consolidated Finan Community
 
first energy 1q 07 consolidated
first energy 1q 07 consolidatedfirst energy 1q 07 consolidated
first energy 1q 07 consolidated
 
first energy NEW8/08
first energy NEW8/08first energy NEW8/08
first energy NEW8/08
 
first energy 1Q/08N
first energy 1Q/08Nfirst energy 1Q/08N
first energy 1Q/08N
 
first energy 3Q 06
first energy 3Q 06first energy 3Q 06
first energy 3Q 06
 
first energy 4Q06 Consolidated Report to the Financial_Community
first energy 4Q06 Consolidated Report to the Financial_Communityfirst energy 4Q06 Consolidated Report to the Financial_Community
first energy 4Q06 Consolidated Report to the Financial_Community
 
xcel energy C5D23DB6-FFE8-47B3-9F6C-CCCE26FC3192_Q408_Presentation
xcel energy  C5D23DB6-FFE8-47B3-9F6C-CCCE26FC3192_Q408_Presentationxcel energy  C5D23DB6-FFE8-47B3-9F6C-CCCE26FC3192_Q408_Presentation
xcel energy C5D23DB6-FFE8-47B3-9F6C-CCCE26FC3192_Q408_Presentation
 
xcel energy C5D23DB6-FFE8-47B3-9F6C-CCCE26FC3192_Q408_Presentation
xcel energy  C5D23DB6-FFE8-47B3-9F6C-CCCE26FC3192_Q408_Presentationxcel energy  C5D23DB6-FFE8-47B3-9F6C-CCCE26FC3192_Q408_Presentation
xcel energy C5D23DB6-FFE8-47B3-9F6C-CCCE26FC3192_Q408_Presentation
 
dte_2q1999
dte_2q1999dte_2q1999
dte_2q1999
 
dte_2q1999
dte_2q1999dte_2q1999
dte_2q1999
 
tribune earnings_q2_06_tables
tribune  earnings_q2_06_tablestribune  earnings_q2_06_tables
tribune earnings_q2_06_tables
 
dte_4q1999
dte_4q1999dte_4q1999
dte_4q1999
 
dte_4q1999
dte_4q1999dte_4q1999
dte_4q1999
 
tribune earnings_q3_06_tables
tribune  earnings_q3_06_tablestribune  earnings_q3_06_tables
tribune earnings_q3_06_tables
 
dte_3q1999
dte_3q1999dte_3q1999
dte_3q1999
 
dte_3q1999
dte_3q1999dte_3q1999
dte_3q1999
 
dte_1q1999
dte_1q1999dte_1q1999
dte_1q1999
 
dte_1q1999
dte_1q1999dte_1q1999
dte_1q1999
 

More from finance21

ConAgra June92003Q&A
ConAgra June92003Q&AConAgra June92003Q&A
ConAgra June92003Q&Afinance21
 
ConAgraFY04Q1
ConAgraFY04Q1ConAgraFY04Q1
ConAgraFY04Q1finance21
 
ConAgra UAP10-03
ConAgra UAP10-03ConAgra UAP10-03
ConAgra UAP10-03finance21
 
ConAgra DealClosing11-03
ConAgra DealClosing11-03ConAgra DealClosing11-03
ConAgra DealClosing11-03finance21
 
ConAgra DealClosingb11-03
ConAgra DealClosingb11-03ConAgra DealClosingb11-03
ConAgra DealClosingb11-03finance21
 
SharePurchase12-03
SharePurchase12-03SharePurchase12-03
SharePurchase12-03finance21
 
ConAgra Q2Dec03
ConAgra Q2Dec03ConAgra Q2Dec03
ConAgra Q2Dec03finance21
 
ConAgra Q3Mar04
ConAgra Q3Mar04ConAgra Q3Mar04
ConAgra Q3Mar04finance21
 
ConAgra Q4Jul04
ConAgra Q4Jul04ConAgra Q4Jul04
ConAgra Q4Jul04finance21
 
ConAgra Q1Sept22-04
ConAgra Q1Sept22-04ConAgra Q1Sept22-04
ConAgra Q1Sept22-04finance21
 
ConAgra Q2Dec04
ConAgra Q2Dec04ConAgra Q2Dec04
ConAgra Q2Dec04finance21
 
ConAgra Q4Jun05
ConAgra Q4Jun05ConAgra Q4Jun05
ConAgra Q4Jun05finance21
 
ConAgra QAFY06Q1
ConAgra QAFY06Q1ConAgra QAFY06Q1
ConAgra QAFY06Q1finance21
 
ConAgra QAFY06Q2
ConAgra QAFY06Q2ConAgra QAFY06Q2
ConAgra QAFY06Q2finance21
 
ConAgra QAFY06Q3
ConAgra QAFY06Q3ConAgra QAFY06Q3
ConAgra QAFY06Q3finance21
 
ConAgra QAFY06Q4
ConAgra QAFY06Q4ConAgra QAFY06Q4
ConAgra QAFY06Q4finance21
 
ConAgra QAFY07Q1
ConAgra QAFY07Q1ConAgra QAFY07Q1
ConAgra QAFY07Q1finance21
 
ConAgra QAFY07Q2
ConAgra QAFY07Q2ConAgra QAFY07Q2
ConAgra QAFY07Q2finance21
 
ConAgra QAFY07Q3
ConAgra QAFY07Q3ConAgra QAFY07Q3
ConAgra QAFY07Q3finance21
 

More from finance21 (20)

ConAgra June92003Q&A
ConAgra June92003Q&AConAgra June92003Q&A
ConAgra June92003Q&A
 
ConAgraFY04Q1
ConAgraFY04Q1ConAgraFY04Q1
ConAgraFY04Q1
 
ConAgra UAP10-03
ConAgra UAP10-03ConAgra UAP10-03
ConAgra UAP10-03
 
ConAgra DealClosing11-03
ConAgra DealClosing11-03ConAgra DealClosing11-03
ConAgra DealClosing11-03
 
ConAgra DealClosingb11-03
ConAgra DealClosingb11-03ConAgra DealClosingb11-03
ConAgra DealClosingb11-03
 
SharePurchase12-03
SharePurchase12-03SharePurchase12-03
SharePurchase12-03
 
ConAgra Q2Dec03
ConAgra Q2Dec03ConAgra Q2Dec03
ConAgra Q2Dec03
 
ConAgra Q3Mar04
ConAgra Q3Mar04ConAgra Q3Mar04
ConAgra Q3Mar04
 
ConAgra Q4Jul04
ConAgra Q4Jul04ConAgra Q4Jul04
ConAgra Q4Jul04
 
ConAgra Q1Sept22-04
ConAgra Q1Sept22-04ConAgra Q1Sept22-04
ConAgra Q1Sept22-04
 
ConAgra Q2Dec04
ConAgra Q2Dec04ConAgra Q2Dec04
ConAgra Q2Dec04
 
Q3Mar05
Q3Mar05Q3Mar05
Q3Mar05
 
ConAgra Q4Jun05
ConAgra Q4Jun05ConAgra Q4Jun05
ConAgra Q4Jun05
 
ConAgra QAFY06Q1
ConAgra QAFY06Q1ConAgra QAFY06Q1
ConAgra QAFY06Q1
 
ConAgra QAFY06Q2
ConAgra QAFY06Q2ConAgra QAFY06Q2
ConAgra QAFY06Q2
 
ConAgra QAFY06Q3
ConAgra QAFY06Q3ConAgra QAFY06Q3
ConAgra QAFY06Q3
 
ConAgra QAFY06Q4
ConAgra QAFY06Q4ConAgra QAFY06Q4
ConAgra QAFY06Q4
 
ConAgra QAFY07Q1
ConAgra QAFY07Q1ConAgra QAFY07Q1
ConAgra QAFY07Q1
 
ConAgra QAFY07Q2
ConAgra QAFY07Q2ConAgra QAFY07Q2
ConAgra QAFY07Q2
 
ConAgra QAFY07Q3
ConAgra QAFY07Q3ConAgra QAFY07Q3
ConAgra QAFY07Q3
 

Recently uploaded

05_Annelore Lenoir_Docbyte_MeetupDora&Cybersecurity.pptx
05_Annelore Lenoir_Docbyte_MeetupDora&Cybersecurity.pptx05_Annelore Lenoir_Docbyte_MeetupDora&Cybersecurity.pptx
05_Annelore Lenoir_Docbyte_MeetupDora&Cybersecurity.pptxFinTech Belgium
 
Bladex Earnings Call Presentation 1Q2024
Bladex Earnings Call Presentation 1Q2024Bladex Earnings Call Presentation 1Q2024
Bladex Earnings Call Presentation 1Q2024Bladex
 
Log your LOA pain with Pension Lab's brilliant campaign
Log your LOA pain with Pension Lab's brilliant campaignLog your LOA pain with Pension Lab's brilliant campaign
Log your LOA pain with Pension Lab's brilliant campaignHenry Tapper
 
(ANIKA) Budhwar Peth Call Girls Just Call 7001035870 [ Cash on Delivery ] Pun...
(ANIKA) Budhwar Peth Call Girls Just Call 7001035870 [ Cash on Delivery ] Pun...(ANIKA) Budhwar Peth Call Girls Just Call 7001035870 [ Cash on Delivery ] Pun...
(ANIKA) Budhwar Peth Call Girls Just Call 7001035870 [ Cash on Delivery ] Pun...ranjana rawat
 
High Class Call Girls Nashik Maya 7001305949 Independent Escort Service Nashik
High Class Call Girls Nashik Maya 7001305949 Independent Escort Service NashikHigh Class Call Girls Nashik Maya 7001305949 Independent Escort Service Nashik
High Class Call Girls Nashik Maya 7001305949 Independent Escort Service NashikCall Girls in Nagpur High Profile
 
Malad Call Girl in Services 9892124323 | ₹,4500 With Room Free Delivery
Malad Call Girl in Services  9892124323 | ₹,4500 With Room Free DeliveryMalad Call Girl in Services  9892124323 | ₹,4500 With Room Free Delivery
Malad Call Girl in Services 9892124323 | ₹,4500 With Room Free DeliveryPooja Nehwal
 
Call Girls Service Nagpur Maya Call 7001035870 Meet With Nagpur Escorts
Call Girls Service Nagpur Maya Call 7001035870 Meet With Nagpur EscortsCall Girls Service Nagpur Maya Call 7001035870 Meet With Nagpur Escorts
Call Girls Service Nagpur Maya Call 7001035870 Meet With Nagpur Escortsranjana rawat
 
Independent Lucknow Call Girls 8923113531WhatsApp Lucknow Call Girls make you...
Independent Lucknow Call Girls 8923113531WhatsApp Lucknow Call Girls make you...Independent Lucknow Call Girls 8923113531WhatsApp Lucknow Call Girls make you...
Independent Lucknow Call Girls 8923113531WhatsApp Lucknow Call Girls make you...makika9823
 
Solution Manual for Financial Accounting, 11th Edition by Robert Libby, Patri...
Solution Manual for Financial Accounting, 11th Edition by Robert Libby, Patri...Solution Manual for Financial Accounting, 11th Edition by Robert Libby, Patri...
Solution Manual for Financial Accounting, 11th Edition by Robert Libby, Patri...ssifa0344
 
Lundin Gold April 2024 Corporate Presentation v4.pdf
Lundin Gold April 2024 Corporate Presentation v4.pdfLundin Gold April 2024 Corporate Presentation v4.pdf
Lundin Gold April 2024 Corporate Presentation v4.pdfAdnet Communications
 
fca-bsps-decision-letter-redacted (1).pdf
fca-bsps-decision-letter-redacted (1).pdffca-bsps-decision-letter-redacted (1).pdf
fca-bsps-decision-letter-redacted (1).pdfHenry Tapper
 
Interimreport1 January–31 March2024 Elo Mutual Pension Insurance Company
Interimreport1 January–31 March2024 Elo Mutual Pension Insurance CompanyInterimreport1 January–31 March2024 Elo Mutual Pension Insurance Company
Interimreport1 January–31 March2024 Elo Mutual Pension Insurance CompanyTyöeläkeyhtiö Elo
 
Instant Issue Debit Cards - School Designs
Instant Issue Debit Cards - School DesignsInstant Issue Debit Cards - School Designs
Instant Issue Debit Cards - School Designsegoetzinger
 
VVIP Pune Call Girls Katraj (7001035870) Pune Escorts Nearby with Complete Sa...
VVIP Pune Call Girls Katraj (7001035870) Pune Escorts Nearby with Complete Sa...VVIP Pune Call Girls Katraj (7001035870) Pune Escorts Nearby with Complete Sa...
VVIP Pune Call Girls Katraj (7001035870) Pune Escorts Nearby with Complete Sa...Call Girls in Nagpur High Profile
 
Booking open Available Pune Call Girls Shivane 6297143586 Call Hot Indian Gi...
Booking open Available Pune Call Girls Shivane  6297143586 Call Hot Indian Gi...Booking open Available Pune Call Girls Shivane  6297143586 Call Hot Indian Gi...
Booking open Available Pune Call Girls Shivane 6297143586 Call Hot Indian Gi...Call Girls in Nagpur High Profile
 
Dividend Policy and Dividend Decision Theories.pptx
Dividend Policy and Dividend Decision Theories.pptxDividend Policy and Dividend Decision Theories.pptx
Dividend Policy and Dividend Decision Theories.pptxanshikagoel52
 
Quarter 4- Module 3 Principles of Marketing
Quarter 4- Module 3 Principles of MarketingQuarter 4- Module 3 Principles of Marketing
Quarter 4- Module 3 Principles of MarketingMaristelaRamos12
 
The Economic History of the U.S. Lecture 17.pdf
The Economic History of the U.S. Lecture 17.pdfThe Economic History of the U.S. Lecture 17.pdf
The Economic History of the U.S. Lecture 17.pdfGale Pooley
 
Call US 📞 9892124323 ✅ Kurla Call Girls In Kurla ( Mumbai ) secure service
Call US 📞 9892124323 ✅ Kurla Call Girls In Kurla ( Mumbai ) secure serviceCall US 📞 9892124323 ✅ Kurla Call Girls In Kurla ( Mumbai ) secure service
Call US 📞 9892124323 ✅ Kurla Call Girls In Kurla ( Mumbai ) secure servicePooja Nehwal
 
06_Joeri Van Speybroek_Dell_MeetupDora&Cybersecurity.pdf
06_Joeri Van Speybroek_Dell_MeetupDora&Cybersecurity.pdf06_Joeri Van Speybroek_Dell_MeetupDora&Cybersecurity.pdf
06_Joeri Van Speybroek_Dell_MeetupDora&Cybersecurity.pdfFinTech Belgium
 

Recently uploaded (20)

05_Annelore Lenoir_Docbyte_MeetupDora&Cybersecurity.pptx
05_Annelore Lenoir_Docbyte_MeetupDora&Cybersecurity.pptx05_Annelore Lenoir_Docbyte_MeetupDora&Cybersecurity.pptx
05_Annelore Lenoir_Docbyte_MeetupDora&Cybersecurity.pptx
 
Bladex Earnings Call Presentation 1Q2024
Bladex Earnings Call Presentation 1Q2024Bladex Earnings Call Presentation 1Q2024
Bladex Earnings Call Presentation 1Q2024
 
Log your LOA pain with Pension Lab's brilliant campaign
Log your LOA pain with Pension Lab's brilliant campaignLog your LOA pain with Pension Lab's brilliant campaign
Log your LOA pain with Pension Lab's brilliant campaign
 
(ANIKA) Budhwar Peth Call Girls Just Call 7001035870 [ Cash on Delivery ] Pun...
(ANIKA) Budhwar Peth Call Girls Just Call 7001035870 [ Cash on Delivery ] Pun...(ANIKA) Budhwar Peth Call Girls Just Call 7001035870 [ Cash on Delivery ] Pun...
(ANIKA) Budhwar Peth Call Girls Just Call 7001035870 [ Cash on Delivery ] Pun...
 
High Class Call Girls Nashik Maya 7001305949 Independent Escort Service Nashik
High Class Call Girls Nashik Maya 7001305949 Independent Escort Service NashikHigh Class Call Girls Nashik Maya 7001305949 Independent Escort Service Nashik
High Class Call Girls Nashik Maya 7001305949 Independent Escort Service Nashik
 
Malad Call Girl in Services 9892124323 | ₹,4500 With Room Free Delivery
Malad Call Girl in Services  9892124323 | ₹,4500 With Room Free DeliveryMalad Call Girl in Services  9892124323 | ₹,4500 With Room Free Delivery
Malad Call Girl in Services 9892124323 | ₹,4500 With Room Free Delivery
 
Call Girls Service Nagpur Maya Call 7001035870 Meet With Nagpur Escorts
Call Girls Service Nagpur Maya Call 7001035870 Meet With Nagpur EscortsCall Girls Service Nagpur Maya Call 7001035870 Meet With Nagpur Escorts
Call Girls Service Nagpur Maya Call 7001035870 Meet With Nagpur Escorts
 
Independent Lucknow Call Girls 8923113531WhatsApp Lucknow Call Girls make you...
Independent Lucknow Call Girls 8923113531WhatsApp Lucknow Call Girls make you...Independent Lucknow Call Girls 8923113531WhatsApp Lucknow Call Girls make you...
Independent Lucknow Call Girls 8923113531WhatsApp Lucknow Call Girls make you...
 
Solution Manual for Financial Accounting, 11th Edition by Robert Libby, Patri...
Solution Manual for Financial Accounting, 11th Edition by Robert Libby, Patri...Solution Manual for Financial Accounting, 11th Edition by Robert Libby, Patri...
Solution Manual for Financial Accounting, 11th Edition by Robert Libby, Patri...
 
Lundin Gold April 2024 Corporate Presentation v4.pdf
Lundin Gold April 2024 Corporate Presentation v4.pdfLundin Gold April 2024 Corporate Presentation v4.pdf
Lundin Gold April 2024 Corporate Presentation v4.pdf
 
fca-bsps-decision-letter-redacted (1).pdf
fca-bsps-decision-letter-redacted (1).pdffca-bsps-decision-letter-redacted (1).pdf
fca-bsps-decision-letter-redacted (1).pdf
 
Interimreport1 January–31 March2024 Elo Mutual Pension Insurance Company
Interimreport1 January–31 March2024 Elo Mutual Pension Insurance CompanyInterimreport1 January–31 March2024 Elo Mutual Pension Insurance Company
Interimreport1 January–31 March2024 Elo Mutual Pension Insurance Company
 
Instant Issue Debit Cards - School Designs
Instant Issue Debit Cards - School DesignsInstant Issue Debit Cards - School Designs
Instant Issue Debit Cards - School Designs
 
VVIP Pune Call Girls Katraj (7001035870) Pune Escorts Nearby with Complete Sa...
VVIP Pune Call Girls Katraj (7001035870) Pune Escorts Nearby with Complete Sa...VVIP Pune Call Girls Katraj (7001035870) Pune Escorts Nearby with Complete Sa...
VVIP Pune Call Girls Katraj (7001035870) Pune Escorts Nearby with Complete Sa...
 
Booking open Available Pune Call Girls Shivane 6297143586 Call Hot Indian Gi...
Booking open Available Pune Call Girls Shivane  6297143586 Call Hot Indian Gi...Booking open Available Pune Call Girls Shivane  6297143586 Call Hot Indian Gi...
Booking open Available Pune Call Girls Shivane 6297143586 Call Hot Indian Gi...
 
Dividend Policy and Dividend Decision Theories.pptx
Dividend Policy and Dividend Decision Theories.pptxDividend Policy and Dividend Decision Theories.pptx
Dividend Policy and Dividend Decision Theories.pptx
 
Quarter 4- Module 3 Principles of Marketing
Quarter 4- Module 3 Principles of MarketingQuarter 4- Module 3 Principles of Marketing
Quarter 4- Module 3 Principles of Marketing
 
The Economic History of the U.S. Lecture 17.pdf
The Economic History of the U.S. Lecture 17.pdfThe Economic History of the U.S. Lecture 17.pdf
The Economic History of the U.S. Lecture 17.pdf
 
Call US 📞 9892124323 ✅ Kurla Call Girls In Kurla ( Mumbai ) secure service
Call US 📞 9892124323 ✅ Kurla Call Girls In Kurla ( Mumbai ) secure serviceCall US 📞 9892124323 ✅ Kurla Call Girls In Kurla ( Mumbai ) secure service
Call US 📞 9892124323 ✅ Kurla Call Girls In Kurla ( Mumbai ) secure service
 
06_Joeri Van Speybroek_Dell_MeetupDora&Cybersecurity.pdf
06_Joeri Van Speybroek_Dell_MeetupDora&Cybersecurity.pdf06_Joeri Van Speybroek_Dell_MeetupDora&Cybersecurity.pdf
06_Joeri Van Speybroek_Dell_MeetupDora&Cybersecurity.pdf
 

first energy 3Q 2007

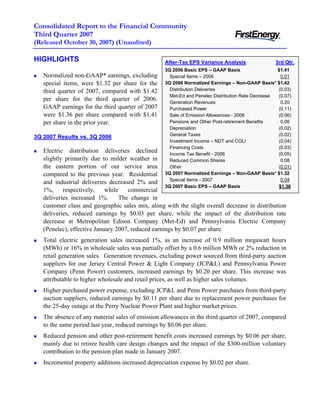
  • 1. Consolidated Report to the Financial Community Third Quarter 2007 (Released October 30, 2007) (Unaudited) HIGHLIGHTS After-Tax EPS Variance Analysis 3rd Qtr. 3Q 2006 Basic EPS – GAAP Basis $1.41 Normalized non-GAAP* earnings, excluding Special Items – 2006 0.01 special items, were $1.32 per share for the 3Q 2006 Normalized Earnings – Non-GAAP Basis* $1.42 Distribution Deliveries (0.03) third quarter of 2007, compared with $1.42 Met-Ed and Penelec Distribution Rate Decrease (0.07) per share for the third quarter of 2006. Generation Revenues 0.20 GAAP earnings for the third quarter of 2007 Purchased Power (0.11) were $1.36 per share compared with $1.41 Sale of Emission Allowances - 2006 (0.06) Pensions and Other Post-retirement Benefits 0.06 per share in the prior year. Depreciation (0.02) General Taxes (0.02) 3Q 2007 Results vs. 3Q 2006 Investment Income – NDT and COLI (0.04) Financing Costs (0.03) Electric distribution deliveries declined Income Tax Benefit - 2006 (0.05) slightly primarily due to milder weather in Reduced Common Shares 0.08 the eastern portion of our service area Other (0.01) 3Q 2007 Normalized Earnings – Non-GAAP Basis* $1.32 compared to the previous year. Residential Special Items - 2007 0.04 and industrial deliveries decreased 2% and 3Q 2007 Basic EPS – GAAP Basis $1.36 1%, respectively, while commercial deliveries increased 1%. The change in customer class and geographic sales mix, along with the slight overall decrease in distribution deliveries, reduced earnings by $0.03 per share, while the impact of the distribution rate decrease at Metropolitan Edison Company (Met-Ed) and Pennsylvania Electric Company (Penelec), effective January 2007, reduced earnings by $0.07 per share. Total electric generation sales increased 1%, as an increase of 0.9 million megawatt hours (MWh) or 16% in wholesale sales was partially offset by a 0.6 million MWh or 2% reduction in retail generation sales. Generation revenues, excluding power sourced from third-party auction suppliers for our Jersey Central Power & Light Company (JCP&L) and Pennsylvania Power Company (Penn Power) customers, increased earnings by $0.20 per share. This increase was attributable to higher wholesale and retail prices, as well as higher sales volumes. Higher purchased power expense, excluding JCP&L and Penn Power purchases from third-party auction suppliers, reduced earnings by $0.11 per share due to replacement power purchases for the 25-day outage at the Perry Nuclear Power Plant and higher market prices. The absence of any material sales of emission allowances in the third quarter of 2007, compared to the same period last year, reduced earnings by $0.06 per share. Reduced pension and other post-retirement benefit costs increased earnings by $0.06 per share, mainly due to retiree health care design changes and the impact of the $300-million voluntary contribution to the pension plan made in January 2007. Incremental property additions increased depreciation expense by $0.02 per share.
  • 2. Higher general taxes reduced earnings by $0.02 per share, primarily due to increased property taxes and Pennsylvania gross receipts taxes. Decreased investment income related to nuclear decommissioning trusts and corporate-owned life insurance reduced earnings by $0.04 per share. Increased financing costs lowered earnings by $0.03 per share, primarily attributable to the interim financing of the accelerated share repurchase program and the January 2007 pension plan contribution. A $0.05 per share reduction in earnings resulted from an income tax benefit that increased earnings in the third quarter last year. The benefit principally related to the 2005 estimated manufacturing deduction in connection with the filing of the 2005 federal income tax return in September 2006. The reduction in shares outstanding due to the accelerated repurchases of 10.6 million and 14.4 million common shares in August 2006 and March 2007, respectively, enhanced earnings by $0.08 per share. During the quarter, a $0.04 per share increase in earnings was recognized from gains related to the sale of a portion of our ownership interest in First Communications. 2007 Earnings Guidance Normalized non-GAAP earnings guidance for 2007, excluding special items, has been revised to $4.15 to $4.25 per share from our previous non-GAAP guidance of $4.05 to $4.25 per share. The increase toward the top half of the prior guidance reflects the strong performance during the first nine months of the year. Year-to-date normalized non-GAAP earnings through September now stand at $3.33 per share. * The 2007 GAAP to non-GAAP reconciliation statements can be found on page 10 of this report and all GAAP to non-GAAP reconciliation statements are available on the Investor Information section of FirstEnergy Corp.'s Web site at www.firstenergycorp.com/ir. For additional information, please contact: Ronald E. Seeholzer Kurt E. Turosky Rey Y. Jimenez Vice President, Investor Relations Director, Investor Relations Principal, Investor Relations (330) 384-5783 (330) 384-5500 (330) 761-4239 Consolidated Report to the Financial Community –3rd Quarter 2007 2
  • 3. FirstEnergy Corp. Consolidated Statements of Income (Unaudited) (In millions, except for per share amounts) Three Months Ended Sept. 30, Nine Months Ended Sept. 30, 2007 2006 Change 2007 2006 Change Revenues (1) Electric sales $ 3,394 $ 3,115 $ 279 $ 9,062 $ 8,179 $ 883 (2) FE Facilities - 10 (10) - 48 (48) (3) Other 247 239 8 661 594 67 (4) Total Revenues 3,641 3,364 277 9,723 8,821 902 Expenses (5) Fuel 327 344 (17) 887 929 (42) (6) Purchased power 1,168 973 195 2,914 2,377 537 (7) Other operating expenses 756 748 8 2,255 2,180 75 (8) FE Facilities - 10 (10) - 50 (50) (9) Provision for depreciation 162 153 9 477 445 32 (10) Amortization of regulatory assets 288 243 45 785 665 120 (11) Deferral of new regulatory assets (107) (153) 46 (399) (379) (20) (12) General taxes 197 187 10 589 553 36 (13) Total Expenses 2,791 2,505 286 7,508 6,820 688 (14) Operating Income 850 859 (9) 2,215 2,001 214 Other Income (Expense) (15) Investment income 30 46 (16) 93 120 (27) (16) Interest expense (203) (185) (18) (593) (528) (65) (17) Capitalized interest 9 7 2 21 21 - (18) Subsidiaries' preferred stock dividends - (2) 2 - (6) 6 (19) (164) (134) (30) (479) (393) (86) Total Other Income (Expense) (20) Income From Continuing Operations 686 725 (39) 1,736 1,608 128 Before Income Taxes (21) Income taxes 273 273 - 695 625 70 (22) Income From Continuing Operations 413 452 (39) 1,041 983 58 (23) Discontinued operations - 2 (2) - (4) 4 (24) Net Income $ 413 $ 454 $ (41) $ 1,041 $ 979 $ 62 Basic Earnings Per Common Share: (25) Income from continuing operations $ 1.36 $ 1.40 $ (0.04) $ 3.39 $ 3.00 $ 0.39 (26) Discontinued operations - 0.01 (0.01) - (0.01) 0.01 (27) Basic Earnings Per Common Share $ 1.36 $ 1.41 $ (0.05) $ 3.39 $ 2.99 $ 0.40 (28) Weighted Average Number of (19) 304 322 (18) 307 326 Basic Shares Outstanding Diluted Earnings Per Common Share: (29) Income from continuing operations $ 1.34 $ 1.39 $ (0.05) $ 3.35 $ 2.98 $ 0.37 (30) Discontinued operations - 0.01 (0.01) - (0.01) 0.01 (31) Diluted Earnings Per Common Share $ 1.34 $ 1.40 $ (0.06) $ 3.35 $ 2.97 $ 0.38 (32) Weighted Average Number of 307 325 (18) 311 329 (18) Diluted Shares Outstanding ______________________________________________________________________________________________________ Consolidated Report to the Financial Community – 3rd Quarter 2007 3
  • 4. FirstEnergy Corp. Consolidated Income Segments (Unaudited) (In millions) Three Months Ended September 30, 2007 Ohio Energy Competitive Transitional Energy Reconciling Delivery Generation Services (b) Adjustments Services (a) Services (c) Other (d) Consolidated Revenues (1) Electric sales $ 2,340 $ 338 $ 716 $ - $ - $ 3,394 (2) FE Facilities - - - - - - (3) Other 180 32 7 9 19 247 (4) Internal revenues - 806 - - (806) - (5) 2,520 1,176 723 9 (787) 3,641 Total Revenues Expenses (6) Fuel 2 325 - - - 327 (7) Purchased power 1,114 229 631 - (806) 1,168 (8) Other operating expenses 436 264 80 3 (27) 756 (9) FE Facilities - - - - - - (10) Provision for depreciation 102 51 - 1 8 162 (11) Amortization of regulatory assets 279 - 9 - - 288 (12) Deferral of new regulatory assets (82) - (25) - - (107) (13) General taxes 166 26 1 1 3 197 (14) Total Expenses 2,017 895 696 5 (822) 2,791 (15) Operating Income 503 281 27 4 35 850 Other Income (Expense) (16) Investment income 58 5 - 1 (34) 30 (17) Interest expense (120) (44) - (1) (38) (203) (18) Capitalized interest 3 5 - - 1 9 (19) Subsidiaries' preferred stock dividends - - - - - - (20) (59) (34) - - (71) (164) Total Other Income (Expense) (21) Income From Continuing Operations 444 247 27 4 (36) 686 Before Income Taxes (22) Income taxes 175 99 11 (2) (10) 273 (23) 269 148 16 6 (26) 413 Income From Continuing Operations (24) Discontinued operations - - - - - - (25) Net Income $ 269 $ 148 $ 16 $ 6 $ (26) $ 413 (a) Consists of regulated transmission and distribution operations, including transition cost recovery, and provider of last resort generation service for FirstEnergy's Pennsylvania and New Jersey electric utility subsidiaries. (b) Consists of unregulated generation and commodity operations, including competitive electric sales, and generation sales to affiliated electric utilities. (c) Represents provider of last resort generation service by FirstEnergy's Ohio electric utility subsidiaries. (d) Primarily consists of telecommunications services. ______________________________________________________________________________________________________ Consolidated Report to the Financial Community – 3rd Quarter 2007 4
  • 5. FirstEnergy Corp. Consolidated Income Segments (Unaudited) (In millions) Three Months Ended September 30, 2006 Ohio Energy Competitive Transitional Energy Reconciling Delivery Generation Services (b) Adjustments Services (a) Services (c) Other (d) Consolidated Revenues (1) Electric sales $ 2,120 $ 313 $ 682 $ - $ - $ 3,115 (2) FE Facilities - - - 10 - 10 (3) Other 186 40 8 14 (9) 239 (4) Internal revenues - 762 - - (762) - Total Revenues (5) 2,306 1,115 690 24 (771) 3,364 Expenses (6) Fuel 2 342 - - - 344 (7) Purchased power 958 173 604 - (762) 973 (8) Other operating expenses 468 218 76 1 (15) 748 (9) FE Facilities - - - 10 - 10 (10) Provision for depreciation 97 49 - 1 6 153 (11) Amortization of regulatory assets 237 - 6 - - 243 (12) Deferral of new regulatory assets (107) - (46) - - (153) (13) General taxes 157 21 5 (1) 5 187 (14) Total Expenses 1,812 803 645 11 (766) 2,505 (15) Operating Income 494 312 45 13 (5) 859 Other Income (Expense) (16) Investment income 80 18 - - (52) 46 (17) Interest expense (109) (52) - (2) (22) (185) (18) Capitalized interest 4 3 - - - 7 (19) Subsidiaries' preferred stock dividends (2) - - - - (2) (20) (27) (31) - (2) (74) (134) Total Other Income (Expense) (21) Income From Continuing Operations 467 281 45 11 (79) 725 Before Income Taxes (22) Income taxes 187 112 18 (14) (30) 273 (23) Income From Continuing Operations 280 169 27 25 (49) 452 (24) Discontinued operations - - - 2 - 2 (25) Net Income $ 280 $ 169 $ 27 $ 27 $ (49) $ 454 (a) Consists of regulated transmission and distribution operations, including transition cost recovery, and provider of last resort generation service for FirstEnergy's Pennsylvania and New Jersey electric utility subsidiaries. (b) Consists of unregulated generation and commodity operations, including competitive electric sales, and generation sales to affiliated electric utilities. (c) Represents provider of last resort generation service by FirstEnergy's Ohio electric utility subsidiaries. (d) Consists of telecommunications services and non-core businesses divested in 2006 (Facilities Services Group and MYR). ______________________________________________________________________________________________________ Consolidated Report to the Financial Community – 3rd Quarter 2007 5
  • 6. FirstEnergy Corp. Consolidated Income Segments (Unaudited) (In millions) Three Months Ended Sept. 30, 2007 vs. Three Months Ended Sept. 30, 2006 Ohio Energy Competitive Transitional Energy Reconciling Delivery Generation Services (b) Adjustments Services (a) Services (c) Other (d) Consolidated Revenues (1) Electric sales $ 220 $ 25 $ 34 $ - $ - $ 279 (2) FE Facilities - - - (10) - (10) (3) Other (6) (8) (1) (5) 28 8 (4) Internal revenues - 44 - - (44) - (5) 214 61 33 (15) (16) 277 Total Revenues Expenses (6) Fuel - (17) - - - (17) (7) Purchased power 156 56 27 - (44) 195 (8) Other operating expenses (32) 46 4 2 (12) 8 (9) FE Facilities - - - (10) - (10) (10) Provision for depreciation 5 2 - - 2 9 (11) Amortization of regulatory assets 42 - 3 - - 45 (12) Deferral of new regulatory assets 25 - 21 - - 46 (13) General taxes 9 5 (4) 2 (2) 10 (14) Total Expenses 205 92 51 (6) (56) 286 (15) Operating Income 9 (31) (18) (9) 40 (9) Other Income (Expense) (16) Investment income (22) (13) - 1 18 (16) (17) Interest expense (11) 8 - 1 (16) (18) (18) Capitalized interest (1) 2 - - 1 2 (19) Subsidiaries' preferred stock dividends 2 - - - - 2 (20) (32) (3) - 2 3 (30) Total Other Income (Expense) (21) Income From Continuing Operations (23) (34) (18) (7) 43 (39) Before Income Taxes (22) Income taxes (12) (13) (7) 12 20 - (23) Income From Continuing Operations (11) (21) (11) (19) 23 (39) (24) Discontinued operations - - - (2) - (2) (25) Net Income $ (11) $ (21) $ (11) $ (21) $ 23 $ (41) (a) Consists of regulated transmission and distribution operations, including transition cost recovery, and provider of last resort generation service for FirstEnergy's Pennsylvania and New Jersey electric utility subsidiaries. (b) Consists of unregulated generation and commodity operations, including competitive electric sales, and generation sales to affiliated electric utilities. (c) Represents provider of last resort generation service by FirstEnergy's Ohio electric utility subsidiaries. (d) Consists of telecommunications services and non-core businesses divested in 2006 (Facilities Services Group and MYR). ______________________________________________________________________________________________________ Consolidated Report to the Financial Community – 3rd Quarter 2007 6
  • 7. FirstEnergy Corp. Financial Statements (Unaudited) (In millions) Condensed Consolidated Balance Sheets As of As of As of June 30, As Dec. 31, of Dec 31, Sept. 30, 2007 2006 2007 2006 Assets Current Assets: Cash and cash equivalents $ 30 $ 90 Receivables 1,626 1,267 Other 750 726 Total Current Assets 2,406 2,083 Property, Plant and Equipment 15,038 14,667 Investments 3,665 3,534 Deferred Charges and Other Assets 10,544 10,912 Total Assets $ 31,653 $ 31,196 Liabilities and Capitalization Current Liabilities: Currently payable long-term debt $ 2,265 $ 1,867 Short-term borrowings 573 1,108 Accounts payable 760 726 Other 1,780 1,554 Total Current Liabilities 5,378 5,255 Capitalization: Common stockholders' equity (a) 8,768 9,035 Long-term debt and other long-term obligations 8,617 8,535 Total Capitalization 17,385 17,570 Noncurrent Liabilities 8,890 8,371 Total Liabilities and Capitalization $ 31,653 $ 31,196 (a) Reduction reflects $900 million common share repurchase in 2007. General Information Three Months Ended Sept. 30, Nine Months Ended Sept. 30, 2007 2006 2007 2006 Debt and equity securities redemptions $ (176) $ (1,185) $ (1,565) $ (1,700) New long-term debt issues $ 300 $ 182 $ 1,100 $ 1,235 Short-term debt increase/(decrease) $ (1,843) $ 111 $ (535) $ 482 Capital expenditures $ (430) $ (251) $ (1,127) $ (990) Adjusted Capitalization (Including Off-Balance Sheet Items) - Rating Agency View As of September 30, 2007 % Total 2006 % Total Total common equity $ 8,768 40% $ 9,208 42% Preferred stock - - 80 0% Long-term debt (a) 10,478 48% 9,994 46% Short-term debt 573 3% 1,213 6% Off-balance sheet debt equivalents: Sale-leaseback net debt equivalents (b) 2,032 9% 1,255 6% Total $ 21,851 100% $ 21,750 100% (a) Includes amount due to be paid within one year and excludes JCP&L securitization debt of $404 million and $434 million in 2007 and 2006, respectively. (b) Associated with 1987 and 2007 sale and leaseback transactions. ______________________________________________________________________________________________________ Consolidated Report to the Financial Community – 3rd Quarter 2007 7
  • 8. FirstEnergy Corp. Financial Statements (Unaudited) (In millions) Condensed Consolidated Statements of Cash Flows Three Months Ended Sept. 30, Nine Months Ended Sept. 30, 2007 2006 2007 2006 Cash flows from operating activities: Net income $ 413 $ 454 $ 1,041 $ 979 Adjustments to reconcile net income to net cash from operating activities: Depreciation, amortization, and deferral of regulatory assets 343 244 863 731 Deferred purchased power and other costs (80) (84) (265) (323) Deferred income taxes and investment tax credits* (243) 4 (158) 36 Deferred rents and lease market valuation liability 51 51 (41) (54) Electric service prepayment programs (16) (16) (52) (45) Cash collateral, net (31) (43) (50) (98) Pension trust contribution - - (300) - Change in working capital and other* 583 148 113 17 1,020 758 1,151 1,243 Cash flows provided from operating activities (1,896) (1,062) (1,442) (444) Cash flows used for financing activities 869 (238) 231 (822) Cash flows provided from (used for) investing activities $ (7) $ (542) $ (60) $ (23) Net decrease in cash and cash equivalents * The Bruce Mansfield sale and leaseback transaction reduced deferred income taxes by $187 million and increased accrued taxes included in working capital changes by the same amount in the 2007 periods. Deferrals and Amortizations Three Months Ended Sept. 30, Nine Months Ended Sept. 30, 2007 2006 Change 2007 2006 Change Ohio Regulatory Assets $ 1,826 $ 1,882 $ 1,844 $ 1,924 Deferred Balance - Beginning - - - Deferral of shopping incentives $ - 3 $ (3) Interest on shopping incentives 9 11 (2) 28 32 (4) Deferral of MISO costs and interest 7 4 3 45 11 34 Deferral of RCP distribution reliability costs 52 40 12 143 121 22 Deferral of RCP fuel costs 21 43 (22) 62 94 (32) Deferral of other regulatory assets 6 1 5 17 7 10 $ 95 $ 99 $ (4) $ 295 $ 268 $ 27 Current period deferrals Amortization Ohio transition costs amortization $ (83) $ (77) $ (6) $ (222) $ (211) $ (11) Shopping incentives amortization (34) (34) - (94) (93) (1) MISO costs amortization (9) (5) (4) (20) (15) (5) Other (7) (8) 1 (15) (16) 1 $ (133) $ (124) $ (9) $ (351) $ (335) $ (16) Current period amortization $ 1,788 $ 1,857 $ 1,788 $ 1,857 Deferred Balance - Ending Pennsylvania Deferred PJM Costs $ 216 $ 57 $ 157 $ - Beginning Balance Deferrals 13 54 $ (41) 81 111 $ (30) - - Interest 1 1 3 3 - - Amortizations (3) (3) (14) (14) $ 227 $ 111 $ 227 $ 111 Ending Balance New Jersey Deferred Energy Costs $ 392 $ 638 $ 369 $ 541 Beginning Balance $ 236 $ 162 Deferral of energy costs (62) (298) (39) (201) $ 330 $ 340 $ 330 $ 340 Ending Balance ______________________________________________________________________________________________________ Consolidated Report to the Financial Community – 3rd Quarter 2007 8
  • 9. FirstEnergy Corp. Statistical Summary (Unaudited) ELECTRIC SALES STATISTICS Three Months Ended September 30, Nine Months Ended September 30, (in millions of kWhs) 2007 2006 Change 2007 2006 Change Electric Generation Sales Retail - Regulated 25,659 26,281 -2.4% 73,653 72,878 1.1% Retail - Competitive 3,449 3,442 0.2% 9,940 8,901 11.7% Total Retail 29,108 29,723 -2.1% 83,593 81,779 2.2% Wholesale 6,148 5,296 16.1% 17,571 17,279 1.7% Total Electric Generation Sales 35,256 35,019 0.7% 101,164 99,058 2.1% Electric Distribution Deliveries Ohio - Residential 4,676 4,642 0.7% 13,342 12,666 5.3% - Commercial 4,028 3,985 1.1% 11,497 11,145 3.2% - Industrial 6,073 6,111 -0.6% 17,661 17,673 -0.1% - Other 93 95 -2.1% 278 280 -0.7% Total Ohio 14,870 14,833 0.2% 42,778 41,764 2.4% Pennsylvania - Residential 2,987 2,987 - 8,855 8,444 4.9% - Commercial 2,997 2,930 2.3% 8,499 8,182 3.9% - Industrial 2,622 2,671 -1.8% 7,730 7,845 -1.5% - Other 20 20 - 61 62 -1.6% Total Pennsylvania 8,626 8,608 0.2% 25,145 24,533 2.5% New Jersey - Residential 2,878 3,092 -6.9% 7,617 7,447 2.3% - Commercial 2,732 2,708 0.9% 7,444 7,204 3.3% - Industrial 739 749 -1.3% 2,166 2,142 1.1% - Other 23 22 4.5% 66 65 1.5% Total New Jersey 6,372 6,571 -3.0% 17,293 16,858 2.6% Total Residential 10,541 10,721 -1.7% 29,814 28,557 4.4% Total Commercial 9,757 9,623 1.4% 27,440 26,531 3.4% Total Industrial 9,434 9,531 -1.0% 27,557 27,660 -0.4% Total Other 136 137 -0.7% 405 407 -0.5% Total Distribution Deliveries 29,868 30,012 -0.5% 85,216 83,155 2.5% Electric Sales Shopped Ohio - Residential 635 672 -5.5% 1,687 1,766 -4.5% - Commercial 957 1,045 -8.4% 2,712 2,910 -6.8% - Industrial 719 761 -5.5% 2,048 2,204 -7.1% Total Ohio 2,311 2,478 -6.7% 6,447 6,880 -6.3% Pennsylvania - Residential 33 - - 44 1 - - Commercial 182 143 27.3% 446 1 - - Industrial 513 - - 1,389 368 277.5% Total Pennsylvania 728 143 409.1% 1,879 370 407.7% New Jersey - Residential - - - - - - - Commercial 603 555 8.6% 1,598 1,449 10.3% - Industrial 567 555 2.2% 1,641 1,578 4.0% Total New Jersey 1,170 1,110 5.4% 3,239 3,027 7.0% Total Electric Sales Shopped 4,209 3,731 12.8% 11,565 10,277 12.5% Operating Statistics Three Months Ended Sept. 30, Nine Months Ended Sept. 30, 2007 2006 2007 2006 Capacity Factors: Fossil - Baseload 85% 86% 80% 90% Fossil - Load Following 71% 72% 73% 69% Peaking 4% 4% 2% 1% Nuclear 89% 97% 89% 88% Generation Output: Fossil - Baseload 40% 39% 39% 42% Fossil - Load Following 22% 22% 23% 22% Peaking 1% 1% 0% 0% Nuclear 37% 38% 38% 36% Three Months Ended Sept. 30, Nine Months Ended Sept. 30, Weather 2007 2006 Normal 2007 2006 Normal Composite Heating-Degree-Days 57 92 100 3,619 3,183 3,557 Composite Cooling-Degree-Days 683 678 647 969 885 906 ______________________________________________________________________________________________________ Consolidated Report to the Financial Community – 3rd Quarter 2007 9
  • 10. FirstEnergy Corp. 2007 EPS Reconciliations (Unaudited) (In millions, except for per share amounts) Special Items Three Months Ended Sept. 30, Nine Months Ended Sept. 30, 2007 2006 2007 2006 Pre-tax Items - Income Increase (Decrease) Gain (Loss) on Non-Core Asset Sales of: Loss on sale on MYR 60% interest (a) $ - $ - $ - $ (5) Gain on sale of First Communications (h) 21 - 21 - All other (a)(f) - - - 6 Total Gain on Non-Core Asset Sales 21 - 21 1 Saxton decommissioning costs regulatory assets (b) - - 27 - Trust securities impairment (c) (4) - (16) - FE Facilities sales/impairment (d)(e)(g) - (1) - (13) PA NUG purchased power adjustment applicable to 2005 (i) - (10) - (10) $ 17 $ (11) $ 32 $ (22) Total-Pretax Items EPS Effect $ 0.04 $ (0.01) $ 0.06 $ (0.05) (a) Included in quot;Other operating expensesquot; (f) Before first quarter 2006 tax benefit of $2.5 million (b) Included in quot;Deferral of new regulatory assetsquot; (g) Non-tax deductible (c) Included in quot;Investment incomequot; (h) Located in quot;Other Revenuequot; (d) Included in quot;FE Facilities expensesquot; (i) Located in quot;Purchased Powerquot; (e) Included in quot;Discontinued Operationsquot; 2007 Earnings Per Share (EPS) (Reconciliation of GAAP to Non-GAAP) ACTUAL ACTUAL Non-GAAP Three Months Nine Months Guidance For Ended Sept. 30 Ended Sept. 30 Year 2007 Basic EPS (GAAP basis) $ 1.36 $ 3.39 $4.21 - $4.31 Excluding Special Items: New regulatory asset authorized by PPUC - (0.05) (0.05) Gain on sale of non-core assets (0.04) (0.04) (0.04) Trust securities impairment - 0.03 0.03 Basic EPS (Non-GAAP basis) $ 1.32 $ 3.33 $4.15 - $4.25 ______________________________________________________________________________________________________ Consolidated Report to the Financial Community – 3rd Quarter 2007 10
  • 11. RECENT DEVELOPMENTS Ohio Senate Bill 221 – Energy Plan Proposal On September 25, 2007, Ohio Governor Strickland’s proposed energy plan for the State of Ohio was introduced as Senate Bill 221. The principles of the proposed bill are similar to those outlined in the Governor’s “Energy, Jobs, and Progress for Ohio” plan announced on August 29. The bill seeks to revise state energy policy to address electric service price regulation (market rate option or electric security plan), establish energy efficiency standards, adopt advanced energy portfolio standards (advanced energy technologies to provide 25% of standard service offer generation supply by 2025, with at least one-half coming from renewables), and create greenhouse gas emission reporting and carbon-control planning requirements. Senate Bill 221 was referred to the Senate Energy & Public Utilities Committee, which has been conducting hearings on the bill with testimony from interested parties. These include the Governor’s Energy Advisor, the Chairman of the Public Utilities Commission of Ohio (PUCO), consumer groups, and utility executives among others. On October 4, FirstEnergy CEO Tony Alexander provided testimony to the Committee, citing several concerns with the current version of the bill, including its lack of context and clarity in establishing generation prices. He recommended that the PUCO be provided clear statutory authority to negotiate rate plans and, in the event that negotiations do not result in rate plan agreements, that a competitive bid process be used to establish generation prices for customers who do not choose alternative suppliers. He also proposed that the PUCO’s statutory authority include the flexibility to address recovery for societal programs such as energy efficiency, demand response, renewable power, and infrastructure improvements. Several proposed amendments to the bill have been submitted, including those from Ohio's investor- owned electric utilities. A substitute version of the bill, which incorporated certain of the proposed amendments, was introduced into the Senate Energy & Public Utilities Committee on October 25. Ohio Competitive Generation Supply Plan Filing On August 16, 2007, the PUCO held a technical conference for interested parties to gain a better understanding of the competitive generation supply plan filed with the PUCO by FirstEnergy subsidiaries Ohio Edison Company (OE), The Cleveland Electric Illuminating Company (CEI), and The Toledo Edison Company (TE) (collectively Ohio Companies) on July 10. The proposal seeks approval to conduct a competitive bidding process to provide generation service, beginning January 1, 2009, to customers who choose not to purchase electricity from an alternative supplier. Intervening parties filed their initial comments on the proposal on September 5, while the PUCO Staff filed its comments on September 21. Parties then filed reply comments on October 12. The proposal is pending before the PUCO. Ohio Supreme Court Remand on Rate Certainty Plan On August 29, 2007, the Supreme Court of Ohio upheld rulings by the PUCO approving several provisions of the Ohio Companies’ Rate Certainty Plan. However, the Court remanded the portion of the order authorizing the Ohio Companies to collect deferred fuel costs through distribution rates back to the PUCO for further consideration. Under the Court’s interpretation, recovery of generation service costs through distribution rates would be unlawful. The Court didn’t dispute the Commission’s authority to allow recovery of the deferred fuel costs, just the recovery mechanism. The PUCO’s order authorized the Ohio Companies to defer increased fuel costs incurred from January 1, 2006, through December 31, 2008, including interest on the deferred balances, and to recover these deferred costs over a 25-year period beginning in 2009. On September 7, 2007, the Ohio Companies filed a motion for reconsideration with the Court to contest its interpretation. The Court has not yet issued an order. Separately, on September 10, the Ohio Companies filed an application on remand with the PUCO proposing that the increased fuel costs be recovered via two generation-related fuel cost recovery riders during the period of October 2007 through December 2008. This matter is pending before the PUCO. Ohio Companies’ Green Option for Customers Update On August 15, 2007, the PUCO approved a stipulation that creates a green pricing option for FirstEnergy’s Ohio Companies’ customers and resolves the remand from the Supreme Court of Ohio related to the Rate Stabilization Plan. The stipulation was filed on May 29 by FirstEnergy’s Ohio Companies, the PUCO Staff, and the Office of the Ohio Consumers’ Counsel. The Green Resource Program enables customers to support the development of alternative energy resources through voluntary purchases of Renewable Energy Certificates (RECs). The Ohio Companies acquired the right to purchase the RECs on behalf of participating customers through a PUCO-monitored competitive process. Consolidated Report to the Financial Community –3rd Quarter 2007 11
  • 12. Penn Power Default Service Plan Update On September 28, 2007, a Joint Petition for Settlement was filed with the Pennsylvania Public Utility Commission (PPUC) for approval of Pennsylvania Power Company’s (Penn Power’s) Interim Default Service Supply Plan for the three-year period covering June 1, 2008, through May 31, 2011. For customers who choose not to shop, the Plan provides for Penn Power to obtain market-based generation supply via a Request for Proposal (RFP) by rate class for residential and commercial customers, with industrial customers being supplied through short-term markets. The settlement agreement resolves all issues in the proceeding, except those regarding incremental uncollectible accounts expense, and is either supported, or not opposed, by all parties. On September 11, a PPUC hearing was held on the uncollectible expense issue. An Administrative Law Judge recommended decision is expected shortly with a PPUC Order expected on or about November 29, 2007. Met-Ed and Penelec Commonwealth Court Appeals Update On September 21 and October 5, 2007, response and reply briefs, respectively, were filed by the parties in the appeal of the PPUC’s January 2007 transition rate plan order to the Pennsylvania Commonwealth Court. Metropolitan Edison Company (Met-Ed) and Pennsylvania Electric Company (Penelec) have appealed the PPUC’s decision on the denial of generation rate relief and on a consolidated income tax adjustment related to cost of capital, while other parties appealed the PPUC’s decision on transmission rate relief. Oral arguments are expected to take place in late 2007 or early 2008. Penelec Debt Offering On August 30, 2007, Penelec issued $300 million of 6.05% Senior Unsecured Notes due 2017. Proceeds from the transaction were used to repay short-term borrowings and to repurchase Penelec common stock from FirstEnergy Corp. Transfer of Pollution Control Revenue Bonds On October 4, 2007, FirstEnergy Solutions Corp.’s generation company subsidiaries (GenCos) closed on the issuance of $427 million of pollution control revenue bonds (PCRBs). Proceeds from the issuance will be used to redeem, during the fourth quarter, an equal amount of outstanding PCRBs originally issued on behalf of the Ohio Companies. This transaction brings the total amount of PCRBs transferred from the Ohio Companies and Penn Power to the GenCos to approximately $1.9 billion, with approximately $265 million remaining to be transferred. The transfer of these PCRBs supports the intra-system generation asset transfer that was completed in 2005. Nuclear Update On August 21, 2007, FirstEnergy Nuclear Operating Company (FENOC) announced plans to expand used nuclear fuel storage capacity at the Perry Nuclear Power Plant. The plan calls for installing above-ground, airtight steel and concrete cylindrical canisters, cooled by natural air circulation, to store used fuel assemblies. Initially, six canisters will be installed, with the capability to add up to 74 canisters as needed. Construction of the new fuel storage system, which is expected to cost approximately $30 million, is scheduled to begin in the spring of 2008, with completion planned for 2010. On October 24, the 911-megawatt Beaver Valley Unit 1 returned to service following completion of its regularly scheduled refueling outage that began on September 24. In late August, FENOC filed an application with the Nuclear Regulatory Commission (NRC) seeking renewal of the operating licenses for Beaver Valley Units 1 & 2 for an additional 20 years, which would extend the operating licenses to January 29, 2036, for Unit 1; and May 27, 2047, for Unit 2. The NRC accepted the application for review on October 24. Economic Development Award For the fourth time in the last five years, Site Selection magazine has selected FirstEnergy as one of the top utilities in the country for helping to promote economic development in its service area. The award is based upon economic development in four categories in 2006 – capital investment, job creation, capital investment per capita, and jobs per 10,000 in population – and gauges the ability of utility companies to help foster corporate investment in their service areas. FirstEnergy’s work with state and local development agencies helped attract more than $1.6 billion in capital investment and helped create nearly 11,500 new jobs throughout Ohio, Pennsylvania and New Jersey in 2006. Consolidated Report to the Financial Community –3rd Quarter 2007 12
  • 13. Forward-Looking Statements: This Consolidated Report to the Financial Community includes forward-looking statements based on information currently available to management. Such statements are subject to certain risks and uncertainties. These statements include declarations regarding our, or our management’s, intents, beliefs and current expectations. These statements typically contain, but are not limited to, the terms “anticipate,” “potential,” “expect,” “believe,” “estimate” and similar words. Forward-looking statements involve estimates, assumptions, known and unknown risks, uncertainties and other factors that may cause our actual results, performance or achievements to be materially different from any future results, performance or achievement expressed or implied by such forward-looking statements. Actual results may differ materially due to the speed and nature of increased competition in the electric utility industry and legislative and regulatory changes affecting how generation rates will be determined following the expiration of existing rate plans in Ohio and Pennsylvania, economic or weather conditions affecting future sales and margins, changes in markets for energy services, changing energy and commodity market prices, replacement power costs being higher than anticipated or inadequately hedged, the continued ability of FirstEnergy’s regulated utilities to collect transition and other charges or to recover increased transmission costs, maintenance costs being higher than anticipated, other legislative and regulatory changes including revised environmental requirements, the uncertainty of the timing and amounts of the capital expenditures needed to, among other things, implement the Air Quality Compliance Plan (including that such amounts could be higher than anticipated) or levels of emission reductions related to the Consent Decree resolving the New Source Review litigation or other potential regulatory initiatives, adverse regulatory or legal decisions and outcomes (including, but not limited to, the revocation of necessary licenses or operating permits and oversight by the Nuclear Regulatory Commission including, but not limited to, the Demand for Information issued to FENOC on May 14, 2007) as disclosed in our SEC filings, the timing and outcome of various proceedings before the PUCO (including, but not limited to, the Distribution Rate Cases and the generation supply plan filing for the Ohio Companies and the successful resolution of the issues remanded to the PUCO by the Supreme Court of Ohio regarding the Rate Stabilization Plan and the Rate Certainty Plan, including the deferral of fuel costs) and the PPUC (including the resolution of the Petitions for Review filed with the Commonwealth Court of Pennsylvania with respect to the transition rate plan for Met-Ed and Penelec), the continuing availability of generating units and their ability to continue to operate at or near full capacity, the ability to comply with applicable state and federal reliability standards, the inability to accomplish or realize anticipated benefits from strategic goals (including employee workforce initiatives), the ability to improve electric commodity margins and to experience growth in the distribution business, the ability to access the public securities and other capital markets and the cost of such capital, the outcome, cost and other effects of present and potential legal and administrative proceedings and claims related to the August 14, 2003 regional power outage, the risks and other factors discussed from time to time in our SEC filings, and other similar factors. The foregoing review of factors should not be construed as exhaustive. New factors emerge from time to time, and it is not possible for us to predict all such factors, nor can we assess the impact of any such factor on our business or the extent to which any factor, or combination of factors, may cause results to differ materially from those contained in any forward-looking statements. We expressly disclaim any current intention to update any forward- looking statements contained herein as a result of new information, future events, or otherwise. Consolidated Report to the Financial Community –3rd Quarter 2007 13