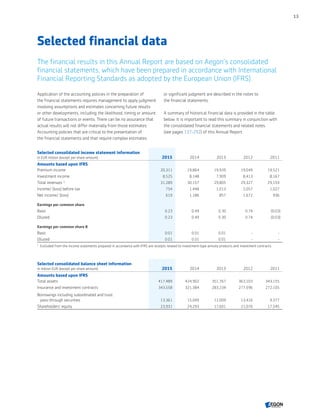
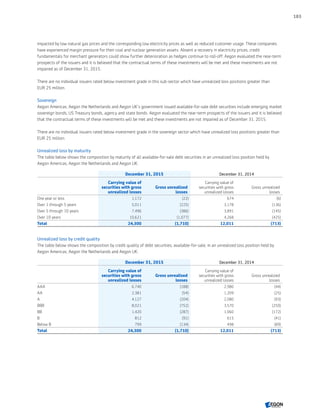
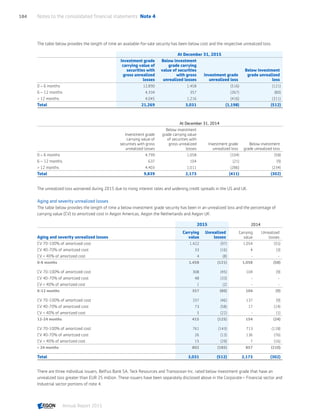
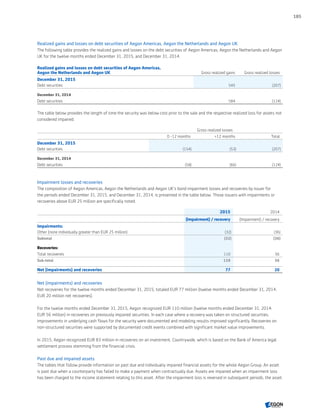
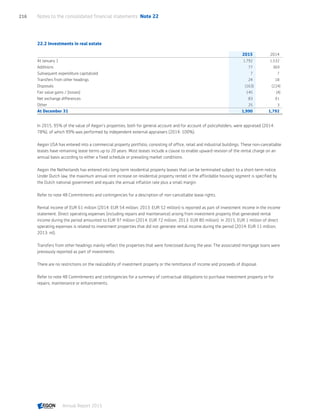
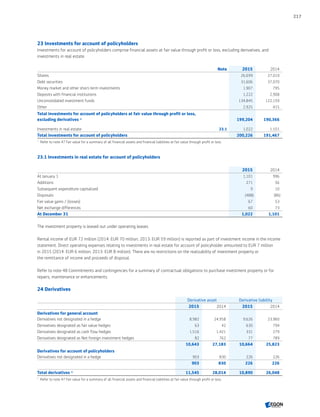
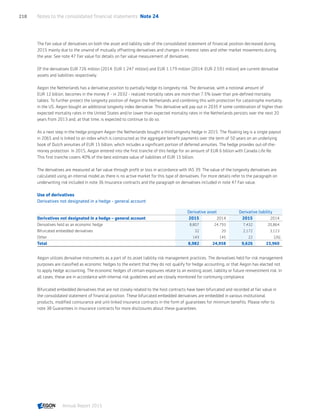
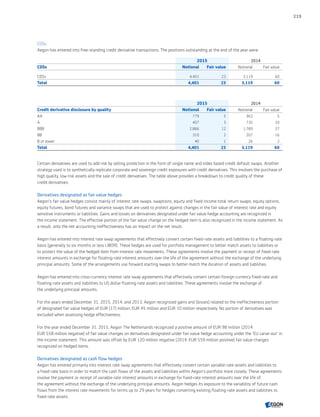
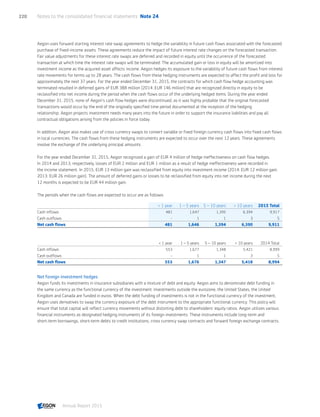
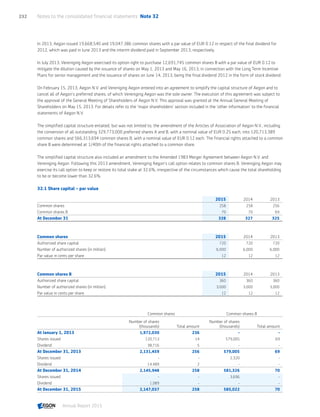
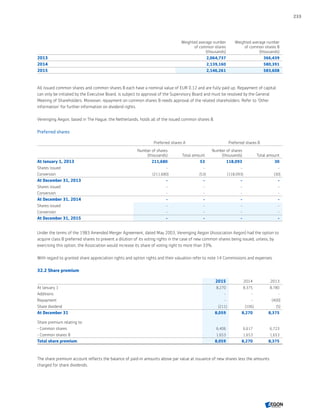
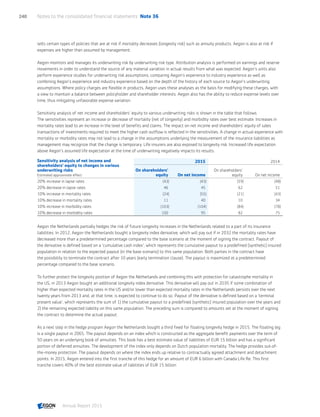
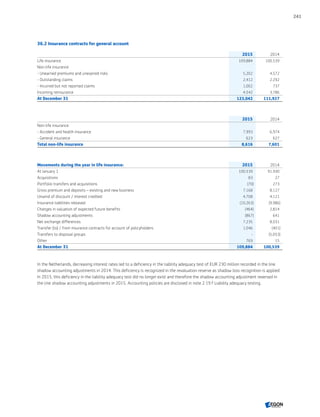
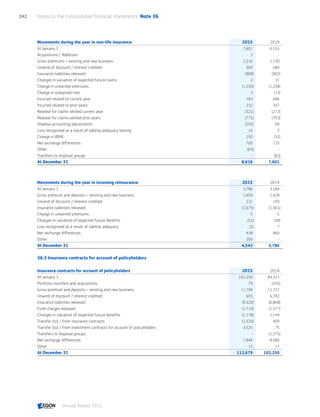
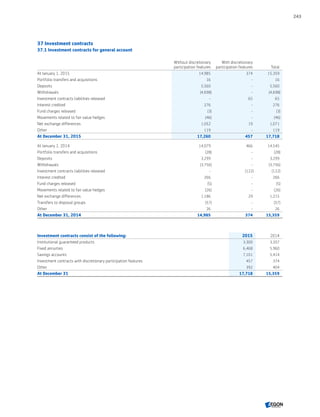
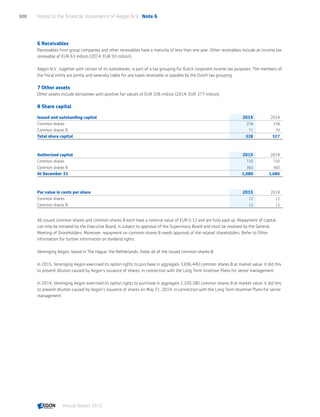
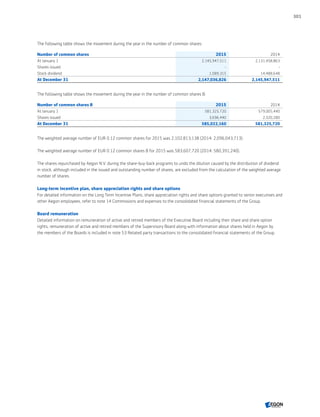
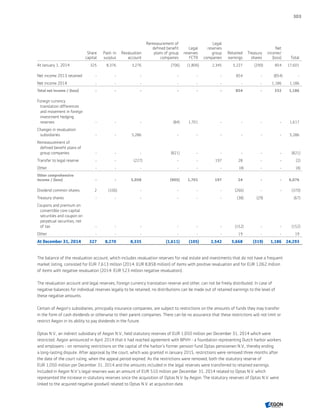
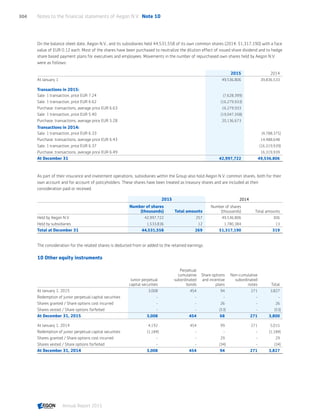
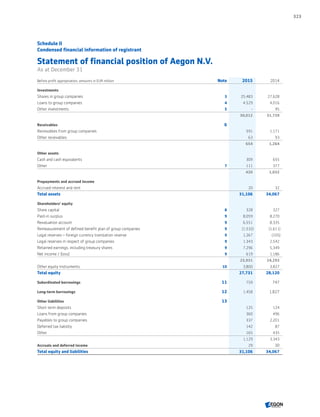
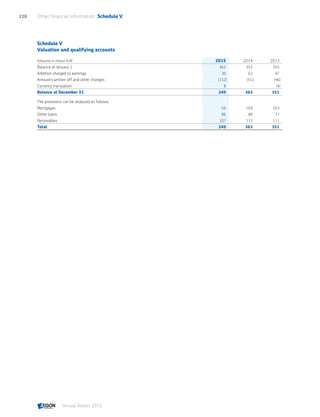
For the fifth consecutive year, Aegon's Annual Report is accompanied by a separate integrated report, Aegon's 2015 Review. This includes an interview with Aegon's CEO, Alex Wynaendts, in which he reflects on accelerating the pace of change to become a more digital, sustainable and customer-centric company. Also interviewed is the Chairman of Aegon's Supervisory Board, Rob Routs, who focuses on the board's shift from monitoring performance to undertaking a more strategic role. For more information, visit: http://www.aegon.com/en/Home/Investors/News-releases/2016/2015-Annual-Report/
Aegon's Annual Review 2015 explains how Aegon creates and shares value for its stakeholders by letting customers, investors, business partners, local communities and employees tell their story. It highlights three particularly important topics – raising awareness about global aging, meeting changing customer needs, and investing responsibly – all of which are explored in such a way as to explain both the challenges and opportunities that exist for Aegon. For more information, visit: http://www.aegon.com/en/Home/Investors/News-releases/2016/2015-Annual-Report/
The Lloyd's market had a profitable year in 2012, despite losses from Superstorm Sandy. It reported a profit before tax of £2,771m and a combined ratio of 91.1%. Gross written premium increased 9% to £25.5bn. Central assets reached a record high of £2.485bn. The Corporation reduced costs by 8% while making progress on strategic objectives. Looking ahead, Lloyd's aims to attract new capital and expand its global license network to access growth opportunities in developing economies.
Aviva plc third quarter 2013 interim management statementAviva plc
Mark Wilson, Group Chief Executive Officer, said:
“Progress is in line with our expectations and we remain focused on delivering cash flow plus growth. In the first nine months of 2013 our key measure of growth, value of new business, increased by 14%. We had strong performances from France and our growth markets of Turkey, Poland and Asia. Conversely, value of new business remains depressed in our turnaround businesses of Italy and Spain, and this is being addressed.
“Capital generation in the period was stable at £1.3 billion and our economic capital surplus now stands at £8 billion. We continue to make satisfactory progress on cost reduction, with operating expenses 10% below the 2011 baseline.
“Aviva remains in the early stages of turnaround. Whilst we have resolved a key issue in the disposal of our US business and have made progress in a number of areas, there remains much work to be done.”
Aviva plc Third Quarter 2014 Interim Management StatementAviva plc
Mark Wilson, Group Chief Executive Officer, said:
“Aviva’s turnaround is delivering. Our key metrics have improved again. Year to date, our net asset value is 10% higher; value of new business is up 15%1 and the general insurance combined ratio improved to 95.9%.
“The steps we have taken to focus and strengthen the Group mean we are in a different position to two years ago.
“Notwithstanding this progress, there is still more to do before we can be satisfied we are fully delivering on our investment thesis of cash flow plus growth.”
Aviva plc Annual Report and Accounts 2012Aviva plc
- Mark Wilson joined Aviva as Group CEO in January 2013 to lead the turnaround of Aviva.
- In 2012, under John McFarlane's leadership, Aviva made progress in focusing the business, strengthening its balance sheet, and improving performance through asset sales and restructuring. However, more work remains to be done.
- Wilson's priorities are to improve cash flows, earnings growth, and reduce leverage further. He aims to make Aviva a robust company with strong, predictable cash flows, diversified earnings and capital, and lower leverage.
Aviva plc annual report and accounts 2013Aviva plc
The document is Aviva plc's 2013 Annual Report. It summarizes that 2013 was a year of transformation for Aviva with a new management team appointed and significant changes made to narrow the business portfolio and focus on the most attractive segments. The operating performance improved with adjusted operating profit growing 6% and cost savings of £360 million delivered out of a £400 million target. The Chairman expresses confidence in the progress made but acknowledges there is still much to do. The Board declared a final dividend of 9.4p per share and introduced a dividend reinvestment plan.
Mark Wilson, Group Chief Executive Officer, said:
“In the first half we have taken a number of steps to deliver our investment thesis of cash flow and growth. These results show satisfactory progress in Aviva’s turnaround.
“We have achieved profit after tax of £776 million, in contrast to the £624 million loss last year. Cash flows to the Group have increased by 30% to £573 million. Our key measure of sales – value of new business – has increased 17%, driven by the UK, France, Poland, Turkey and Asia.
“Although these results continue the positive trends of the first quarter, tackling our legacy issues will take time.
“I am committed to achieving for investors what we set out to do: turning around the company to unlock the considerable value in Aviva.”
At Aviva, they help over 33 million customers save for the future and manage life's risks through businesses across 16 markets offering life insurance, retirement, savings and pensions, general insurance, health insurance, and asset management. Aviva has over 29,600 employees focused on helping customers overcome uncertainty. Their strategy is to focus on markets and segments where they can win, emphasize a digital-first customer experience, and meet all customer needs through life, general, health, and asset management products.
Aviva reported strong financial results for 2015, with total dividends up 38% over the last two years and operating profit up 20%. The integration of the Friends Life acquisition was completed ahead of schedule, creating savings of £225 million. Aviva now insures one in four UK households and paid over £30.7 billion in benefits and claims to customers in 2015. The company also has one of the strongest solvency ratios in the UK market at 180% and is well positioned for continued growth and customer focus in 2016.
Beazley delivered a strong financial performance in the first half of 2014, with profit before tax rising 61% over the equivalent period in 2013. Gross written premiums rose 1% to $1.077.7 million. The company saw more growth opportunities in smaller business lines underwritten locally in the US, where the number of underwriters has grown to 92. Specialty lines and property divisions performed well. The investment portfolio returned 1.1% for the period. The board declared an interim dividend of 3.1 pence per share, in line with a target of 5-10% annual dividend growth. The outlook for the remainder of 2014 is for continued growth in professional liability and management liability lines and smaller scale risks, led
Plus500 solomon capital report sample onlyDavid Solomon
Solomon Capital provides an analysis of Plus500 Ltd., an online trading platform for contracts for difference. Key points include:
- Revenues grew 105% to $115m in 2013 and are estimated to reach $155m in 2014. EBIT also grew substantially.
- Plus500 had a 5% share of the UK CFD market in 2013, and the company aims to increase its market share to 10% by 2016.
- A discounted cash flow valuation estimates Plus500's fair market value at £603m, significantly above its current market cap of £381m.
Aviva's Working Lives report - Issue 2, February 2013Aviva plc
The document provides an overview of a research report on employer and employee attitudes towards workplace pensions, savings, and benefits in the UK. It finds that while awareness of automatic enrollment reforms has increased, engagement remains a challenge, as many employees do not feel they can afford pension contributions. The report also finds differences in attitudes based on company size, with larger employers being further along in preparing for and managing automatic enrollment.
Dutch Residential Mortgage Market Update & the SAECURE programAegon
An update on the Dutch residential mortgage market, the Dutch economy, Aegon's mortgage business and its SAECURE program. The SAECURE program was initiated in 2000 and is managed by Aegon subsidiaries Aegon Levensverzekering N.V. and Aegon Hypotheken B.V.. Aegon's proven underwriting criteria and servicing have led to the high performance of outstanding SAECURE transactions.
Inflation drop gives over-55s an extra £1,032 a year in disposable income as ...Aviva plc
Falling inflation has given over-55s back their financial freedom and boosted saving habits as essential spending has fallen by 7% in a year, according to research from Aviva.
- Aviva's key metrics have improved in the first half of 2014, with cash remittances, operating profit, expenses, combined operating ratio and value of new business all increasing compared to the prior year.
- Operating expenses decreased 8% to £1,399 million due to cost savings initiatives. The operating expense ratio improved to 52.1%.
- Value of new business increased 9% to £453 million, with growth markets contributing 25% of the total.
- The combined operating ratio for general insurance improved to 95.5% and IFRS net asset value per share increased 7% to 290p.
Infographic outlining Aviva's five carbon investment commitments responding to climate risk and the need to limit global temperature increases to within 2 degrees C
Aegon reported disappointing underlying earnings this quarter, primarily due to adverse claims experience in the US. We maintained the strong momentum in growing our business profitably, despite the persistent low interest rate environment. Moreover, the record sales that we achieved across the company highlight the trust we enjoy from a growing number of customers who are choosing Aegon to help them secure their financial futures.
- Aviva's Solvency II ratio is 180% and its balance sheet is considered one of the strongest in the UK market.
- The integration of the Friends Life acquisition is ahead of schedule, with £168 million in synergies achieved to date and a target of £225 million by the end of 2016.
- Operating profits increased 20% to £2.7 billion for 2015, while operating EPS rose 2% despite foreign exchange headwinds.
- Aegon delivered solid underlying earnings of EUR 445 million in Q1 2013, though net income declined to EUR 204 million due to losses from equity hedging programs.
- New life sales increased 12% to EUR 499 million driven by strong pension sales in the UK and Netherlands.
- Aegon completed the restructuring of its Spanish business with the exit from its partnership with CAM.
The document provides a company profile of Legal & General Group Plc (L&G), a UK-based life insurer and asset manager. It summarizes L&G's business segments, distribution channels, organizational structure, financial highlights, and management. The largest business segments are LGIM (investment management), LGAS (savings and protection), and LGR (annuities). L&G distributes products through independent financial advisers, employee benefit consultants, and bancassurance partnerships. It has over 6 million customers and £433 billion in assets under management as of June 2013.
Investor Day 2009 - Regional business presentation UKAgeas
Fortis UK has a strong track record in the UK personal lines insurance market. It focuses on a 3-axis growth strategy of manufacturing a wider range of products, distributing through owned and third party channels, and leveraging its combined capabilities. Fortis has established market positions through multi-channel distribution, including brokers, direct channels, and affinity partnerships. It aims to continue growing through strategic initiatives such as expanding its product range and distribution partnerships.
2016 Annual General Meeting of Shareholders Aegon N.V.Aegon
Shareholders are invited to attend the 2016 Annual General Meeting of Shareholders (AGM) of Aegon N.V. on Friday May 20, 2016 at 10.00 a.m. at Aegon's head office in The Hague, the Netherlands.
- Underlying earnings increased to EUR 549 million due to growth in fee-based businesses and a stronger US dollar, partly offset by lower Life & Protection results in the Americas.
- Sales increased to EUR 2.4 billion, mainly driven by US retirement plans and asset management.
- Strong operational free cash flows of EUR 388 million and a solid excess capital position of EUR 1.5 billion support a dividend increase.
Aegon Q4 2013 Analysts, Investors and Media PresentationAegon
This document provides a summary of Aegon's Q4 2013 results. Key highlights include:
- Continued strong sales driven by growth in deposit businesses such as US variable annuities and pensions.
- A significant increase in the market consistent value of new business due to strong production and improved profitability.
- Solid growth in underlying earnings before tax.
- The dividend is supported by a strong capital position and cash flows.
This document provides a summary of Isaac Izeokhai Elakhe's career experience and qualifications. It details his over 15 years of experience in banking, financial services, capital markets, and pensions. Currently, he is a Manager of Operations at African Alliance Stockbrokers, where he is responsible for operations, compliance, risk management, and ensuring processes follow regulations. Previously he held roles like AGM of Operations at Zenith Pensions Custodian, focusing on investment management, monitoring, analysis, and compliance. He has multiple degrees and professional qualifications in relevant fields.
Eileen Reilly is a multi-faceted professional with over 30 years of experience in financial management, auditing, and operations roles in both the public and nonprofit sectors. She has extensive experience optimizing budgets, identifying efficiencies, and ensuring compliance with financial regulations. Her resume details roles managing budgets over $1 million at various organizations in Florida and New York.
Dr. Mohamed Yassin Mahgoub is a general practitioner and occupational medicine specialist with over 15 years of experience working in oil and gas, industrial zones, hospitals, and government ministries in Oman, Bahrain, Sudan, and the UAE. He has a diploma in occupational medicine from the Royal College of Physicians Ireland and is licensed to practice in the UAE, Bahrain, and Oman. Currently he works as an occupational health practitioner at Ahalia Hospital in Abu Dhabi, UAE.
Thon Duot Elijah is a South Sudanese national seeking a career in human resources management. He has over 10 years of experience in fields including banking, education, and nonprofit work. He holds a Master's degree in Human Resource Management and a Bachelor's degree in Sociology and Social Anthropology. He is currently employed as Head of Human Resources at Charter One Bank in South Sudan, where he oversees recruitment, training, and employee relations.
This document provides a summary of the 5th edition of the book "Cluster Analysis" by Brian S. Everitt, Sabine Landau, Morven Leese, and Daniel Stahl. The book provides a comprehensive guide to clustering techniques with a focus on practical applications. It covers new developments in clustering longitudinal data and provides examples from fields like bioinformatics and gene studies. It also updates the chapter on mixture models to include recent developments and presents a new chapter on mixture modelling for structured data. Practitioners and researchers working in cluster analysis and data analysis will benefit from this book.
Principal Financial Group is a Fortune 500 company that has been in business for 134 years. It provides retirement savings, investment, and insurance solutions to 19.1 million customers worldwide. It uses non-GAAP financial measures to evaluate performance in addition to GAAP measures. While these non-GAAP measures are useful for investors, they are not a substitute for GAAP measures. Principal Financial Group has over $456 billion in assets under management across its four business segments and has an experienced management team led by its long-tenured CEO.
Travel protocol safety and security tips msh_abraham ayomAbraham Ayom
The document provides safety and security tips for MSH staff traveling in South Sudan. It outlines important steps to take before, during, and after road trips, including leaving travel plans with supervisors, ensuring vehicles are in good condition, having maps and communication check-ins, and knowing alternate routes. It also lists essential items to pack like medical supplies and documents, as well as safety practices in hotels, out in public, and at airports like staying in secure areas and reporting any suspicious activity. The overall guidance is to be prepared, take basic precautions, and follow security protocols when traveling for work in South Sudan.
Sello Manyapye has over 30 years of experience in sales, marketing, business development, and operations management. He has a proven track record of growing revenue, expanding market share, and building client relationships. He is skilled in strategic planning, new business development, budget management, and key account management. His areas of expertise also include training, community relations, and risk analysis.
Kulwant Singh provides his curriculum vitae, including contact information, career objective, professional qualifications, educational qualifications, skills and experience. He has over 5 years of experience as an IT Technician for Trigyn Technologies and over 1 year of experience as an Engineer Facilities Management for SITeCos Solutions. His experiences include maintaining local area networks, configuring switches and routers, installing and upgrading various operating systems, and providing IT support.
Roger Pass is an experienced interior design director with over 30 years of experience working on residential and commercial projects in England, East Africa, and the Middle East. He has expertise in interior design, architecture, project management, and leading design teams. Some of his past roles include design director for various interior design firms where he oversaw projects from concept to completion.
CV - Samuel Munyuwiny - Child Rights Public health n ME - Aug 2016Munyuwiny Samuel
Samuel Munyuwiny has over 13 years of experience in child rights, child protection, public health, and monitoring and evaluation. He holds degrees in public health and has extensive experience designing and evaluating programs related to child rights, gender issues, HIV/AIDS, and health systems strengthening. Currently, he serves as the Executive Director of the African Institute for Children Studies, where he coordinates training, research, advocacy, and organizational development services related to children.
Osama Taha Salih is seeking a financial manager position in Kuwait, Qatar, Saudi Arabia, or the UAE. He has over 16 years of experience in financial management roles, currently working as the financial manager for Zad for Industry in Riyadh, Saudi Arabia. Salih has a Master's degree in accounting and finance from the University of Juba and certifications from the Association of Certified Project Accountants. He is proficient in Arabic and has intermediate English skills.
David Harry's CV outlines his personal and professional qualifications. He has a Bachelor's degree in Political Science and Public Administration from the University of Nairobi and seeks to build an innovative career using his skills and talents. His experience includes internships in solid waste management, marketing, and policy work. He has strong communication, leadership, and problem-solving abilities and is proficient in Microsoft Office.
This document provides a summary of Debra J. Millar's professional experience and expertise. She has over 25 years of experience in public health, education, organizational leadership and business development. Currently she is a lecturer at California State University Stanislaus teaching nursing students and also works as a consultant providing services in areas such as public health, leadership development, and program evaluation. Previously she held roles as Country Director for CHF International in Kenya and as a Medical Officer for the United States Peace Corps serving in several African countries.
OECD Public Sector Accruals Symposium - Giovanna DABBICCOOECD Governance
This presentation by Giovanna DABBICCO was made at the 14th Annual OECD Public Sector Accruals Symposium, Paris 3-4 March 2014. Find out more at http://www.oecd.org/gov/budgeting/14thannualoecdpublicsectoraccrualssymposiumparis3-4march2014.htm
This document is a resume for Debra J. Millar, who has over 22 years of experience in international public health, business development, and leadership. She currently works as an independent consultant providing technical expertise, training, and facilitation services in areas such as public health, leadership development, and strategic planning. Previously she held senior roles with CHF International, where she led the start-up of health programs in Kenya and Rwanda, managed a $10M program in Kenya, and oversaw expansion into other countries. She also has experience with the Peace Corps developing health programs and providing primary care.
This document provides an overview and summary of an investment stewardship handbook. It begins with an introduction that names the publisher, contributors, and technical reviewers. It then provides a brief summary of the contents and organization of the handbook. The handbook is intended to serve as a foundation for prudent investment practices for trustees and other fiduciaries. It provides an organized process for fiduciaries to make informed investment decisions in accordance with their legal duties of care and loyalty. The handbook also notes that fiduciaries must use professional judgment and consult experts as needed.
Abraham Ayom has over 10 years of experience working in finance and operations roles for various international NGOs and UN agencies in South Sudan. He has a Bachelor's degree in business administration and is currently pursuing an MBA. Ayom is proficient in several accounting software programs and has skills in areas such as budgeting, financial reporting, grants management, procurement, and human resources. He is currently seeking new opportunities to apply his expertise in financial management and international development.
This curriculum vitae outlines the educational and professional experience of Eltighani Mirghani Elamin. He has over 30 years of experience in agricultural economics and rural development, including experience managing projects in Africa, the Middle East, Central Asia, and Europe. He holds a PhD in Agricultural Economics and has worked with numerous international organizations, universities, and government bodies on projects related to food security, capacity development, and agricultural policy.
- Joyline Nyamayi is an experienced executive management professional with over 15 years of post-graduate financial management experience at strategic levels.
- She has exceptional experience dealing at executive and board levels, guiding stakeholders on financial and auditing matters.
- She is seeking finance positions like project/management accountant, fraud analyst, or internal auditor.
Bank of America Merrill Lynch Annual Financials CEO Conference presentation 2018Aegon
Aegon CEO Alex Wynaendts gives a presentation to the Bank of America Merrill Lynch Annual Financials CEO Conference in London on Tuesday, September 25, 2018.
Aegon CFO, Darryl Button provides an update on Aegon's successful strategy execution. For further information contact Aegon Investor Relations email: IR@aegon.com or Telephone + 31 70 344 83 05.
Annual General Meeting José Antonio Álvarez speechBANCO SANTANDER
Grupo Santander reported a 39% increase in profits in 2014 to €5.8 billion, with strong growth across most business units. Looking ahead, Santander expects a continued gradual global economic recovery but also tougher regulatory requirements. The bank will focus on improving profitability further through initiatives like gaining market share, boosting customer loyalty, and maintaining strict cost control while investing in technology and commercial activities.
Aegon Group Treasurer, Karen Wright provides an investor update on capital, cash and capital deployment, assumptions and sensitivities. For further information visit http://www.aegon.com/investors
Morgan Stanley European Financials Conference March 2014Aegon
The document discusses Aegon's strategy and financial results. Some key points:
- Aegon is focused on executing its strategy to become more customer-centric, which is delivering business growth and increased profitability.
- The company is making progress towards its 2015 targets, including growing underlying earnings by 7-10% annually and increasing operational free cash flow.
- Accounting changes will improve consistency and transparency, and are estimated to have a €2.2-2.5 billion negative impact on shareholders' equity but will reduce leverage over time.
The 2015 Annual Report comprises three documents that provide information on NN Group's performance:
1) The 2015 Annual Review provides an integrated, concise review of NN Group's strategy, performance, and future prospects.
2) The 2015 Financial Report covers NN Group's financial developments, annual accounts, and approach to risk management, capital management, and corporate governance.
3) The 2015 Sustainability Supplement provides additional information on NN Group's strategy, objectives and achievements regarding social, ethical, and environmental aspects.
- Santander delivered strong results in 2015, growing earnings, dividends, and capital organically. However, its share price has fallen, partly due to concerns over emerging markets like Brazil.
- Santander is well capitalized with a CET1 ratio of 12.55%, far above its minimum requirements, to prepare for Basel III standards. Its diversified business model provides stable earnings through economic cycles.
- Santander has a "moat" of competitive advantages including critical mass across its markets, trusted customer relationships, and geographic diversification that help protect its profits and market share over time.
Credit Suisse Group reported net income of CHF 959 million for Q4 2004 and CHF 5,628 million for full year 2004. Results were impacted by charges related to contingencies from the sale of Winterthur International, a loss on disposal of a minority holding, and severance costs. Private Banking, Corporate & Retail Banking, and Life & Pensions reported strong results. Institutional Securities saw improved performance driven by higher trading results and lower provisions and taxes. Wealth & Asset Management benefited from private equity gains.
The document is an annual report from The Warehouse Group that summarizes the company's performance in FY17 and outlines plans for transformation. Key points:
- FY17 adjusted net profit was $59.2 million, down 7.7% but above guidance. Group retail sales were $2,980.8 million, up 1.9%
- The company has accelerated change programs including restructuring and selling parts of the business in response to a weaker first half of FY17 and increasing disruption
- FY18 will see operational investment and costs to drive the company's transformation plan focusing on fixing retail fundamentals and investing in digital
- The board has full confidence in the leadership team and transformation plan
Update on Aegon's strategy, performance and positioning to maximize future opportunities. Presented by Aegon Investor Relations Officers, Bradley Roberts and Jan Willem Weidema. For further information contact Aegon Investor Relations email: IR@aegon.com or Telephone + 31 70 344 83 05.
Deutsche Börse AG held its annual press conference in 2014 to report on financial results for 2013 and discuss strategic plans. Key points:
- Net revenue was €1.9 billion and EBIT was €950 million, adjusted for one-time effects. The executive board proposes a dividend of €2.10 per share.
- While revenue was stable, investments in new growth areas lowered EBIT by 5%. Cost savings programs offset this.
- The company expanded market share in some areas and saw record volumes at Clearstream.
- Strategic focus remains on clearing OTC derivatives, collateral/liquidity management, and expanding in Asia through new partnerships and a Singapore clearing house.
- Deutsche
- The coronavirus pandemic significantly impacted the company's results in the first half of 2020. Revenue declined 2.2% due to rent relief provided to tenants.
- Center operating costs rose substantially by €17.9 million primarily due to higher write-downs of rent receivables totaling €19 million resulting from expected rent defaults and tenant insolvencies caused by the pandemic.
- Earnings before interest and taxes (EBIT) fell 20.1% to €78.5 million mainly due to the increase in rent receivable write-downs and lower revenue amid the pandemic.
Aegon Bank of America Merrill Lynch Financials ConferenceAegon
This document summarizes the CEO of Aegon's presentation at the Bank of America Merrill Lynch Financials Conference on October 1-2, 2014. The CEO discussed how Aegon is well positioned for growth, focusing on capturing opportunities in pension plans, increasing digital capabilities and improving efficiency. Aegon has achieved sales growth while reducing costs and is on track to meet its 2015 targets, positioning it for continued sustainable earnings growth.
Atento reported its third quarter 2015 results. Revenue grew 9.4% year-over-year to $476.2 million driven by growth in Latin America of 11.7%. Adjusted EBITDA increased 4.2% to $65.8 million, with margins of 13.8%. Adjusted EPS grew 35.4% to $0.31. Atento reaffirmed its full year 2015 guidance for revenue growth between 6-9% and adjusted EBITDA margins between 13-13.5%. While macroeconomic headwinds present challenges, Atento remains focused on its strategic initiatives to drive growth, operational excellence, and strengthen its competitive position.
This document summarizes Ameriprise Financial's fourth quarter 2006 earnings conference call. It discusses strong adjusted revenue, earnings, and return on equity growth for both the quarter and full year. The separation from American Express is on track. Brand awareness has increased and distribution capabilities have been strengthened through advisor productivity improvements and growth in fee-based assets and clients.
The document provides an interim report from Lombard Risk Management plc for the first half of 2014. Key points include:
- Revenue increased 27.7% to £9.3 million compared to the same period last year.
- 121 contracts have been signed for the European Banking Authority's COREP regulatory reporting requirements.
- EBITDA was £0.8 million compared to a loss of £0.02 million last year.
- The company continues to invest in developing software solutions for regulatory compliance and risk management.
Coca-Cola HBC si-a publicat recent cel de-al treilea raport integrat la nivel de grup. Acesta contine informatii referitoare la aspecte de business, dar si detalii despre performantele de sustenabilitate si guvernanta corporativa ale companiei.
The document is the transcript of an earnings conference call for a financial services company. In the call, the Chairman and CEO provides an overview of the company's financial results for the second quarter, noting that while earnings were down year-over-year due to market impacts, the company's business fundamentals remain solid. The CFO then begins to discuss the financial details but is cut off in the transcript.
“After three years of turnaround we are now moving to a different phase of delivery. We have improved the balance sheet, simplified the Group and we are now transforming our business. The progress is evident in these results.
“The Friends Life integration is ahead of schedule and we have delivered £63 million of run-rate synergies after three months. This is encouraging but nowhere near complete. Amidst the integration, our UK Life business continued to grow, with value of new business up 31% excluding Friends Life.
“In general insurance, premiums and operating profits were higher. The combined ratio was 93.1%, the best in eight years, and underwriting profits increased 45%.
“The 15% increase in the dividend is a further step towards achieving our target payout ratio and underlines our confidence in our cash flow and the business.”
With roots stretching back almost 200 years, Aegon is one of the world's leading providers of life insurance, pensions and asset management. Find out more about our history, markets, performance, and our commitment to sustainability and responsible investment.
Aegon published its 3Q 2021 financial results on November 11 2021. In this presentation CEO Lard Friese and CFO Matt Rider outline the key facts and figures for the review period and outline the company's strategy.
Aegon published its 2Q 2021 financial results on August 12, 2021. In this presentation CEO Lard Friese and CFO Matt Rider outline the key facts and figures for the review period and outline the company's strategy.
Bank of America Merrill Lynch Conference, September 2019Aegon
Delivering in a world of extremes - a presentation on Aegon's performance and strategy given by CEO Alex Wynaendts to the Bank of America Merrill Lynch Conference in London on September 25, 2019.
Aegon published its 1H 2019 financial results on August 15, 2019. In this presentation CEO Alex Wynaendts and CFO Matt Rider outline the key facts and figures for the review period and outline the company's strategy.
Aegon 2h 2018 results and new targets presentationAegon
Aegon published its 2H 2018 financial results on February 14, 2019. In this presentation CEO Alex Wynaendts and CFO Matt Rider outline the key facts and figures for the review period and outline the strategy behind Aegon's new financial targets for 2019-2021.
Aegon concluded 2017 with solid fourth quarter results. The company's Solvency II ratio improved significantly to 201% due to strong capital generation of EUR 2.1 billion in 2017. Aegon outsourced administration of its US life and annuity businesses to TCS, which is expected to generate annual expense savings of USD 70-100 million. The company exceeded its target to reduce capital allocated to run-off businesses by nearly USD 5 billion since 2009. Aegon continues its transformation with increased focus on digitization.
The document summarizes Aegon's strong 3Q 2017 results. Key highlights include:
- Underlying earnings increased 20% driven by improved claims experience, higher fee revenue from favorable markets, and lower expenses.
- Return on equity improved to 8.9% and group solvency ratio increased significantly to 195%.
- Sales were driven by record gross deposits resulting from growth of fee-based businesses.
Aegon Americas: Leveraging leading positions in workplace and individual solu...Aegon
Joe Boan (Workplace & Individual Markets), Scott Ramey, (Workplace Solutions) and Phil Eckman (Customer Experience & Advice) provide an update on how Transamerica is leveraging leading positions in Workplace & Individual Solutions.
Aegon Americas: Simplifying and optimizing businessAegon
Blake Bostwick, Chief Operations Officer at Transamerica, and David Montgomery, Head of Individual Operations, provide an update on how Aegon is simplifying and optimizing its business in the US.
Aegon Americas: Sustainably growing capital generationAegon
Helping people achieve lifetime financial security. The document discusses Aegon Americas' strong capital position which supports growth and remittances to the holding company. Key points include:
- The capital position is above target levels despite regulatory changes through active management.
- The long-term care block is actively managed with multiple levers to control profitability and has developed in line with expectations.
- A consistent track record of high remittances to the holding company is expected to continue, supported by sustainable capital generation.
Transamerica is strongly positioned to accelerate growth and achieve its 2018 financial targets. It has successfully executed its 5 part plan, delivering on its 9% Return on Capital target two quarters early and exceeding its capital targets. Transamerica will now invest in modernization and growth initiatives to drive approximately $100 million in increased expenses in 2019 and further strengthen its competitive position. These initiatives include partnering with TCS to improve technology and customer experience, leveraging data and analytics, and focusing on key growth areas like Wealth + Health, Workplace Solutions, and Individual Solutions.
Alex Wynaendts, Aegon’s CEO, provides an update at the Analysts & Investors conference in New York on the progress made executing the company’s strategy and delivering on financial targets.
With roots stretching back almost 200 years, Aegon is one of the world's leading providers of life insurance, pensions and asset management. Find out more about our history, markets, performance, and our commitment to sustainability and responsible investment.
The Aegon SAECURE program has issued 15 residential mortgage-backed securities transactions since 2000 to diversify funding for Aegon's Dutch residential mortgage portfolio. The SAECURE portfolios exhibit stable historical performance with low and declining arrears levels, demonstrating the representative quality of Aegon's total Dutch mortgage loan book.
What Aegon employees say on International Women's Day 2018Aegon
The document discusses the importance of diversity and inclusion at Aegon, highlighting perspectives from various employees. It notes that diversity allows the company to better serve its diverse customer base and drives innovation. Several individuals emphasize that both women and men should have equal opportunities to achieve their full potential and that diverse teams are stronger and more creative.
Aegon concluded 2017 with solid fourth quarter results. The company's Solvency II ratio improved significantly to 201% due to strong capital generation of EUR 2.1 billion in 2017. Aegon outsourced administration of its US life and annuity businesses to TCS, which is expected to generate annual expense savings of USD 70-100 million. The company exceeded its target to reduce capital allocated to run-off businesses by nearly USD 5 billion since 2009. Aegon continues its transformation with increased focus on digitization.
Aegon reported strong financial results for the full year 2017, with underlying earnings of 3.9 billion euros. The CEO stated that 2017 concluded a strong year for the company. Key highlights included improving employee engagement through diversity initiatives and surveys, launching new affordable housing funds and investing in technologies to support business growth while divesting non-core parts of the US business.
Solution Manual For Financial Accounting, 8th Canadian Edition 2024, by Libby...Donc Test
Solution Manual For Financial Accounting, 8th Canadian Edition 2024, by Libby, Hodge, Verified Chapters 1 - 13, Complete Newest Version Solution Manual For Financial Accounting, 8th Canadian Edition by Libby, Hodge, Verified Chapters 1 - 13, Complete Newest Version Solution Manual For Financial Accounting 8th Canadian Edition Pdf Chapters Download Stuvia Solution Manual For Financial Accounting 8th Canadian Edition Ebook Download Stuvia Solution Manual For Financial Accounting 8th Canadian Edition Pdf Solution Manual For Financial Accounting 8th Canadian Edition Pdf Download Stuvia Financial Accounting 8th Canadian Edition Pdf Chapters Download Stuvia Financial Accounting 8th Canadian Edition Ebook Download Stuvia Financial Accounting 8th Canadian Edition Pdf Financial Accounting 8th Canadian Edition Pdf Download Stuvia
Abhay Bhutada, the Managing Director of Poonawalla Fincorp Limited, is an accomplished leader with over 15 years of experience in commercial and retail lending. A Qualified Chartered Accountant, he has been pivotal in leveraging technology to enhance financial services. Starting his career at Bank of India, he later founded TAB Capital Limited and co-founded Poonawalla Finance Private Limited, emphasizing digital lending. Under his leadership, Poonawalla Fincorp achieved a 'AAA' credit rating, integrating acquisitions and emphasizing corporate governance. Actively involved in industry forums and CSR initiatives, Abhay has been recognized with awards like "Young Entrepreneur of India 2017" and "40 under 40 Most Influential Leader for 2020-21." Personally, he values mindfulness, enjoys gardening, yoga, and sees every day as an opportunity for growth and improvement.
Lecture slide titled Fraud Risk Mitigation, Webinar Lecture Delivered at the Society for West African Internal Audit Practitioners (SWAIAP) on Wednesday, November 8, 2023.
1. Elemental Economics - Introduction to mining.pdfNeal Brewster
After this first you should: Understand the nature of mining; have an awareness of the industry’s boundaries, corporate structure and size; appreciation the complex motivations and objectives of the industries’ various participants; know how mineral reserves are defined and estimated, and how they evolve over time.
In a tight labour market, job-seekers gain bargaining power and leverage it into greater job quality—at least, that’s the conventional wisdom.
Michael, LMIC Economist, presented findings that reveal a weakened relationship between labour market tightness and job quality indicators following the pandemic. Labour market tightness coincided with growth in real wages for only a portion of workers: those in low-wage jobs requiring little education. Several factors—including labour market composition, worker and employer behaviour, and labour market practices—have contributed to the absence of worker benefits. These will be investigated further in future work.
Abhay Bhutada Leads Poonawalla Fincorp To Record Low NPA And Unprecedented Gr...Vighnesh Shashtri
Under the leadership of Abhay Bhutada, Poonawalla Fincorp has achieved record-low Non-Performing Assets (NPA) and witnessed unprecedented growth. Bhutada's strategic vision and effective management have significantly enhanced the company's financial health, showcasing a robust performance in the financial sector. This achievement underscores the company's resilience and ability to thrive in a competitive market, setting a new benchmark for operational excellence in the industry.
Vicinity Jobs’ data includes more than three million 2023 OJPs and thousands of skills. Most skills appear in less than 0.02% of job postings, so most postings rely on a small subset of commonly used terms, like teamwork.
Laura Adkins-Hackett, Economist, LMIC, and Sukriti Trehan, Data Scientist, LMIC, presented their research exploring trends in the skills listed in OJPs to develop a deeper understanding of in-demand skills. This research project uses pointwise mutual information and other methods to extract more information about common skills from the relationships between skills, occupations and regions.
The Rise of Generative AI in Finance: Reshaping the Industry with Synthetic DataChampak Jhagmag
In this presentation, we will explore the rise of generative AI in finance and its potential to reshape the industry. We will discuss how generative AI can be used to develop new products, combat fraud, and revolutionize risk management. Finally, we will address some of the ethical considerations and challenges associated with this powerful technology.
Seminar: Gender Board Diversity through Ownership NetworksGRAPE
Seminar on gender diversity spillovers through ownership networks at FAME|GRAPE. Presenting novel research. Studies in economics and management using econometrics methods.
2. This page has been intentionally left blank.
II
Annual Report 2015 CONTENTS
3. Table of contents
Strategic information
Introduction5
CEO letter 6
Composition of the Executive Board
and the Management Board8
Aegon’s strategy 10
Business overview
History and development of Aegon 12
Selected financial data 13
Business lines 16
Results of operations 18
Worldwide18
Americas26
The Netherlands 42
United Kingdom 53
New Markets 62
Risk management 85
Capital and liquidity management 89
In control statement 93
Regulation and Supervision 94
Governance
Report of the Supervisory Board 98
Members of the Supervisory Board 106
Remuneration Report 108
Corporate governance 116
Differences between Dutch and US company laws 120
Code of ethics 121
Controls and procedures 122
Consolidated financial statements
of Aegon N.V.
Exchange rates 128
Consolidated income statement of Aegon N.V. 130
Consolidated statement of comprehensive income
of Aegon N.V.131
Consolidated statement of financial position of Aegon N.V. 132
Consolidated statement of changes in equity of Aegon N.V. 133
Consolidated cash flow statement of Aegon N.V. 136
Notes to the consolidated financial statements 137
Remuneration286
Financial statements of Aegon N.V.
Income statement of Aegon N.V. 294
Statement of financial position of Aegon N.V. 295
Notes to the financial statements 296
Independent auditor’s report 309
Other information
Proposal for profit appropriation 318
Major shareholders 319
Other financial information
Schedule I 322
Schedule II 323
Schedule III 325
Schedule IV 327
Schedule V 328
Additional information
Compliance with regulations 330
Risk factors 331
Property, plant and equipment 351
Employees and labor relations 351
Dividend policy 352
The offer and listing 353
Memorandum and Articles of Association 354
Material contracts 355
Exchange controls 356
Taxation356
Principal accountant fees and services 362
Purchases of equity securities by the issuer
and affiliated purchasers364
Quarterly results – unaudited 365
Glossary366
Disclaimer371
Contact373
3
This pdf is interactive. The content is clickable so you can navigate through this document.
CONTENTS
4. This page has been intentionally left blank.
4
Annual Report 2015 CONTENTS
5. Introduction
About this report
This report serves as Aegon’s Annual Report for the year ended
December 31, 2015. It presents the consolidated financial
statements of Aegon (pages 130-292) and the stand-alone
financial statements of Aegon N.V. (pages 294-308), both
prepared in accordance with the International Financial Reporting
Standards (IFRS) as adopted by the European Union, and Part 9
of Book 2 of the Dutch Civil Code.
Aegon N.V. is referred to in this document as 'Aegon', or
'the Company', and is together with its member companies
referred to as 'Aegon Group' or 'the Group'. For such purposes,
'member companies' means, in relation to Aegon N.V., those
companies required to be consolidated in accordance with
the Netherlands legislative requirements concerning relating
to consolidated accounts.
Presentation of certain information
References to the 'NYSE' are to the New York Stock Exchange
and references to the SEC are to the US Securities and Exchange
Commission. Aegon uses 'EUR' and 'euro' when referring to
the lawful currency of the member states of the European
Monetary Union; 'USD', and 'US dollar' when referring to
the lawful currency of the United States of America; 'GBP',
'UK pound' and 'pound sterling' when referring to the lawful
currency of the United Kingdom; 'CAD' and 'Canadian dollar' when
referring to the lawful currency of Canada; 'CNY' when referring
to the lawful currency of the People's Republic of China; 'CZK'
when referring to the lawful currency of the Czech Republic,
'HUF' when referring to the lawful currency of Hungary; 'PLN'
when referring to the lawful currency of Poland; 'RON' when
referring to the lawful currency of Romania; 'TRY' when referring
to the lawful currency of Turkey, and 'UAH' when referring to
the lawful currency of Ukraine.
5
CONTENTS
6. CEO letter
2015 was a year in which we made significant progress in the execution of our
strategy. Our operational and financial successes are ultimately the result of
customers placing their trust in Aegon, and I’m proud that we are helping millions
of people achieve a lifetime of financial security.
Once again, one of the key highlights of the year was the very
strong and profitable sales we generated across the Company,
which are up by 24% on 2014. Moreover, I am pleased that we
have seen a 12% year-on-year increase in sales over the last five
years, and this success underlines the continued progress Aegon
has made to connect with customers in new ways – including
through our new and innovative digital propositions.
While we had strong results in terms of sales, it was
a challenging year from an earnings perspective and I am
disappointed that our results – in particular those in the US –
did not meet our expectations. The main cause of this decline
in earnings was the adverse effect from model updates and
assumption changes. These included the impact of changes
in customer behavior, the effect of which was exacerbated
by the low interest rate environment. We have taken actions
to mitigate this adverse effect and remain committed to
generating attractive returns.
Adapting to change
The global economic climate continues to present challenges
for the insurance sector. Credit conditions worsened in 2015
as world oil prices reached their lowest point in over a decade.
While the gradual upturn in the US economy was a positive sign,
the economic growth outlook in the US remains mixed and below
that of the pre-crisis level. Similarly, although measures to
stimulate the eurozone economy had a positive effect on
the outlook for the region, conditions for insurers became more
challenging as interest rates dropped to historic lows. In this
challenging environment Aegon remains well positioned for
the future. The transformation in our business over the last five
years, from one reliant largely on spread businesses to one
focused on fee and technical income, makes us a stronger and
more resilient franchise going forward.
Transforming our business
2015 was the final year of a five-year strategy cycle at
the Company. As pleasing as it was to not only meet, but exceed,
our targets for operational free cash flows and fee-based
earnings, I am disappointed that we did not achieve our targets
for return on equity and earnings growth. In January 2016, we
updated the market on our strategy and the steps we are taking
to continue to improve our operational performance. Central
to this is the announcement that we will further reduce our
expenses by EUR 200 million over the next three years.
In parallel, we will focus on developing a life-long relationship
with our customers so that we can serve their financial needs
at all the major financial junctures in their lives; rather than on
a one-off basis. In order to accomplish this, we need to get much
closer to our customers and connect with them how and when
they wish. To this end, we will step up our work to provide
guidance and advice to customers and accelerate our investments
in digital solutions.
Focusing on value creation
We continued to make progress in the optimization of our
portfolio, allocating capital to those businesses that create value
and growth in order to deliver on our financial targets and
strategy. 2015 saw the divestment of a number of non-core
activities, including our life insurance business in Canada,
Clark Consulting and our joint venture with La Mondiale in France,
freeing up close to a billion euros of capital. In terms of
reinvesting our capital, two transactions that we secured are
particularly exciting: first, the creation of a strategic partnership
with La Banque Postale Asset Management, the fifth largest
asset manager in France with over 10 million customers; and
second, the acquisition of Mercer’s record keeping business,
which makes Aegon one of the top five in the US pension
administration market, with approximately 5 million plan
participants. Both of these deals illustrate how we are reaching
new customers by enhancing our distribution networks and
teaming up with market leaders.
Strategic information CEO letter6
Annual Report 2015 CONTENTS
7. Navigating a complex regulatory landscape
While regulation of our industry is changing rapidly and
compliance costs are rising, with the right business model these
changes represent a clear opportunity. Indeed, Aegon has the
added competitive advantage of knowing how to operate
in rapidly changing markets due to its global presence.
Preparations for the European Union Solvency II Directive were
a considerable undertaking throughout the year. Gaining approval
for Aegon’s internal model in the Netherlands and the United
Kingdom in December was a significant achievement, and our
strong capital position was reflected in the fact that all our major
business units are above their respective target levels. I am
pleased that our estimated group Solvency II ratio of 160% is
in the upper end of our target range, meaning we are in a strong
position to return capital to our shareholders. Our strong capital
position enabled us to announce a share buyback of
EUR 400 million, and to increase the dividend yet again
– this year by 9% – in line with our dividend policy of having
a sustainable and growing dividend.
In November, Aegon was designated as one of a group of nine
Global Systemically Important Insurers (G-SII) by the Financial
Stability Board (FSB). We are engaging with supervisors with
regard to the G-SII Framework, and while some implications of
G-SII designation are not clear, we are making progress on
the plans we need to develop.
Our communities and our employees
Although this report provides a comprehensive overview of
Aegon’s financial activities, we take the impact we have on
the communities in which we operate, wider society and
the environment very seriously. For this reason, we are pleased to
also publish an annual review, which is available on aegon.com.
This explains our social, economic and environmental performance
and impacts, together with outlining how we create value for
our stakeholders.
I am proud to work alongside over 31,500 talented colleagues
who are dedicated to making a difference and who share my
passion for our purpose – to help people achieve a lifetime of
financial security. On behalf of the Management Board I would
like to express my sincere thanks for all their hard work and
commitment. Furthermore, I would like to thank Aegon’s many
shareholders for placing their trust in the company. Without their
support and investment, we would not be able to deliver on
the promises we make to our 30 million customers around
the world.
Looking to the future
Aegon is, I believe, well positioned to take advantage of the many
opportunities in our markets by connecting with ever more
customers and meeting their needs in a smooth and seamless
way across their lifetimes. This gives me confidence that Aegon
will achieve its strategic and financial objectives, and also create
long-term value for customers and therefore shareholders alike.
Thank you for your support and interest in our company.
Alex Wynaendts
Chief Executive Officer and Chairman of the Executive Board
of Aegon N.V.
7
CONTENTS
8. Composition of the Executive Board
and the Management Board
Alex Wynaendts (1960, Dutch)
Chief Executive Officer
Chairman of the Executive Board
Chairman of the Management Board
Alex Wynaendts began his career in 1984 with ABN AMRO Bank,
working in Amsterdam and London in the Dutch bank’s capital
markets, asset management, corporate finance and private
banking operations. In 1997, Mr. Wynaendts joined Aegon
as Senior Vice President for Group Business Development.
He was appointed as a member of the Executive Board in 2003,
overseeing the Company’s international growth strategy.
In April 2007, Mr. Wynaendts was named Aegon’s Chief Operating
Officer, and has been CEO and Chairman of the Executive Board
and Management Board since April 2008. Mr. Wynaendts was
reappointed as member of the Executive Board at the Annual
General Meeting of Shareholders of Aegon N.V. on May 20, 2015.
His third and final term of office will end in 2019.
Darryl Button (1969, Canadian)
Chief Financial Officer
Member of the Executive Board
Member of the Management Board
Darryl Button began his career at Mutual Life Insurance Co. of
Canada, joining Aegon in 1999 as Director of Product Development
and Risk Management at Aegon USA's Institutional Markets
business unit. He was appointed Corporate Actuary of Aegon USA
in 2002 and became CFO of Aegon Americas in 2005. From 2008
to 2011, Mr. Button also took on the responsibilities of Chairman
and executive management of Aegon’s Canadian operations,
before joining Aegon’s Corporate Center in 2012 as Executive
Vice President and Head of the Corporate Financial Center.
In 2013, Mr. Button was appointed as CFO and as a member
of the Executive Board of Aegon. He is also a member of
the Management Board.
Adrian Grace (1963, British)
Chief Executive Officer of Aegon UK
Member of the Management Board
Adrian Grace began his career with Leeds Permanent Building
Society in 1979, before joining Mercantile Credit in 1984.
In 2001, Mr. Grace joined Sage Group PLC as Managing Director
of the Small Business Division. In 2004, he moved to Barclays
Insurance as Chief Executive, before joining HBOS in 2007 as
Managing Director of Commercial Business within the Corporate
Division. In 2009, he joined Aegon UK as Group Business
Development Director and in April 2011 became the Chief
Executive Officer. Mr. Grace has been a member of Aegon’s
Management Board since February 2012.
Tom Grondin (1969, Canadian)1
Chief Risk Officer of Aegon N.V.
Member of the Management Board
Tom Grondin was appointed Chief Risk Officer of Aegon N.V.
in 2003 and as a member of Aegon’s Management Board in
January 2013. His current responsibilities include managing
Aegon’s Risk, Actuarial, Compliance and Risk Structuring and
Transfer functions. He joined Aegon USA’s Institutional Markets
business unit in 2000, where he was Chief Actuary. Prior to
joining Aegon, he was a consultant at Tillinghast-Towers Perrin,
and an asset liability manager at Manulife Financial.
1 Tom Grondin was appointed as Chief Financial Officer, Aegon Asia, effective January 1, 2016. Allegra van Hövell-Patrizi joined Aegon on
January 1, 2016 as Group Chief Risk Officer, and member of the Management Board.
Strategic information Composition of the Executive Board and the Management Board8
Annual Report 2015 CONTENTS
9. Marco Keim (1962, Dutch)
Chief Executive Officer of Aegon the Netherlands
Member of the Management Board
Marco Keim began his career with accountants Coopers
Lybrand/Van Dien. He has also worked for aircraft manufacturer
Fokker Aircraft and NS Reizigers, part of the Dutch railway
company, NS Group. In 1999, he joined Swiss Life in
the Netherlands as a board member. Three years later, Mr. Keim
was appointed CEO. In June 2008, he became CEO of Aegon
the Netherlands and a member of Aegon’s Management Board.
Gábor Kepecs (1954, Hungarian)
Chief Executive Officer of Aegon Central Eastern Europe
Member of the Management Board
Gábor Kepecs began his career with the Hungarian government
before joining former state-owned insurance company
Állami Biztosító. He was appointed CEO in 1990, two years
before Állami Biztosító was privatized and acquired by Aegon.
Mr. Kepecs was the CEO of Aegon Hungary from 1992 to 2009,
during which time he headed the expansion of Aegon’s
businesses not only in Hungary, but also across the Central
Eastern European region. Mr. Kepecs has been a member of
Aegon’s Management Board since 2008.
Mark Mullin (1963, American)
Chief Executive Officer of Aegon Americas
Member of the Management Board
Mark Mullin has spent more than 20 years with Aegon in various
investment and business management positions in both
the United States and Europe. Mr. Mullin has served as President
and CEO of one of Aegon’s US subsidiaries, Diversified Investment
Advisors, and as head of the Company’s annuity and mutual fund
businesses. He was named President of Aegon Americas in 2009,
and became President and CEO of Aegon Americas and a member
of the Management Board in 2010.
9
CONTENTS
10. Aegon’s strategy
Achievements since 2011
In 2011, Aegon embarked on a strategic direction based on
the following objectives: to get closer to customers by addressing
their financial needs across the various stages of their lives; to
leverage technology to improve service and customer experience,
while also reducing expenses in order to remain competitive; and
to focus on protection and accumulation needs in emerging
markets, and on accumulation and post-retirement needs in
developed markets.
Since this time, the profile of the Company has been transformed
by refocusing the Group on fee business. Key accomplishments
include: divesting non-core businesses, such as Transamerica’s
Reinsurance business, a number of joint ventures in Spain,
La Mondiale in France, and the Company’s Canadian life insurance
business; creating a successful asset management business;
significantly reducing expenses, while investing in new digital
business models, e.g. Knab in the Netherlands and Aegon’s
retirement platform in the UK; and increasing the number of
customers that place their trust in Aegon to 30 million.
Key drivers for change
Going forward, it is necessary to constantly anticipate changes in
Aegon’s business environment. This environment is being shaped
by a number of trends:
Low interest rates, which may persist for a longer period
than anticipated;
The shift from state and corporate benefits to individuals
taking responsibility for their own privately-funded plans;
Reduced accessibility to traditional financial advice for
the middle market and mass-affluent customer segments;
Increased competition due to the blurring of boundaries
between insurers, banks, asset managers, distributors, and
other (new) non-traditional entrants into the financial services
industry following regulatory and technology developments;
Shifting consumer demand towards digital first, multi-channel
access, and personalized offerings;
Increasing customer expectations for greater transparency,
simplicity, and superior service; and
A regulatory environment that increases complexity across
all lines of business and puts pressure on returns.
Aegon’s ambition
Aegon’s purpose – to help people achieve a lifetime of financial
security – forms the basis of the Company’s strategy. The central
focus of the strategy is to further change the Company by
shifting from a product-based company to a customer need-
driven one. This means serving diverse and evolving needs across
the customer life cycle (‘right time, right solution’); aligning
Aegon’s brand promise with being a trusted partner for financial
solutions that are relevant, simple, rewarding, and convenient;
and developing long-term customer relationships by providing
guidance and advice, and identifying additional financial security
needs at every stage of customers lives.
The aim of Aegon’s strategy is that the Company be a truly
international enterprise with a common culture across its
businesses of working together; that Aegon’s respective
businesses learn from each other and replicate best practices to
benefit customers; that it recognizes and addresses opportunities
in rapidly changing markets in a timely and nimble way; and that
it attracts, develops, and retains the best people who share its
values and are committed to its purpose.
In order to do so, Aegon will focus on reducing complexity,
eliminating duplication, improving accuracy, and increasing
automation to realize cost efficiencies, allowing investments
in its transformation to a digitally enabled, customer-centric
company. Furthermore, the Company will focus on driving scale
and establishing strong market positions in its current footprint,
and strictly adhering to comprehensive standards that support
the efficient use of capital by all businesses. The different market
segments, the different geographies, and the different starting
positions of Aegon’s businesses nonetheless mean that they will
experience different paths to meet the same goals. Expertise and
knowledge available in Aegon’s established markets will be
utilized to position its businesses in emerging markets.
In summary, it is Aegon’s ambition to be regarded as a trusted
partner for financial solutions at every stage of life in all its
markets. That means: being recognized by its customers, business
partners, and society as a company that puts the interests of its
customers first in all that it does; and being regarded as an
employer of choice by employees, engaging and enabling them
to succeed. In addition, the Company will strive to generate
the returns, earnings, and dividends that fulfil shareholders’
expectations.
Strategic information Aegon’s strategy10
Annual Report 2015 CONTENTS
11. Aegon’s strategic objectives
Aegon believes that it will achieve its ambition of becoming
a trusted partner for financial solutions at every stage of life
if it realizes the following strategic objectives:
Serving customers’ need for financial security throughout
their lifetimes by providing digitally- enabled, omni-channel,
accessible solutions and superior customer experience
(‘Loyal Customers’);
Delivering excellent service to customers at competitive cost
levels by increasing scale and improving quality, efficiency,
and accuracy of processes with technology
(‘Operational Excellence’);
Valuing and supporting Aegon employees as the Company's
greatest asset by engaging and enabling them with the tools,
training, and culture needed to exceed customers’
expectations (‘Empowered Employees’); and
Ensuring that the Company always meets its long-term
commitments to stakeholders by delivering sustainable
financial results and maintaining a strong and stable balance
sheet (‘Optimized Portfolio’).
To realize these objectives, Aegon needs to be more focused and
more forward-looking, and it needs to accelerate and improve
the quality of execution.
Acquisitions divestments
Acquisitions can accelerate the implementation of Aegon’s
strategy, provide it with access to new technologies and provide
the scale needed in markets in which it is already active. Aegon is
selective when determining which businesses it would like to
acquire, generally targeting acquisitions that fit the Company's
mission of securing the financial future of its customers, and that
are aligned with its four strategic objectives. The Company uses
several financial criteria for determining the attractiveness of
acquisitions including: return on capital, internal rate of return,
capital generation, and capital fungibility. Similar strategic and
financial criteria are applied when considering the potential
divestment of existing activities.
11
CONTENTS
12. Business overview
History and development of Aegon
Aegon is an international life insurance, pensions and asset management group.
Its listed holding company, Aegon N.V., is a public limited liability company with its
statutory seat and head office in the Netherlands.
Aegon’s history dates back over 170 years. Aegon N.V. was
formed in 1983 through the merger of AGO and Ennia, both
of which were successors to insurance companies founded
in the 1800s.
Aegon is headquartered in the Netherlands and through
its subsidiaries it employs over 31,500 people worldwide.
Aegon’s common shares are listed on stock exchanges
in Amsterdam (Euronext) and New York (NYSE). Aegon’s
main operating units are separate legal entities and operate
under the laws of their respective countries. The shares of these
legal entities are directly or indirectly held by three intermediate
holding companies incorporated under Dutch law: Aegon Europe
Holding B.V., the holding company for all European activities;
Aegon International B.V., which serves as a holding company
for the Aegon Group companies of all non-European countries;
and Aegon Asset Management Holding B.V., the holding company
for some of its asset management entities.
The Company fosters an entrepreneurial spirit within its
businesses and encourages the innovation of products and
services, with the focus always on helping people achieve
a lifetime of financial security. Aegon uses a multi-brand,
multichannel distribution approach to meet its customers’ needs.
Aegon has the following reportable operating segments:
the Americas, which includes the United States, Mexico and
Brazil; the Netherlands; the United Kingdom; and New Markets,
which includes a number of countries in Central Eastern Europe
and Asia, as well as Spain, Portugal, and the reporting units
Variable Annuities Europe and Aegon Asset Management.
Business overview History and development of Aegon12
Annual Report 2015 CONTENTS
13. Selected financial data
The financial results in this Annual Report are based on Aegon’s consolidated
financial statements, which have been prepared in accordance with International
Financial Reporting Standards as adopted by the European Union (IFRS).
Application of the accounting policies in the preparation of
the financial statements requires management to apply judgment
involving assumptions and estimates concerning future results
or other developments, including the likelihood, timing or amount
of future transactions or events. There can be no assurance that
actual results will not differ materially from those estimates.
Accounting policies that are critical to the presentation of
the financial statements and that require complex estimates
or significant judgment are described in the notes to
the financial statements.
A summary of historical financial data is provided in the table
below. It is important to read this summary in conjunction with
the consolidated financial statements and related notes
(see pages 137-292) of this Annual Report.
Selected consolidated income statement information
In EUR million (except per share amount) 2015 2014 2013 2012 2011
Amounts based upon IFRS
Premium income 20,311 19,864 19,939 19,049 19,521
Investment income 8,525 8,148 7,909 8,413 8,167
Total revenues 1)
31,289 30,157 29,805 29,327 29,159
Income/ (loss) before tax 754 1,448 1,013 2,057 1,027
Net income/ (loss) 619 1,186 857 1,672 936
Earnings per common share
Basic 0.23 0.49 0.30 0.74 (0.03)
Diluted 0.23 0.49 0.30 0.74 (0.03)
Earnings per common share B
Basic 0.01 0.01 0.01 - -
Diluted 0.01 0.01 0.01 - -
1
Excluded from the income statements prepared in accordance with IFRS are receipts related to investment-type annuity products and investment contracts.
Selected consolidated balance sheet information
In million EUR (except per share amount) 2015 2014 2013 2012 2011
Amounts based upon IFRS
Total assets 417,489 424,902 351,767 363,103 343,155
Insurance and investment contracts 343,558 321,384 283,234 277,596 272,105
Borrowings including subordinated and trust
pass-through securities 13,361 15,049 12,009 13,416 9,377
Shareholders' equity 23,931 24,293 17,601 21,076 17,545
13
CONTENTS
14. Number of common shares
In thousands 2015 2014 2013 2012 2011
Balance at January 1 2,145,948 2,131,459 1,972,030 1,909,654 1,736,049
Share issuance - - 120,713 - 173,605
Stock dividends 1,089 14,489 38,716 62,376 -
Balance at end of period 2,147,037 2,145,948 2,131,459 1,972,030 1,909,654
Number of common shares B
In thousands 2015 2014 2013 2012 2011
Balance at January 1 581,326 579,005 - - -
Share issuance 3,696 2,320 579,005 - -
Balance at end of period 585,022 581,326 579,005 - -
Dividends
Aegon declared interim and final dividends on common shares
for the years 2011 through 2015 in the amounts set forth in
the following table. The 2015 interim dividend amounted to
EUR 0.12 per common share. The interim dividend was paid in
cash or stock at the election of the shareholder. The interim
dividend was payable as of September 18, 2015. At the General
Meeting of Shareholders on May 20, 2016, the Supervisory Board
will, absent unforeseen circumstances, propose a final dividend
of EUR 0.13 per common share (at each shareholders option in
cash or in stock), which will bring the total dividend for 2015 to
EUR 0.25. Proposed final dividend for the year and proposed
total dividend 2015 per common share B are EUR 0.00325 and
EUR 0.00625 respectively. Dividends in US dollars are calculated
based on the foreign exchange reference rate as published each
working day at 14:15 hours by the European Central Bank on
the business day following the announcement of the interim
dividend or on the business day following the General Meeting
of Shareholders approving the relevant final dividend.
EUR per common share 1)
USD per common share 1)
Year Interim Final Total Interim Final Total
2011 - 0.10 0.10 - 0.13 0.13
2012 0.10 0.11 0.21 0.12 0.14 0.26
2013 0.11 0.11 0.22 0.15 0.15 0.30
2014 0.11 0.12 0.23 0.15 0.13 0.28
2015 0.12 0.13 2)
0.25 0.13
1
Paid at each shareholder's option in cash or in stock.
2
Proposed.
From May 2003 to May 2013, Aegon had common shares and
class A and class B preferred shares. The annual dividend on
Aegon’s class A and class B preferred shares was calculated
on the basis of the paid-in capital on the preferred shares using
a rate equal to the European Central Bank’s fixed interest
percentage for basic refinancing transactions plus 1.75%, as
determined on Euronext Amsterdam’s first working day of
the financial year to which the dividend relates. Apart from this,
no other dividend was paid on the preferred shares. This resulted
in a rate of 2.75% for the year 2012. Applying this rate to
the weighted average paid-in capital of its preferred shares during
2012, the total amount of annual dividends Aegon made in 2013
on its preferred shares for the year 2012 was EUR 59 million.
In addition, Aegon paid a 2013 interim dividend on the preferred
shares of EUR 24 million, covering the period from January 1,
2013 until the cancellation of all preferred shares in May 2013.
Business overview Selected financial data14
Annual Report 2015 CONTENTS
15. Exchange rates
Fluctuations in the exchange rate between the euro and
the US dollar will affect the dollar equivalent of the euro price
of Aegon’s common shares traded on Euronext Amsterdam and,
as a result, are likely to impact the market price of Aegon’s
common shares in the United States. Such fluctuations will also
affect any US dollar amounts received by holders of common
shares upon conversion of any cash dividends paid in euros on
Aegon’s common shares.
As of March 9, 2016, the USD exchange rate was
EUR 1 = USD 1.0997.
The high and low exchange rates for the US dollar per euro for
each of the last six months through February 2016 are set
forth below:
Closing rates Sept. 2015 Oct. 2015 Nov. 2015 Dec. 2015 Jan. 2016 Feb. 2016
High (USD per EUR) 1.1358 1.1473 1.1026 1.1025 1.0964 1.1362
Low (USD per EUR) 1.1104 1.0963 1.0562 1.0573 1.0743 1.0868
The average exchange rates for the US dollar per euro for the five
years ended December 31, 2015, calculated by using the average
of the exchange rates on the last day of each month during
the period, are set forth below:
Year ended December 31, Average rate 1)
2011 1.4002
2012 1.2909
2013 1.3303
2014 1.3210
2015 1.1032
1
The US dollar exchange rates are the noon buying rates in New York City for cable transfers in euros as certified for customs purposes by the Federal Reserve Bank
of New York.
15
CONTENTS
16. Business lines
Americas
United States - Life Protection
Life insurance
Products offering protection against mortality,
morbidity and longevity risks, including traditional
and universal life, in addition to endowment, term,
and whole life insurance products.
Accident and health insurance
Products offering supplemental health, accidental death
and dismemberment insurance, critical illness, cancer
treatment, credit/disability, income protection, travel
and long-term care insurance.
United States - Investments Retirement
Products and services include variable and fixed annuities,
retirement plans (including ancillary services), mutual funds and
stable value solutions.
Latin America
Brazil: Life and critical illness insurance; private and
company pensions; pension scheme administration; and
investment funds.
Mexico: Individual life, group life, and health insurance; and
saving plans.
The Netherlands
Life Savings
Products with mortality, morbidity, and longevity risks, including
traditional and universal life, in addition to employer, endowment,
term, whole life insurance products; mortgages; annuity products;
and banking products, including saving deposits.
Pensions
Individual and group pensions usually sponsored by, or obtained
via, an employer. Administration-only services are offered to
company and industry pension funds.
Non-life
General insurance, consisting mainly of automotive, liability,
disability, household insurance, and fire protection.
Distribution
Independent distribution channel, offering both life and non-life
insurance solutions.
United Kingdom
Life
Immediate annuities, individual protection products, such as term
insurance, critical illness, and income protection.
Pensions
Individual pensions, including self-invested personal pensions
and drawdown products, such as guaranteed income drawdown
products; group pensions, sponsored by, or obtained via, an
employer. Also includes the tied-agent distribution business.
New Markets
Includes all businesses and operating units in Central Eastern
Europe, Asia, Spain and Portugal, in addition to Aegon’s variable
annuity activities in Europe and Aegon Asset Management.
Central Eastern Europe
Active in the Czech Republic, Hungary, Poland, Romania, Slovakia,
Turkey, and Ukraine. Includes life insurance, individual and group
pension products, savings and investments, in addition to
general insurance.
Spain Portugal
Distribution partnerships with Santander in Spain Portugal
and with Liberbank in Spain. Includes life insurance, accident and
health insurance, general insurance and investment products.
Asia
Joint ventures in China and India offering (term) life insurance
and savings products, and in Japan offering variable annuities.
Life insurance marketed to high-net-worth individuals via
the Transamerica brand in Hong Kong and Singapore. Direct
and affinity products marketed in Asia by Aegon Direct Affinity
Marketing Services.
Variable Annuities Europe
Variable annuities offered by Aegon companies operating in
Europe, and international/offshore bonds for the UK market.
Aegon Asset Management
Asset management products, including equity and fixed income,
covering third-party clients, insurance-linked solutions, and
Aegon’s own insurance companies.
Business overview Business lines16
Annual Report 2015 CONTENTS
17. In January 2016, Aegon announced that it had changed its
reporting structure going forward. The new reporting structure
will consist of four business lines: Americas, Europe (consisting of
the Netherlands; United Kingdom, including Variable Annuities
Europe; Central Eastern Europe; and Spain Portugal), Asia
and Aegon Asset Management. Furthermore, rather than report
its financial results by division, Aegon Americas will report by
using the following product groups:
Life
Accident Health
Retirement Plans
Mutual Funds
Variable Annuities
Fixed Annuities
Stable Value Solutions
Latin America
The new reporting structure is effective from January 1, 2016.
For this reason, Aegon’s 2015 Annual Report reflects the former
reporting structure.
17
CONTENTS
18. Results of operations
Results 2015 worldwide
Underlying earnings geographically
Amounts in EUR millions 2015 2014 %
Net underlying earnings 1,552 1,416 10%
Tax on underlying earnings 387 449 (14%)
Underlying earnings before tax geographically
Americas 1,200 1,134 6%
The Netherlands 537 558 (4%)
United Kingdom 125 115 9%
New markets 236 196 20%
Holding and other activities (161) (138) (17%)
Underlying earnings before tax 1,939 1,865 4%
Fair value items (620) (807) 23%
Gains / (losses) on investments 346 697 (50%)
Net impairments 49 (34) -
Other income / (charges) (980) (240) -
Run-off businesses 52 (21) -
Income before tax (excluding income tax from certain proportionately consolidated
joint ventures and associates) 786 1,458 (46%)
Income tax from certain proportionately consolidated joint ventures and associates
included in income before tax 33 10 -
Income tax (167) (272) 39%
Of which Income tax from certain proportionately consolidated joint ventures and associates
included in income before tax (33) (10) -
Net income 619 1,186 (48%)
Commissions and expenses 6,802 5,892 15%
of which operating expenses 3,734 3,312 13%
This Annual Report includes the non-IFRS financial measure:
underlying earnings before tax. The reconciliation of this measure
to the most comparable IFRS measure is presented in the table
above in addition to in note 5 Segment information of the
consolidated financial statements. This non-IFRS measure is
calculated by consolidating on a proportionate basis the revenues
and expenses of Aegon’s joint ventures in the Netherlands,
Mexico, Spain, Portugal, China and Japan and Aegon’s associates
in India, Brazil, the Netherlands, United Kingdom and Mexico.
The table also includes the non-IFRS financial measure: net
underlying earnings. This is the after-tax equivalent of underlying
earnings before tax. The reconciliation of net underlying earnings
to the most comparable IFRS measure is presented in the table
above. Aegon believes that its non-IFRS measure provides
meaningful information about the underlying operating results of
Aegon’s businesses, including insight into the financial measures
that senior management uses in managing the businesses.
Aegon’s senior management is compensated based in part on
Aegon’s results against targets using the non-IFRS measures
presented in this report. While many other insurers in Aegon’s
peer group present substantially similar non-IFRS measures,
the non-IFRS measures presented in this document may
nevertheless differ from the non-IFRS measures presented by
other insurers. There is no standardized meaning to these
measures under IFRS or any other recognized set of accounting
standards and readers are cautioned to consider carefully
the different ways in which Aegon and its peers present similar
information before making a comparison. Aegon believes
the non-IFRS measures present within this report, when read
together with Aegon’s reported IFRS financial statements,
provide meaningful supplemental information for the investing
public. This enables them to evaluate Aegon’s businesses after
eliminating the impact of current IFRS accounting policies for
financial instruments and insurance contracts, which embed
a number of accounting policy alternatives that companies may
select in presenting their results (as companies may use different
local generally accepted accounting principles (GAAPs)), and this
may make the comparability difficult between time periods.
Business overview Results of operations – Worldwide18
Annual Report 2015 CONTENTS
19. New life sales
Amounts in EUR millions 2015 2014 %
Americas 599 552 9%
The Netherlands 130 251 (48%)
United Kingdom 911 972 (6%)
New markets 304 271 12%
Total recurring plus 1/10 single 1,944 2,045 (5%)
Gross deposits (on and off balance)
Amounts in EUR millions 2015 2014 %
Americas 36,999 31,849 16%
The Netherlands 5,137 2,781 85%
United Kingdom 307 281 9%
New markets 34,761 20,519 69%
Total gross deposits 77,205 55,431 39%
Worldwide revenues
geographically 2015
Amounts in EUR millions Americas
The
Netherlands
United
Kingdom
New
Markets
Holding, other
activities and
eliminations
Segment
total
Associates
and Joint
Ventures
eliminations Consolidated
Total life insurance gross premiums 7,046 2,240 5,650 2,565 (102) 17,400 (431) 16,969
Accident and health insurance premiums 2,266 234 47 170 - 2,717 (14) 2,703
General insurance premiums - 473 - 244 2 720 (80) 640
Total gross premiums 9,312 2,947 5,697 2,979 (100) 20,836 (524) 20,311
Investment income 3,680 2,277 2,327 291 2 8,576 (51) 8,525
Fees and commission income 1,704 351 43 813 (278) 2,633 (195) 2,438
Other revenue 9 - - 2 7 19 (5) 14
Total revenues 14,705 5,575 8,067 4,086 (369) 32,064 (775) 31,289
Number of employees, including
agent employees 12,701 4,503 2,260 11,767 299 31,530
Underlying earnings before tax by line of business
Amounts in EUR millions 2015 2014 %
Life 757 652 16%
Individual Savings Retirement 540 665 (19%)
Pensions 594 510 16%
Non-life 17 46 (62%)
Distribution 22 15 50%
Asset management 170 115 48%
Other (161) (138) (17%)
Underlying earnings before tax 1,939 1,865 4%
19
CONTENTS
20. Results 2015 worldwide
Aegon’s net income in 2015 declined to EUR 619 million. Underlying earnings
before tax increased to EUR 1,939 million, driven by favorable currency
movements. Results in 2015 were impacted by a loss of EUR 620 million on
fair value items, which was driven by accounting losses on hedging programs and
the impact of assumption changes. Other charges amounted to EUR 980 million,
mainly driven by the loss on the divestment of the Canadian life insurance
activities and the impact of model updates. This loss was partly offset by
realized gains of EUR 346 million, and net recoveries of EUR 49 million.
Net income
Net income declined by 48% to EUR 619 million compared
with 2014 as lower losses on fair value items and net recoveries
were more than offset by higher other charges and lower
realized gains.
Underlying earnings before tax
Aegon’s underlying earnings before tax in 2015 increased by 4%
to EUR 1,939 million compared with 2014. The recurring impact
of the actuarial assumption changes and model updates
implemented in the third quarters of 2014 and 2015 and adverse
claims experience in the United States were more than offset by
favorable currency movements.
Underlying earnings before tax from the Americas increased
by 6% to EUR 1,200 million in 2015 compared with 2014.
The impact of the stronger US dollar more than offset adverse
claims experience and the impact on recurring earnings of
the actuarial assumption changes and model updates
implemented in the third quarters of 2014 and 2015.
In the Netherlands, underlying earnings before tax declined
by 4% to EUR 537 million in 2015 compared with 2014,
as underlying earnings before tax in 2014 included
a EUR 45 million employee benefit release resulting from
legislation changes in the Netherlands. Excluding this benefit,
earnings increased by 5%, primarily driven by lower funding
costs and higher investment income.
Underlying earnings before tax from Aegon’s operations in
the United Kingdom were up 9% to EUR 125 million in 2014,
mainly due to favorable currency movements.
Underlying earnings before tax from New Markets increased
by 20% to EUR 236 million compared with 2014, as
the positive impact of higher performance fees and third-
party assets under management at Aegon Asset Management
more than offset lower earnings from Central Eastern
Europe primarily driven by the negative impact of higher
surrenders in Poland following product changes.
Total holding costs increased by 17% to EUR 161 million
in 2015 compared with 2014. This was mainly as a result
of higher net interest costs following a debt issuance to
refinance a perpetual security for which the cost was
previously accounted for directly through shareholders’
equity and a gain related to interest on tax.
Fair value items
The results from fair value items amounted to a loss of
EUR 620 million. The loss was mainly driven by adverse results
on hedging programs in the United States (EUR 521 million),
the positive impact of assumption changes (EUR 101 million),
and the underperformance of alternative investments in
the United States (EUR 171 million).
Included in the loss on hedging programs in the United States
is the loss on fair value hedges without accounting match in
the Americas (EUR 402 million). This was mainly driven by
the loss on equity and interest rate hedges, which were set up
to protect Aegon’s capital position.
Underperformance of fair value investments was primarily driven
by investments related to the energy sector and hedge funds in
the United States.
Realized gains on investments
Realized gains on investments amounted to EUR 346 million,
and were primarily related to a rebalancing of the fixed income
portfolio in the Netherlands and the United Kingdom to improve
Aegon’s capital position under Solvency II.
Impairment charges
Net recoveries improved by EUR 83 million to EUR 49 million
in 2015 compared with 2014. In the United States, gross
impairments were more than offset by recoveries mostly related to
investments in subprime residential mortgage-backed securities.
Business overview Results of operations – Worldwide20
Annual Report 2015 CONTENTS
21. Other charges
Other charges amounted to EUR 980 million. These were mostly
caused by the loss on the divestment of the Canadian life
insurance activities (EUR 751 million) and charges related to
model updates (EUR 205 million).
Run-off businesses
The results of run-off businesses improved to EUR 52 million, as
the 2014 result included a negative impact from model updates
of EUR 32 million.
Income tax
Income tax amounted to EUR 167 million. The effective tax rate
on underlying earnings and total income for 2015 was 20% and
21%, respectively. This was mostly driven by tax credits related
to solar energy investments in the United States.
Commissions and expenses
Commissions and expenses increased by 15% in 2015 compared
with 2014 to EUR 6.8 billion. Operating expenses increased
by 13% in 2015 compared with 2014 to EUR 3.7 billion.
Adverse currency movements and higher defined benefit
expenses in the Netherlands more than offset lower project
and transformation costs in the UK and the positive impact of
the divestment of the Canadian life insurance activities.
Production
Compared with 2014, Aegon’s total sales in 2015 increased
by 24% to EUR 10.7 billion. This was a result of higher gross
deposits, partly driven by favorable currency movements.
In 2015, compared with 2014, gross deposits were up 39%
to EUR 77.2 billion, driven by higher pensions and mutual fund
deposits in the United States, production from online bank
Knab in the Netherlands, and sales in Aegon Asset Management.
Net deposits, excluding run-off businesses, increased by 85%
to EUR 18.4 billion compared to 2014, mostly due to higher
gross deposits and the de-recognition of movements in stable
value solutions balances. New life sales declined by 5%
compared with 2014 to EUR 1.9 billion, mostly driven by lower
universal life production in the United States, fewer pension
buy-out sales in the Netherlands, and a lower demand for
traditional pension products in the United Kingdom.
New premium production for accident health life and
general insurance increased by 3% compared with 2014 to
EUR 1.0 billion, as the stronger US dollar more than offset
a lower contribution from portfolio acquisitions and several
product exits.
Capital management
During 2015, shareholders' equity decreased by EUR 0.4 billion
to EUR 23.9 billion, as retained earnings and favorable currency
exchange rates were more than offset by the book loss on
the sale of the Canadian life insurance activities and higher
interest rates, which resulted in lower revaluation reserves.
During the year, the revaluation reserves decreased by
EUR 1.8 billion to EUR 6.5 billion. Aegon’s shareholders' equity,
excluding revaluation reserves and defined benefit plan
remeasurements, amounted to EUR 19.0 billion on
December 31, 2015, or 8.97 per common share. The gross
leverage ratio improved to 27.0% on December 31, 2015,
compared with the end of 2014, which was mostly as a result
of earnings generated during the year. The negative impact on
the gross leverage ratio of the book loss on the sale of
the Canadian life insurance activities was offset by
the redemption of the USD 500 million senior bond, which
matured on December 8, 2015. Excess capital in the holding
increased from EUR 1.2 billion at the end of 2014 to
EUR 1.4 billion on December 31, 2015, as dividends from
business units and proceeds from divestments were partly offset
by the impact of cash used for deleveraging, dividends to
shareholders, interest payments and operating expenses.
During 2015, Aegon’s Insurance Group Directive (IGD) ratio
increased from 208% at the end of 2014 to 220% on
December 31, 2015. The increase reflects positive retained
earnings during the year, in addition to the impact of divestments.
On March 3, 2015, Aegon completed the sale of its 35% share
in La Mondiale Participations to La Mondiale for EUR 350 million.
Furthermore, on July 31, 2015, Aegon completed the sale of
its Canadian operations to Wilton Re for CAD 600 million
(EUR 428 million). The capital in excess of the SP AA threshold
in the United States decreased from USD 1.1 billion at the end
of 2014 to USD 0.2 billion on December 31, 2015, as dividends
paid to the holding were offset by earnings, while the RBC ratio
in the United States decreased from 540% at year-end 2014
to ~460% on December 31, 2015. The decrease in the
United States primarily reflected market conditions and
the impact of assumption changes and model updates
implemented during the third quarter. In the Netherlands,
the IGD ratio, excluding Aegon Bank, increased from 215% on
December 31, 2014, to ~240% at the end of 2015 due to
earnings generated during the year. The Pillar 1 ratio in
the United Kingdom, including the with-profit fund, increased
from 140% at the end of 2014 to ~165% at the end of 2015
due to earnings and changes to longevity assumptions in
the fourth quarter.
On November 24, 2015, Aegon successfully placed its inaugural
EUR 750 million Conditional Pass-Through Covered Bond.
The placement enabled Aegon to further diversify its funding
sources and to attract new external long-term funding. The net
proceeds were used to refinance part of the existing
Dutch mortgage portfolio of Aegon.
Dividends from and capital contributions to
business units
Aegon received EUR 1.1 billion of dividends from its business
units during 2015, almost all of which from the Americas.
Aegon spent EUR 0.3 billion on capital contributions and
acquisitions in New Markets.
21
CONTENTS
22. Results 2014 worldwide
Underlying earnings geographically
Amounts in EUR millions 2014 2013 %
Net underlying earnings 1,416 1,531 (8%)
Tax on underlying earnings 449 437 3%
Underlying earnings before tax geographically
Americas 1,134 1,314 (14%)
The Netherlands 558 454 23%
United Kingdom 115 87 32%
New markets 196 227 (13%)
Holding and other activities (138) (113) 22%
Underlying earnings before tax 1,865 1,968 (5%)
Fair value items (807) (1,294) (38%)
Gains / (losses) on investments 697 500 39%
Net impairments (34) (122) (72%)
Other income / (charges) (240) (52) -
Run-off businesses (21) 21 -
Income before tax (excluding income tax from certain proportionately consolidated
joint ventures and associates) 1,458 1,021 43%
Income tax from certain proportionately consolidated joint ventures and associates included in
income before tax 10 8 33%
Income tax (272) (164) (66%)
Of which Income tax from certain proportionately consolidated joint ventures and associates
included in income before tax (10) (8) (33%)
Net income 1,186 857 38%
Commissions and expenses 5,892 5,873 0%
of which operating expenses 3,312 3,273 1%
New life sales
Amounts in EUR millions 2014 2013 %
Americas 552 464 19%
The Netherlands 251 206 22%
United Kingdom 972 1,014 (4%)
New markets 271 228 19%
Total recurring plus 1/10 single 2,045 1,911 7%
Gross deposits (on and off balance)
Amounts in EUR millions 2014 2013 %
Americas 31,849 28,424 12%
The Netherlands 2,781 1,338 108%
United Kingdom 281 281 (0%)
New markets 20,519 14,287 44%
Total gross deposits 55,431 44,330 25%
Business overview Results of operations – Worldwide22
Annual Report 2015 CONTENTS
23. Worldwide revenues
geographically 2014
Amounts in EUR millions Americas
The
Netherlands
United
Kingdom
New
Markets
Holding, other
activities and
eliminations
Segment
total
Associates
and Joint
Ventures
eliminations Consolidated
Total life insurance gross premiums 6,461 3,982 4,859 2,015 (70) 17,246 (351) 16,896
Accident and health insurance
premiums 1,874 233 56 163 - 2,326 (11) 2,316
General insurance premiums - 501 - 224 - 725 (72) 653
Total gross premiums 8,334 4,716 4,916 2,402 (70) 20,298 (433) 19,864
Investment income 3,312 2,568 2,073 234 2 8,191 (42) 8,148
Fees and commission income 1,485 324 43 623 (237) 2,237 (100) 2,137
Other revenue 2 - - 3 5 10 (3) 7
Total revenues 13,134 7,608 7,032 3,262 (300) 30,735 (578) 30,157
Number of employees, including agent
employees 12,865 4,426 2,420 8,617 274 28,602
Underlying earnings before tax by line of business
Amounts in EUR millions 2014 2013 %
Life 652 1,003 (35%)
Individual Savings Retirement 665 487 37%
Pensions 510 471 8%
Non-life 46 12 -
Distribution 15 16 (8%)
Asset management 115 95 21%
Other (138) (115) 20%
Underlying earnings before tax 1,865 1,968 (5%)
23
CONTENTS
24. Results 2014 worldwide
Aegon’s net income in 2014 amounted to EUR 1,186 million. Underlying earnings
before tax amounted to EUR 1,865 million. Furthermore, results in 2014 were
impacted by a loss of EUR 807 million on fair value items, which was driven by
accounting losses on hedging programs and the impact of assumption changes
and model updates, and other charges of EUR 240 million. This was partly offset
by realized gains of EUR 697 million, and net impairment charges of EUR 34 million.
Net income
Net income increased to EUR 1,186 million compared with 2013
as lower underlying earnings before tax, higher other charges and
lower income before tax from run-off businesses were more than
offset by lower losses from fair value items, higher realized gains
and lower net impairments.
Underlying earnings before tax
Aegon’s underlying earnings before tax in 2014 decreased 5% to
EUR 1,865 million compared with 2013. The benefit of business
growth and favorable equity markets was more than offset by
the impact of charges for actuarial assumption changes and
model updates, and unfavorable mortality in the Americas.
Underlying earnings before tax from the Americas decreased
14% to EUR 1,134 million in 2014 compared with 2013.
Growth in variable annuities and pensions was more than
offset by the impact of a charge for actuarial assumption
changes and model updates, unfavorable mortality in the life
business and the impact of lower interest rates.
In the Netherlands, underlying earnings before tax increased
23% to EUR 558 million in 2014 compared with 2013, primarily
generated by mortgage production. Underlying earnings before
tax growth in 2014 was driven by higher investment income,
improved margins on savings, a EUR 45 million employee
benefit reserve release resulting from legislation changes in
the Netherlands, and improvement in non-life.
Underlying earnings before tax from Aegon’s operations in
the United Kingdom amounted to EUR 115 million in 2014.
The 32% increase compared with 2013 was primarily
the result of improved persistency.
Underlying earnings before tax from New Markets declined
14% to EUR 196 million compared with 2013. A 21% increase
in underlying earnings before tax, compared with 2013, from
Aegon Asset Management due to higher third-party balances
was more than offset by lower underlying earnings before tax
in Asia, which was mostly due to charges for actuarial
assumption changes and model updates.
Total holding costs increased 22% to EUR 138 million
in 2014 compared with 2013. This was mainly as a result
of higher net interest costs following a debt issuance to
refinance a perpetual security for which the cost was
previously accounted for directly through shareholders’ equity.
Fair value items
The results from fair value items amounted to a loss of
EUR 807 million. The loss was mainly driven by adverse results
on hedging programs in the United States (EUR 301 million),
adverse fair value movements on interest rate hedges and
longevity hedges in the Netherlands (EUR 180 million),
the adverse impact of assumption changes and model updates
(EUR 123 million), and the underperformance of alternative
investments in the United States (EUR 90 million).
Included in the loss on hedging programs in the United States
is the loss on fair value hedges without accounting match in the
Americas (EUR 251 million), mainly driven by the loss on equity
hedges, which were set up to protect Aegon’s capital position,
as a result of the strong US equity market performance in 2014.
Underperformance of fair value investments was primarily driven
by investments related to the energy sector in the United States,
and credit spread tightening in the Netherlands.
Realized gains on investments
Realized gains on investments amounted to EUR 697 million
and were primarily related to a rebalancing of the fixed income
portfolio in the Netherlands and the United Kingdom, and
the divestment of a private equity investment in the Netherlands.
Impairment charges
Net impairments improved by EUR 88 million to EUR 34 million
in 2014 compared with 2013. In the United States, gross
impairments were more than offset by recoveries mostly related to
investments in subprime residential mortgage-backed securities.
Other charges
Other charges amounted to EUR 240 million. These were mostly
caused by a charge in the Netherlands (EUR 95 million) related
to the agreement with the harbor workers’ former pension fund
Optas, a provision taken for the closed block of European direct
marketing activities (EUR 36 million), a provision for the
implementation of the fee cap on pensions in the United Kingdom
(EUR 35 million), a provision for the modification of unit-linked
policies in Poland (EUR 23 million), and a change in the valuation
of fixed assets in Aegon’s Canadian business in anticipation of its
divestment (EUR 15 million).
Business overview Results of operations – Worldwide24
Annual Report 2015 CONTENTS
25. Run-off businesses
The results of run-off businesses amounted to a loss of
EUR 21 million, mainly driven by a negative impact from model
updates of EUR 32 million.
Income tax
Income tax amounted to EUR 272 million. The effective tax rate
on underlying earnings for 2014 was 24%. The effective tax rate
on total income was 19%. This was mostly driven by the combined
effects of negative fair value items taxed at nominal rates,
the reversal of the tax charge in Americas in 2013 related to
hedging losses, tax credits and tax exempt items.
Commissions and expenses
Commissions and expenses increased slightly in 2014 compared
with 2013 to EUR 5,892 million. Operating expenses increased
1% in 2014 compared with 2013 to EUR 3,312 million.
This was mainly because the benefit of an employee benefit
reserve release in the Netherlands (EUR 45 million) was more
than offset by a provision and expenses related to implementing
the upcoming fee cap on pensions in the United Kingdom, and
higher expenses to support growth in the United States and
the Netherlands.
Production
Compared with 2013, Aegon’s total sales, in 2014, increased
20% to EUR 8.6 billion. This was a result of higher gross
deposits, new life sales and production of accident and health
and general insurance. In 2014, compared with 2013, gross
deposits increased 25% to EUR 55.4 billion, driven by pensions,
variable annuities and mutual funds in the United States,
production from online bank Knab in the Netherlands, and Aegon
Asset Management. Net deposits, excluding run-off businesses,
decreased 7% to EUR 9.9 billion compared to 2013, mostly due
to a reduction in stable value solutions balances of approximately
EUR 3.0 billion and a one-time transfer of pension assets to
the Polish government due to legislative changes. New life sales
increased 7% compared with 2013 to EUR 2.0 billion, mostly
driven by higher universal life production in the United States and
Asia, and higher pension production in the Netherlands.
Capital management
In 2014, shareholders’ equity increased EUR 6.7 billion compared
with December 31, 2013 to EUR 24.3 billion. This was driven
by lower interest rates, which resulted in higher revaluation
reserves, and favorable currency exchange rates. During the year,
the revaluation reserves increased by EUR 5.3 billion to
EUR 8.3 billion. Aegon’s shareholders’ equity, excluding
revaluation reserves and defined benefit plan remeasurements,
amounted to EUR 17.6 billion on December 31, 2014.
The gross leverage ratio improved to 28.7% on December 31,
2014 compared to the end of 2013, which was mostly as a result
of deleveraging. Excess capital in the holding decreased to
EUR 1.2 billion on December 31, 2014 compared to 2013
(EUR 2.2 billion), as dividends from business units were more
than offset by the impact of cash used for deleveraging, interest
payments and operating expenses.
Shareholders’ equity per common share, excluding revaluation
reserves and defined benefit plan remeasurements, amounted
to EUR 8.34 on December 31, 2014.
On December 31, 2014, Aegon’s Insurance Group Directive
(IGD) ratio stood at 208%.The capital in excess of the SP AA
threshold in the United States remained stable at USD 1.1 billion,
as dividends paid to the holding were offset by earnings.
The RBC ratio in the United States was ~540% at year-end 2014.
In the Netherlands, the IGD ratio, excluding Aegon Bank, was
~215%. The Pillar 1 ratio in the United Kingdom, including
the with-profit fund, was approximately 140% at the end of
2014 reflecting the negative impact of de-risking of the asset
portfolio in preparation for Solvency II.
Effective as of March 15, 2014, Aegon redeemed junior perpetual
capital securities with a coupon of 6.875% and a principal
amount of USD 550 million. Effective as of June 15, 2014, Aegon
redeemed perpetual capital securities with a coupon of 7.25%
issued in 2007 and with a principal amount of USD 1,050 million,
equal to approximately EUR 780 million. This transaction was
largely financed by the issuance of EUR 700 million subordinated
notes with a coupon of 4% on April 25.
On October 16, 2014, Aegon announced the sale of its Canadian
operations to Wilton Re for CAD 600 million (EUR 423 million).
This transaction will result in a book loss of EUR 0.8 billion at
closing and is expected to close in the first half of 2015, subject
to regulatory approval.
On November 24, 2014, Aegon announced the sale of its
35% share in La Mondiale Participations to La Mondiale for
EUR 350 million, in line with IFRS book value. The proceeds
will increase the group’s IGD solvency ratio by approximately
5 percentage points. This transaction was closed on
March 3, 2015.
Dividends from and capital contributions to
business units
Aegon received EUR 1.1 billion of dividends from its business
units during 2014, almost all of which from the Americas. Capital
contributions of EUR 0.1 billion were paid to Aegon’s businesses
in New Markets.
25
CONTENTS
26. Results 2015 Americas
Amounts in USD millions Amounts in EUR millions
2015 2014 % 2015 2014 %
Net underlying earnings 1,045 1,082 (3%) 941 814 16%
Tax on underlying earnings 287 424 (32%) 259 320 (19%)
Underlying earnings before tax by
business
Life insurance 213 (13) - 192 (10) -
Accident health insurance 140 212 (34%) 126 160 (21%)
Life Protection 353 199 77% 318 150 112%
Retirement plans 261 272 (4%) 235 205 15%
Mutual funds 50 47 6% 45 35 26%
Variable annuities 501 671 (25%) 452 505 (11%)
Fixed annuities 66 172 (62%) 59 130 (54%)
Stable value solutions 101 109 (8%) 91 82 11%
Investments retirement 978 1,271 (23%) 881 957 (8%)
Canada - 30 - - 23 -
Latin America 1 5 (72%) 1 4 (67%)
Underlying earnings before tax 1,332 1,506 (12%) 1,200 1,134 6%
Fair value items (654) (661) 1% (589) (497) (18%)
Gains / (losses) on investments (83) 113 - (74) 85 -
Net impairments 79 27 189% 71 21 -
Other income / (charges) (1,041) (69) - (938) (52) -
Run-off businesses 58 (28) - 52 (21) -
Income before tax (excluding income tax from
certain proportionately consolidated
joint ventures and associates) (308) 889 - (277) 669 -
Income tax from certain proportionately
consolidated joint ventures and associates
included in income before tax 5 4 39% 5 3 66%
Income tax 35 (105) - 31 (79) -
Of which Income tax from certain
proportionately consolidated joint ventures
and associates included in income before tax (5) (4) (39%) (5) (3) (66%)
Net income (273) 784 - (246) 590 -
Life insurance gross premiums 7,821 8,585 (9%) 7,046 6,461 9%
Accident and health insurance premiums 2,515 2,490 1% 2,266 1,874 21%
Total gross premiums 10,336 11,074 (7%) 9,312 8,334 12%
Investment income 4,085 4,401 (7%) 3,680 3,312 11%
Fees and commission income 1,891 1,974 (4%) 1,704 1,485 15%
Other revenues 11 3 - 9 2 -
Total revenues 16,322 17,453 (6%) 14,705 13,134 12%
Commissions and expenses 4,529 4,446 2% 4,080 3,346 22%
of which operating expenses 1,843 1,871 (2%) 1,660 1,408 18%
Business overview Results of operations – Americas26
Annual Report 2015 CONTENTS
27. Amounts in USD millions Amounts in EUR millions
New life sales 2015 2014 % 2015 2014 %
Life Protection 622 615 1% 561 463 21%
Canada - 75 - - 56 -
Latin America 42 43 (2%) 38 33 17%
Total recurring plus 1/10 single 665 733 (9%) 599 552 9%
Amounts in USD millions Amounts in EUR millions
2015 2014 % 2015 2014 %
New premium production accident and health
insurance 1,003 1,193 (16%) 904 898 1%
Amounts in USD millions Amounts in EUR millions
Gross deposits (on and off balance) 2015 2014 % 2015 2014 %
Life Protection 7 9 (20%) 6 7 (4%)
Retirement plans 27,833 26,736 4% 25,075 20,121 25%
Mutual funds 5,084 4,879 4% 4,580 3,672 25%
Variable annuities 7,857 10,235 (23%) 7,079 7,702 (8%)
Fixed annuities 276 323 (15%) 249 243 2%
Investment retirement 41,051 42,173 (3%) 36,983 31,738 17%
Canada - 121 - - 91 -
Latin America 12 18 (35%) 10 14 (22%)
Total gross deposits 41,069 42,321 (3%) 36,999 31,849 16%
Weighted average rate Closing rate as of
Exchange rates
Per 1 EUR 2015 2014
December 31,
2015
December 31,
2014
USD 1.1100 1.3288 1.0863 1.2101
CAD 1.4173 1.4667 1.5090 1.4015
27
CONTENTS
28. Results 2015 Americas
The net loss in 2015 was USD 273 million, primarily the result of the book loss
on the divestment of Canada of USD 837 million. Underlying earnings before tax
decreased to USD 1.3 billion compared with 2014. This was mainly driven by
adverse claims experience and the impact on recurring earnings of the actuarial
assumption changes and model updates implemented in the third quarters of
2014 and 2015. Gross deposits and new life sales declined to USD 41.1 billion
and USD 665 million respectively, due to product adjustments to improve
profitability, while new premium production for accident health insurance
was down to USD 1.0 billion.
Net loss
The net loss amounted to USD 273 million in 2015, primarily
the result of the book loss on the divestment of Aegon’s
Canadian life insurance business of USD 837 million. Results
on fair value items amounted to a loss of USD 654 million,
which was primarily related to the impact on hedging programs
as a result of lower interest rates and higher equity markets.
Realized losses on investments amounted to USD 83 million,
and were mainly related to investments in emerging markets
and the energy sector. Net impairments improved compared
with 2014 to a benefit of USD 79 million as recoveries, which
were mostly related to investments in subprime residential
mortgage-backed securities, more than offset gross impairments.
Other charges were USD 1.0 billion, and were primarily related to
the divestment of Aegon’s Canadian business and model updates.
Underlying earnings before tax
Underlying earnings before tax in 2015 decreased by 12% to
USD 1.3 billion compared with 2014. This was mainly driven by
adverse claims experience and the impact on recurring earnings
of the actuarial assumption changes and model updates
implemented in the third quarters of 2014 and 2015.
Underlying earnings before tax from Life Protection
increased by 77% compared with 2014 to USD 353 million.
This is due to lower charges for assumption changes more
than offsetting unfavorable mortality and morbidity,
the impact of lower interest rates and the impact on recurring
earnings of the actuarial assumption changes and model
updates implemented in the third quarters of 2014 and 2015.
The earnings impact of the updates in 2015 was primarily
caused by long-term care.
Investments Retirement underlying earnings before tax
declined by 23% to USD 978 million compared with 2014,
which was caused by higher charges for actuarial assumption
changes and margin pressure. Retirement plans underlying
earnings before tax were down 4% to USD 261 million
in 2015 compared with 2014, primarily driven by lower general
account pension liabilities and margin pressure arising from
the competitive environment on fees. Underlying earnings
before tax from variable annuities declined by 25% to
USD 501 million compared with 2014 as a result of
the negative impact from actuarial assumption changes of
USD 2 million in 2015, while 2014 included a benefit of
USD 174 million. Underlying earnings before tax from mutual
funds increased by 6% to USD 50 million, mainly driven by
favorable markets. Fixed annuity underlying earnings before
tax were down 62% to USD 66 million compared with 2014,
as the product is no longer actively sold. Furthermore,
underlying earnings before tax from fixed annuities were
adversely impacted by assumption changes amounting to
USD 65 million.
Commissions and expenses
Commissions and expenses increased by 2% in 2015 to
USD 4.5 billion compared with 2014. Operating expenses
decreased by 2% in 2015 to USD 1.8 billion compared with 2014,
and this was mainly driven by the divestment of Canada.
Production
Gross deposits declined by 3% in 2015 to USD 41.1 billion
compared with 2014. Higher gross deposits in retirement plans
were more than offset by lower gross deposits in variable
annuities. Gross deposits in retirement plans increased by 4%
to USD 27.8 billion due to higher recurring deposits. Variable
annuity gross deposits were down by 23% to USD 7.9 billion
compared with 2014, mainly driven by product adjustments
implemented in the first quarter of 2015 in response to
the low interest rate environment.
New life sales declined by 9% in 2015 to USD 665 million
compared with 2014, as growth in indexed universal life was
more than offset by the divestment of Canada, the withdrawal
of the universal life secondary guarantee product due to
the low interest rate environment, and lower term life sales.
New premium production for accident health insurance was
down 16% to USD 1.0 billion, mainly resulting from a lower
contribution from portfolio acquisitions and several product exits.
Business overview Results of operations – Americas28
Annual Report 2015 CONTENTS
29. Results 2014 Americas
Amounts in USD millions Amounts in EUR millions
2014 2013 % 2014 2013 %
Net underlying earnings 1,082 1,280 (15%) 814 965 (16%)
Tax on underlying earnings 424 464 (9%) 320 349 (8%)
Underlying earnings before tax by
business
Life insurance (13) 469 - (10) 353 -
Accident health insurance 212 254 (17%) 160 191 (16%)
Life Protection 199 719 (72%) 150 542 (72%)
Retirement plans 272 239 14% 205 180 14%
Mutual funds 47 33 42% 35 25 40%
Variable annuities 671 414 62% 505 312 62%
Fixed annuities 172 215 (20%) 130 162 (20%)
Stable value solutions 109 110 (1%) 82 83 (1%)
Investments retirement 1,271 1,011 26% 957 762 26%
Canada 30 4 - 23 3 -
Latin America 5 9 (44%) 4 7 (43%)
Underlying earnings before tax 1,506 1,744 (14%) 1,134 1,314 (14%)
Fair value items (661) (1,300) 49% (497) (980) 49%
Gains / (losses) on investments 113 145 (22%) 85 110 (23%)
Net impairments 27 (58) - 21 (44) -
Other income / (charges) (69) 95 - (52) 72 -
Run-off businesses (28) 28 - (21) 21 -
Income before tax (excluding income tax from
certain proportionately consolidated
joint ventures and associates) 889 655 36% 669 493 36%
Income tax from certain proportionately
consolidated joint ventures and associates
included in income before tax 4 4 - 3 3 -
Income tax (105) (115) 9% (79) (86) 8%
Of which Income tax from certain
proportionately consolidated joint ventures
and associates included in income before tax (4) (4) - (3) (3) -
Net income 784 540 45% 590 407 45%
Life insurance gross premiums 8,585 8,212 5% 6,461 6,187 4%
Accident and health insurance premiums 2,49 2,372 5% 1,874 1,787 5%
Total gross premiums 11,074 10,584 5% 8,334 7,974 5%
Investment income 4,401 4,473 (2%) 3,312 3,370 (2%)
Fees and commission income 1,974 1,689 17% 1,485 1,273 17%
Other revenues 3 6 (50%) 2 4 (50%)
Total revenues 17,453 16,752 4% 13,134 12,622 4%
Commissions and expenses 4,446 4,394 1% 3,346 3,311 1%
of which operating expenses 1,871 1,911 (2%) 1,408 1,440 (2%)
29
CONTENTS
30. Amounts in USD millions Amounts in EUR millions
New life sales 2014 2013 % 2014 2013 %
Life Protection 615 505 22% 463 380 22%
Canada 75 68 10% 56 51 10%
Latin America 43 42 2% 33 32 3%
Total recurring plus 1/10 single 733 615 19% 552 464 19%
Amounts in USD millions Amounts in EUR millions
2014 2013 % 2014 2013 %
New premium production accident and
health insurance 1,193 902 32% 898 680 32%
Amounts in USD millions Amounts in EUR millions
Gross deposits (on and off balance) 2014 2013 % 2014 2013 %
Life Protection 9 11 (18%) 7 8 (13%)
Retirement plans 26,736 21,238 26% 20,121 16,002 26%
Mutual funds 4,879 4,301 13% 3,672 3,241 13%
Variable annuities 10,235 8,496 20% 7,702 6,402 20%
Fixed annuities 323 552 (41%) 243 416 (41%)
Stable value solutions - 2,984 - - 2,248 -
Investment Retirement 42,173 37,571 12% 31,738 28,309 12%
Canada 121 125 (3%) 91 94 (3%)
Latin America 18 18 - 14 14 -
Total gross deposits 42,321 37,725 12% 31,849 28,424 12%
Weighted average rate Closing rate as of
Exchange rates
Per 1 EUR 2014 2013
December 31,
2014
December 31,
2013
USD 1.3288 1.3272 1.2101 1.3780
CAD 1.4667 1.3674 1.4015 1.4641
Business overview Results of operations – Americas30
Annual Report 2015 CONTENTS
31. Results 2014 Americas
Net income in 2014 amounted to USD 784 million. Underlying earnings before tax
decreased to USD 1,506 million compared with 2013. This was mainly because
higher earnings from variable annuities and pensions were more than offset by
lower earnings in Life Protection, mostly due to the impact of assumption
changes and model updates, and unfavorable mortality. Higher new life sales
increased driven by higher universal life products and gross deposits increased
driven by successful expansion of distribution.
Net income
Net income increased to USD 784 million in 2014 compared
with 2013. Lower underlying earnings before tax, higher other
charges, lower income before tax from run-off business and
lower realized gains were more than offset by lower losses from
fair value items and net reversals of impairments. Results on fair
value items amounted to a loss of USD 661 million, which was
primarily related to the impact on hedging programs as a result
of lower interest rates and higher equity markets. Realized gains
on investments amounted to USD 113 million. Net impairments
improved compared with 2013 to a benefit of USD 27 million as
recoveries, mostly related to investments in subprime residential
mortgage-backed securities, more than offset gross impairments.
Other charges were USD 69 million, and were primarily related
to a provision for the closed block of European direct marketing
activities and a write down of fixed assets in Aegon’s
Canadian business in anticipation of the sale, subject to
regulatory approval.
Underlying earnings before tax
Underlying earnings before tax in 2014 decreased 14% to
USD 1,506 million compared with 2013. Higher underlying
earnings before tax in variable annuities and pensions as a result
of higher balances due to business growth and favorable markets
were more than offset by lower underlying earnings before tax
from Life Protection and fixed annuities.
Underlying earnings before tax from Life Protection
decreased 72% compared to 2013 to USD 199 million as
growth from the business was more than offset by
the negative impact of assumption changes and model
updates (USD 400 million), unfavorable mortality and
the impact of lower interest rates. The actuarial assumption
updates were primarily related to updated mortality
assumptions for the older ages. The model updates were
primarily related to changes to modeled premium persistency.
Individual Savings Retirement underlying earnings before
tax increased 35% to USD 891 million compared to 2013.
Higher underlying earnings before tax from variable annuities
and mutual funds more than offset lower underlying earnings
before tax from fixed annuities. Underlying earnings before
tax from variable annuities were up 62% to USD 671 million
compared to 2013, resulting from the positive impact from
actuarial assumption changes and model update of
USD 174 million. Excluding this benefit, underlying earnings
before tax were up due to higher fee income from higher
account balances. Underlying earnings before tax from mutual
funds increased 42% to USD 47 million compared to 2013,
primarily driven by higher net inflows and favorable markets.
Underlying earnings before tax from fixed annuities was
down 20% to USD 172 million compared to 2013 as
the product is no longer being actively sold. Furthermore,
underlying earnings before tax from fixed annuities was
adversely impacted by assumption changes amounting to
USD 39 million.
Underlying earnings before tax from Employer Solutions
Pensions increased 9% to USD 381 million in 2014 compared
to 2013, primarily driven by higher balances as a result of
business growth and favorable markets.
Underlying earnings before tax in Canada amounted to
USD 30 million in 2014, compared to USD 4 million in 2013.
Increase is primarily driven by adverse impact from actuarial
assumption changes and model refinements recorded in
2013. In Latin America underlying earnings before tax were
down to USD 5 million.
Commissions and expenses
Commissions and expenses increased by 1% in 2014 to
USD 4,446 million compared with 2013. Operating expenses
decreased 2% in 2014 to USD 1,871 million compared with
2013, mainly as the benefit of lower restructuring costs more
than offset higher expenses driven by growth of the business.
31
CONTENTS
32. Production
New life sales increased 19% in 2014 to USD 733 million
compared with 2013 mostly as a result of higher universal life
sales. New premium production for accident health insurance
increased 32% in 2014 to USD 1,193 million compared with
2013. This was mostly driven by expanded distribution and higher
supplemental health sales due to the Affordable Care Act.
Gross deposits increased 12% in 2014 to USD 42.3 billion
compared with 2013. Gross deposits in variable annuities, retail
mutual funds and retirement plans were all higher in 2014.
Variable annuity gross deposits were up 20% to USD 10.2 billion
compared with 2013, mainly due to continued focus on key
distribution partners and distribution expansion through
alternative channels. In 2014, retirement plan gross deposits
were also higher compared with 2013, driven by plan takeovers
and the focus on retirement readiness by growing customer
participation and contributions.
Business overview Results of operations – Americas32
Annual Report 2015 CONTENTS
33. Overview of Americas
Aegon Americas comprises Aegon USA, which operates under the Transamerica
brand, together with operations in Brazil and Mexico.
Aegon USA
Aegon USA is one of the leading1
life insurance organizations in
the United States, and the largest of Aegon’s operating units
worldwide. It administers millions of policies and employs around
12,000 people. Most of Aegon USA's companies operate under
the Transamerica brand, one of the best-known2
names in
the United States for financial services (i.e. banks and businesses
engaged in issuing, administering and selling insurance products,
mutual funds, and other securities). Its companies have existed
since the mid-19th century, and its main offices are in Cedar
Rapids, Iowa, and Baltimore, Maryland – with additional offices
located throughout the United States.
Through these subsidiaries and affiliated companies, Aegon USA
provides a wide range of life insurance, supplemental health,
pensions, long-term savings and investment products.
Like other Aegon companies, Aegon USA uses a variety of
distribution channels to help customers access its products and
services as best suits their needs. Aegon USA distributes
products and services through a number of channels, including
agents, banks, investment advisers, registered representatives of
broker-dealers, the internet, and direct and worksite marketing.
Aegon Brazil
In 2009, Aegon acquired a 50% interest in Mongeral Aegon
Seguros e Previdência S.A., Brazil's fourth largest independent
(i.e. non-bank affiliated) life insurer. As of December 31, 2015,
Aegon Brazil had around 500 employees.
To further capture growth prospects in Brazil, on November 6,
2014, Mongeral Aegon and Bancoob (Banco Cooperativo do
Brasil) signed an agreement to establish a new life insurance and
pensions company dedicated to providing life insurance and
pension products and services to the Sicoob system. Sicoob is
the largest cooperative financial system in the country, with over
3 million associates and 2,340 points of service. Bancoob is
a private commercial bank owned by the credit cooperative
entities affiliated with the Sicoob system. This agreement
represents a key expansion of distribution for Mongeral Aegon,
which already serves over 2 million customers nationwide
through over 4,000 broker partners. The venture is still subject
to final regulatory approval from SUSEP (Superintendência
de Seguros Privados).
Aegon Mexico
In 2006, Aegon acquired a 49% interest in Seguros Argos S.A.
de C.V., a Mexican life insurance company. In 2013, Aegon entered
into a joint venture with Administradora Akaan S.A. de C.V. to
create Akaan-Aegon S.A.P.I. de C.V. and explore financial service
opportunities. This organization is in the start-up phase and will
initially focus on third-party asset management. As of
December 31, 2015, Aegon Mexico had around 40 employees.
Aegon Canada
On July 31, 2015, Aegon completed the sale of its Canadian life
insurance business to Wilton Re following regulatory approval.
The agreement to sell Aegon’s Canadian life insurance was
announced on October 16, 2014. Based in Toronto, Aegon Canada
offered a range of insurance products and financial services,
primarily through its Transamerica Life Canada and Canadian
Premier Life subsidiaries. Aegon maintains an insurance agency
operating in Canada as World Financial Group Insurance Agency
of Canada Inc., in addition to an affiliated securities dealer.
Organizational structure
Aegon USA
Aegon USA was founded in 1989, when Aegon brought all of
its operating companies in the United States together under
a single financial services holding company: Aegon USA, LLC.
As of December 31, 2015, Aegon USA, LLC was merged into
Transamerica Corporation, which is the holding company for
the US operations. Business is conducted through its various
subsidiaries. The use of the term 'Aegon USA' throughout this
document refers to the operating subsidiaries in the United States,
through which Aegon USA conducts business. Aegon USA has
operating licenses in every US state, in addition to the District
of Columbia, Puerto Rico, the Virgin Islands and Guam.
Aegon USA's primary insurance subsidiaries are:
Transamerica Life Insurance Company;
Transamerica Financial Life Insurance Company;
Transamerica Advisors Life Insurance Company;
Transamerica Premier Life Insurance Company; and
Transamerica Casualty Insurance Company.
In 2015, Aegon USA was organized into two divisions
each operating through one or more of the Aegon USA life
insurance companies:
Life Protection (LP); and
Investments Retirement (IR).
1 Source: A.M. Best.
2 Source: BrandPower Analysis.
33
CONTENTS
34. These divisions, described in greater detail below, represent
groups of products and services that Aegon USA offers through
a number of distribution methods and sales channels.
The business structure is designed to enable Aegon USA to
manage and improve the efficiency of the organization and
operating processes, identify business synergies, and pursue
cross-selling opportunities. Coordinated support services
complement operations by providing functional support in
systems technology, investment management, regulatory
compliance, and various corporate functions. Products are also
offered and distributed through one or more of Aegon USA's
licensed insurance or brokerage subsidiary companies.
Overview of sales and distribution channels
Aegon USA
Aegon USA uses a variety of sales and distribution channels in
the United States. These include:
Affinity groups;
Banks;
Benefit consulting firms;
Direct- to-consumer;
Independent and career agents;
Independent marketing organizations;
Institutional partners;
Registered representatives of regional and independent
broker-dealers;
Registered investment advisers;
Third-party administrators;
Wirehouses; and
Worksite.
In general, Aegon USA companies are focused on particular
products or market segments, ranging from lower income to
high-net-worth individuals, and from small to large institutions.
Overview of business lines
Aegon USA
Life Protection
Life Protection (LP) offers a comprehensive portfolio of
protection solutions to customers in a broad range of market
segments. Consumers may choose to purchase through
independent distributors, sales associates with an exclusive
relationship to Transamerica, through the worksite, or directly
from Aegon USA’s subsidiaries.
Products
Products offered include term life insurance, universal life,
variable universal life, indexed universal life and whole life
insurance, in addition to supplemental health, long-term care
insurance, and specialty coverage.
Term life insurance
Term life insurance provides protection for a stated period of
time. Benefits are paid to policy beneficiaries in the event of
the death of the insured during a specified period.
Universal life insurance
Universal life insurance is flexible permanent life insurance
that offers death benefit protection together with the potential
for cash value accumulation. The frequency and amount of
premiums, in addition to the death benefit, can be adjusted as
a policyholder's circumstances change. A version of this product
has 'secondary guarantees,' which guarantee continuation of
the life insurance if the customer consistently pays an agreed
minimum amount of premium each year. Transamerica withdrew
its universal life secondary guarantees product in early 2015,
in response to the low and volatile interest rate environment.
Variable universal life insurance
Variable universal life insurance is cash-value life insurance
that offers both a death benefit and an investment feature.
The premium amount for variable universal life insurance is
flexible and, within contract limits, may be changed by
the consumer as needed, although these changes can result in
a change in the coverage amount. The investment feature usually
includes 'sub-accounts,' which function like mutual funds and can
provide exposure to stocks and bonds. This exposure offers
the possibility of an increased (or decreased) rate of return over
a universal life or permanent insurance policy.
Indexed universal life insurance
Indexed Universal Life (IUL) insurance provides permanent death
benefit protection and cash value accumulation with flexible
premium payments. What distinguishes it from other types of
cash value insurance is the way interest earnings are credited.
Net premiums may be allocated to either a fixed account or
indexed accounts. Indexed accounts credit interest based in part
on the performance of one or more major stock market indices.
The credited interest is based on the index, but with a floor and
a cap. IUL offers both market-paced growth potential in
the indexed accounts and downside protection. It is an appealing
alternative to regular Universal Life – for which interest is
credited at a fixed rate – and Variable Universal Life, in which
the cash value is directly exposed to ups and downs of
the market.
Whole life insurance
Whole (or permanent) life insurance provides lifelong death
benefit protection, provided that the premiums required are paid,
while accumulating tabular cash values based on statutory
requirements. Premiums are generally fixed and usually payable
over the life of the policy.
Supplemental health
Supplemental health insurance products include accidental
death, accident, cancer, critical illness, disability, hospital
indemnity, Medicare Supplement, Medicare Part D prescription
drug, and retiree medical.
A number of these products provide insureds with lump sum or
specified income payments if hospitalized or diagnosed with
Business overview Results of operations – Americas34
Annual Report 2015 CONTENTS
35. a critical illness. Others pay benefits for specific medical
expenses and treatments, or cover deductibles, co-payments and
co-insurance amounts not covered by other health insurance. In
addition, LP offers stop-loss insurance to employers to protect
against catastrophic losses under self-funded health plans.
Long-term care insurance
Long-term care (LTC) insurance products provide benefits to
policyholders that require care due to a qualifying chronic illness
or cognitive impairment. LTC insurance serves as an asset
protection tool by reimbursing policyholders for costly expenses
associated with LTC services, and it may also help families better
manage the financial, health and safety issues associated
with LTC.
Life Protection sales and distribution
The LP division is organized by distribution channel to better
align with customers’ needs. It is supported by a shared services
platform. Each channel has primary target market segments
on which it focuses. The LP distribution channels fall into
four main categories: independent, partner, worksite and
direct-to-consumer.
Independent
This channel offers life insurance (term life, universal life, variable
and indexed universal life and whole life), long-term care and
supplemental health products and services through approximately
65,000 independent brokerage distributors and financial
institutions that target the affluent, emerging affluent and
middle markets. These products are designed for family
protection, business needs, and estate and legacy planning.
Partner
Through exclusive relationships with over 35,000 sales
associates, this channel provides the same life and health
products as the independent distribution channel, with a focus
on the middle and emerging affluent markets.
Worksite
The LP division is also active in the employee benefits market.
It offers life and supplemental health insurance products
through employers, labor unions and trade associations.
The comprehensive portfolio includes universal life, whole life
and term life insurance, in addition to accident, critical illness,
cancer, hospital indemnity, supplemental medical expense,
short-term disability, vision, and dental policies.
Direct-to-consumer
Transamerica Direct targets consumers in the mass affluent,
emerging mass affluent and middle markets both directly and
via affinity endorsements to provide them with easy access to
insurance, investment and retirement solutions.
Investments Retirement
Investments Retirement (IR) offers a wide range of solutions
to serve customers to and through retirement: first, as they
accumulate assets; and second, as they manage assets to
generate retirement income. The division administers these
products, and distributes them through a variety of channels,
including wirehouse firms, banks, broker-dealers, consultants,
insurance agents, registered investment advisors, independent
financial planners, and direct-to-consumer.
Investments Retirement products
IR products and services include mutual funds, variable and
fixed annuities, retirement plans (including ancillary services)
and stable value solutions.
Mutual funds
IR provides a wide range of specialized mutual funds for all
market conditions, including asset allocation, US equity, global/
international equity, alternative investments, hybrid allocation,
fixed income and target date funds. Funds are offered through
Transamerica Asset Management (TAM), a sub-advised or
'manager of managers' mutual fund platform. Sub-advisers can
include both those affiliated or not affiliated with Transamerica.
Variable annuities
For new sales, IR currently offers several different variable
annuity products to meet a range of investor needs. IR also
offers guaranteed living benefits, often referred to as riders.
Variable annuities allow the holder to accumulate assets for
retirement on a tax-deferred basis and to participate in equity or
bond market performance, in addition to receiving one of many
payout options designed to help meet the policyholder’s need for
income in retirement. Variable annuity payments can vary based
on investment performance. Guaranteed living benefits (GLBs) are
generally optional guarantees that can be embedded into variable
annuity products. GLBs are intended to provide a significant
measure of protection against market risk while the annuitant is
alive. IR offers different forms of GLBs, such as guaranteeing an
income stream for life and/or guaranteeing principal protection.
Fixed annuities
Fixed annuities allow investors to make a lump-sum payment or
a series of payments and receive income in the form of periodic
payments that can begin immediately or after a period of time.
IR introduced a new fixed-indexed annuity in 2015. A fixed-
indexed annuity may credit interest using an annual point-to-
point crediting method based, in part, on the percentage change
in the value of the selected index account option(s) at the start
and end of the crediting period. A fixed account option is also
available. Transamerica is not actively marketing new sales of
fixed deferred annuities; current sales primarily represent
annuitizations and additional premium on existing contracts.
35
CONTENTS