Download as PDF, PPTX
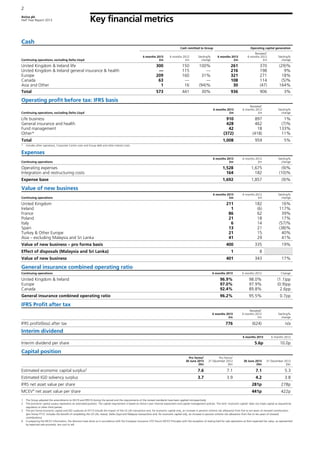

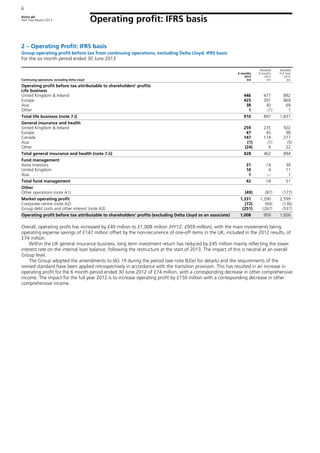
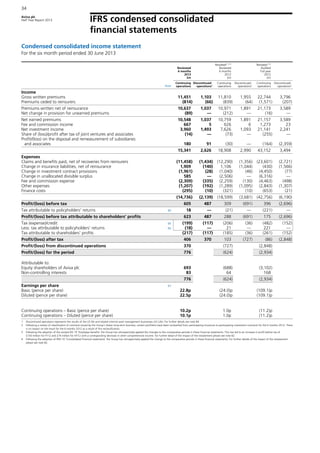
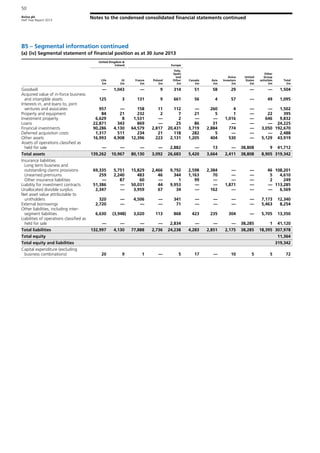

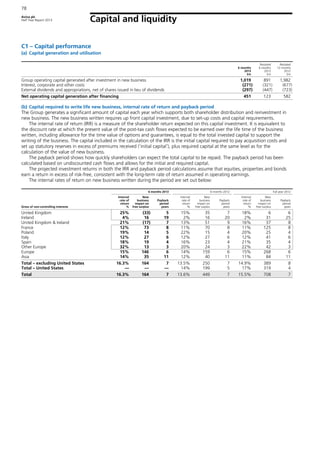
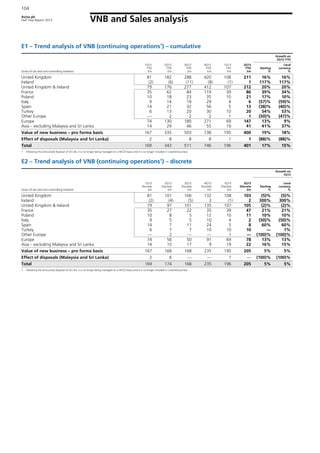
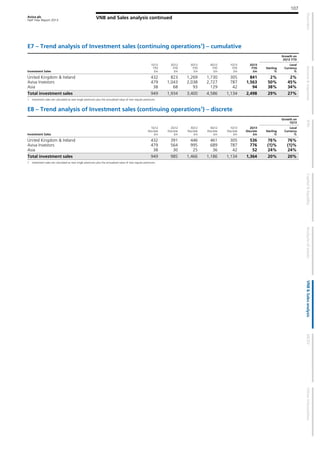
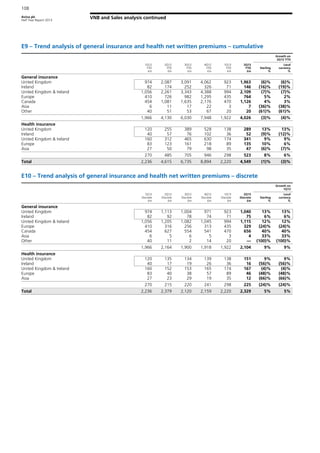
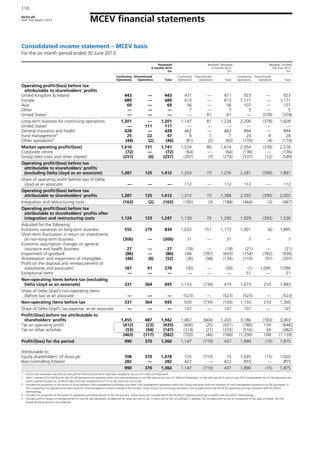
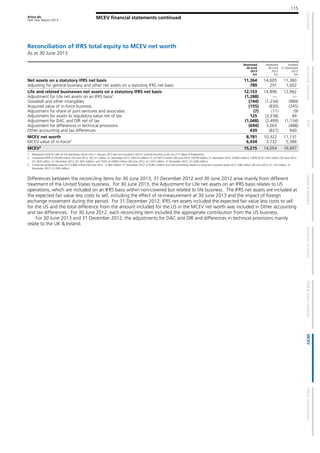
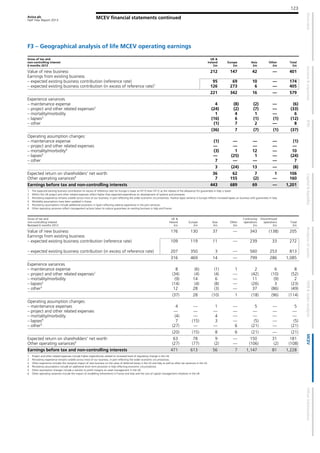

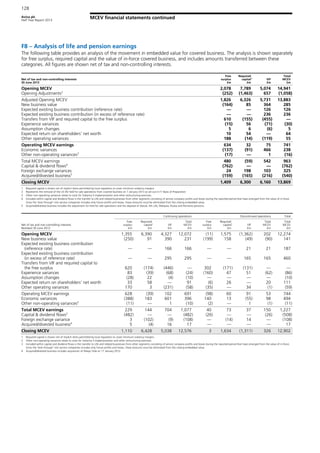
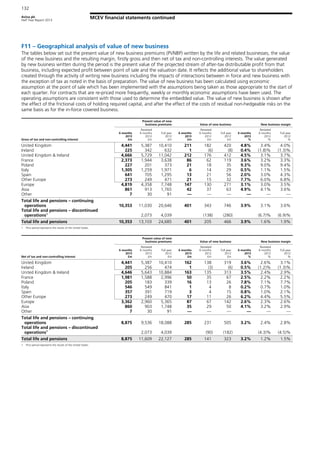
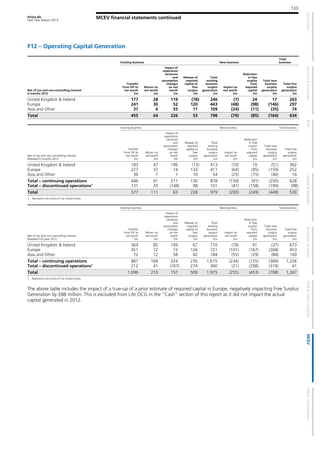
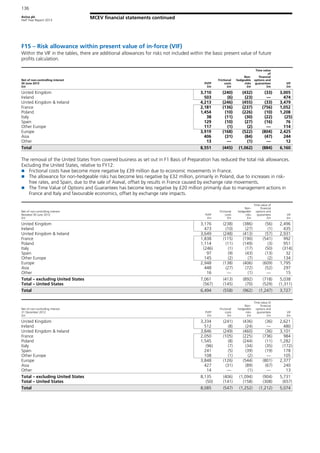


Aviva plc reported a satisfactory interim performance for the first half of 2013, achieving a profit after tax of £776 million, up from a loss of £624 million the previous year, with a 30% increase in cash remittances to the group to £573 million. The value of new business rose by 17% to £401 million, driven primarily by growth in the UK, France, Poland, Turkey, and Asia, while operating expenses decreased by 9%. The company remains focused on addressing legacy issues while unlocking value in its turnaround and growth segments.


![AvivaAtAGlance[1] (1)](https://cdn.slidesharecdn.com/ss_thumbnails/0383d1f9-7eaf-47be-83f1-f4a102e2de00-160917012456-thumbnail.jpg?width=640&height=640&fit=bounds)


![Awareness of digital currency[1] (1).pptx](https://cdn.slidesharecdn.com/ss_thumbnails/awarenessofdigitalcurrency11-260125155504-b1badee4-thumbnail.jpg?width=640&height=640&fit=bounds)


