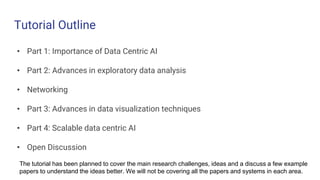
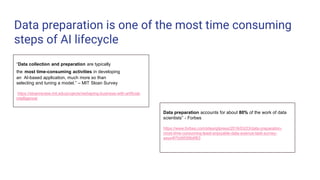
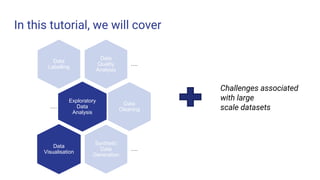
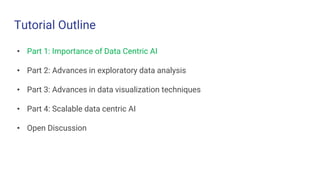
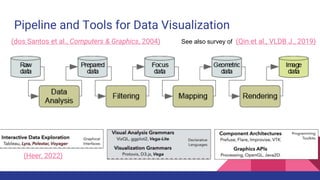
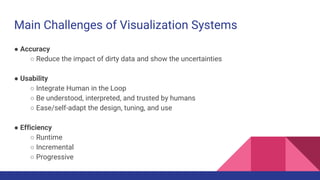
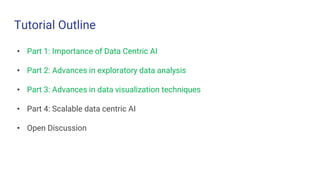
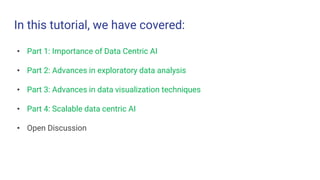
Advances in Exploratory Data
Analysis, Visualisation and Quality for
Data Centric AI Systems
Please add
your picture
in the box
here
Hima Patel Shanmukha
Guttula
Ruhi Sharma
Mittal
Naresh
Manwani
Laure Berti-
Equille
Abhijit
Manatkar
Who are we
IBM Research, India
The International
Institute of Information
Technology Hyderabad,
India
Institut de Recherche
pour le Développement,
France
Hima Patel Shanmukha
Guttula
Ruhi Sharma
Mittal
Naresh Manwani Abhijit Manatkar
Laure Berti-Equille
Hima Patel
Senior Technical Staff Member
Research Manager, Data and Hybrid Platforms
IBM Research India
Tutorial will be presented by:
@hima_patel
Tutorial Outline
• Part 1: Importance of Data Centric AI
• Part 2: Advances in exploratory data analysis
• Networking
• Part 3: Advances in data visualization techniques
• Part 4: Scalable data centric AI
• Open Discussion
The tutorial has been planned to cover the main research challenges, ideas and a discuss a few example
papers to understand the ideas better. We will not be covering all the papers and systems in each area.
Part 1: Importance of Data Centric AI
Once upon a time..
Yay!! I am so
excited!!
After many weeks…
Still struggling
with the data
?
Data preparation is one of the most time consuming
steps of AI lifecycle
“Data collection and preparation are typically
the most time-consuming activities in developing
an AI-based application, much more so than
selecting and tuning a model.” – MIT Sloan Survey
https://sloanreview.mit.edu/projects/reshaping-business-with-artificial-
intelligence/
Data preparation accounts for about 80% of the work of data
scientists” - Forbes
https://www.forbes.com/sites/gilpress/2016/03/23/data-preparation-
most-time-consuming-least-enjoyable-data-science-task-survey-
says/#70d9599b6f63
Data preparation is also imperative for building AI
models
Data preparation for AI is a foundational and critical step for building better and faster AI pipelines
Broad components of data centric AI systems
Data
Quality
Analysis
….
Exploratory
Data
Analysis
Data
Visualisati
on
….
Data
Cleaning
Synthetic
Data
Generation
….
Data
Labelling
Enterprise data centric AI systems are expected to..
Data
Quality
Analysis
….
Explorator
y Data
Analysis
Data
Visualis
ation
….
Data
Cleaning
Syntheti
c Data
Generati
on
….
Data
Labelling
• Work on large datasets (Gigabytes, terabytes,..)
• Data is stored in multiple tables and in multiple sources..
• Be compute aware
Data Quality for ML and Cleaning
Gupta et al, KDD 2021 Jain et al, KDD 2020
Data Quality for
ML
Tabular
Datasets
Unstructured
Datasets
Spatio Temporal
Datasets
Metrics to measure data quality for ML tasks:
 Data Cleaning
 Class Imbalance
 Data Valuation
 Data Homogeneity
 Data Transformation
 Label Noise
 Class Overlap
 ….
Select open source libraries:
Data Quality For AI :
https://developer.ibm.com/apis/catalog/dataquality4ai--data-quality-
for-ai/Introduction/
Tensorflow Data Validation: https://www.tensorflow.org/tfx/guide/tfdv
Pandas Profiler: https://github.com/pandas-profiling/pandas-profiling
Data
Quality
Analysis
….
Explorator
y Data
Analysis
Data
Visualis
ation
….
Data
Cleaning
Syntheti
c Data
Generati
on
….
Data
Labelling
In this tutorial, we will cover
Data
Quality
Analysis
….
Data
Labelling
Exploratory
Data
Analysis
….
Data
Cleaning
Synthetic
Data
Generation
….
Data
Visualisation
Challenges associated
with large
scale datasets
Tutorial Outline
• Part 1: Importance of Data Centric AI
• Part 2: Advances in exploratory data analysis
• Part 3: Advances in data visualization techniques
• Part 4: Scalable data centric AI
• Open Discussion
Part 2: Advances in Exploratory Data
Analysis (EDA)
Importance of EDA
Before making inferences on your data, it is necessary to examine and understand
all your variables.
Why?
● To discover trends and relationships present in the data
● To find violations of statistical assumptions
● To catch data quality issues
● To uncover the structure of your dataset
Challenges while performing EDA
● Manual EDA is cumbersome and time consuming.
● Requires profound analytical skills
● Domain knowledge or access to subject matter expert
for the dataset
● No standard steps, varies from data scientist to data
scientist based on experience and skills.
To overcome the above challenges, there has been a
focus on automation of EDA in the last few years.
Broad areas of research
1. Automatic Interactive Data Exploration Techniques
2. EDA by capturing and predicting user’s interest
3. End to end EDA Automation and explanations
Automatic
Interactive Data
Exploration
Automatic Interactive Data
Exploration Techniques
EDA by capturing and
predicting user’s interest
End to end EDA Automation
and explanations
Steps followed by a user for data exploration
“Manual” iterative exploration:
• Query formulation
• Query processing
• Result reviewing (and back to step 1)
Challenges:
• Ad-hoc queries: “correct” predicates are unknown a priori
• Labor intensive: thousands of objects to review
• Resource intensive: execution of long query sequences on big data
Automation ideas
● Exploration model
• Relies on user’s relevance feedback on data samples
• Eliminates query formulation step
• Navigates the user through the data space
• Reduces result reviewing overhead
● Performance goals
• Effectiveness
• Captures user interests with high accuracy
• Efficiency
• Minimizes reviewing effort and compute effort
• Offers interactive experience
Active Learning Based Interactive Database Exploration
(AIDE) Huang et al. 2018, Dimitriadau et al. 2016
Picture Credit: Dimitriadau et al. 2016
Classification and Query Formulation
Dimitriadau et al. 2014
EDA by capturing
and predicting
user’s interest
Automatic Interactive Data
Exploration Techniques
EDA by capturing and
predicting user’s interest
End to end EDA Automation
and explanations
Capturing user’s interest
In interactive data exploration systems, a user’s interest is captured via feedback
on relevant samples
However, user’s interest is :
- Subjective
- Can change dynamically in the same session
- Contextual (based on what was seen previously)
- May not be captured by one mathematical expression (interestingness
measure)
Interestingness Measures
Interestingness measures in the literature can be broadly grouped into following
buckets:
1. Diversity: Displays whose elements demonstrate notable differences in
values, are ranked higher.
2. Dispersion: It favors displays which have relatively similar elements.
3. Peculiarity: A display is peculiar if it presents or contains anomalous
patterns.
4. Conciseness: Such measures consider the size of the display, i.e. the number
of elements it contains. Displays that convey thousands of rows are difficult
to interpret, therefore are considered less interesting.
Geng and Hamilton, 2006 , McGarry, 2005.
Capture user interestingness from session logs Milo et al,
2019
Dynamic Interest Selection as Multiclass
Classification Milo et al. 2019
1. Given EDA sessions, create training data with the following input-output pairs.
Input is the current state of the EDA and output is the interesting measure.
2. Interesting measure can be found using approach discussed just now.
3. Thus, each interestingness measure is treated as a class.
4. Train a multiclass classifier using the session logs
5. At every step, dynamic interest selection is treated as multiclass
classification problem.
End to end EDA
Automation and
Explanations
Automatic Interactive Data
Exploration Techniques
EDA by capturing and
predicting user’s interest
End to end EDA Automation
and explanations
Fully Automated EDA
Fully Automated EDA: Given an input dataset, generate entire EDA session which
captures dataset highlights and interesting aspects.
Generated sessions should allow users to gain preliminary insights on their
dataset.
Reduced manual efforts and inputs.
ATENA: Deep RL Model for Fully Auto EDA (El et al.
2020)
Dataset
EDA
sessions
for the full
dataset
Use deep reinforcement learning method to generate EDA sessions
Main idea is to use interestingness measures as rewards.
ATENA: State and Action Spaces, Rewards
State Space: Display dt is encoded to a numeric vector, with the following
features:
Entropy, number of distinct values, and the number of null values for each
attribute.
For each attribute, whether it is currently grouped/aggregated.
Number of groups and the groups’ size mean and variance.
Display vectors of three most recent operations in the session.
Action Space: FILTER(attr, op, term), GROUP(g_attr, agg_func, agg_attr), BACK()
ATENA: State and Action Spaces, Rewards
Rewards:
Interestingness reward for group-by operations: promotes compact group-by
results that covers many tuples as both informative and easy to understand.
Interestingness reward for filter operations:favors filter operations whose result
display dt deviates significantly from the previous display dt−1
Diversity: To encourage actions inducing new observations of different parts of
the data than those examined thus far.
Coherency: Sequence of operations is compelling and easy to follow
Balancing Familiarity and Curiosity in Data Exploration with
Deep Reinforcement Learning (Personnaz et al. 2021)
Proposed Solution:
Modeled as A3C DRL Agent
Reward is defined as a function of familiarity and curiosity.
Auto Explanation of EDA Notebooks
EDA notebooks created by data
scientists are often referred back for
performing similar analysis.
However, most of these EDA
notebooks are not well documented
and explanation of each view is
missing.
For example, at each view, the
algorithm can tell which of the
element is most interesting.
ExplainED: Explanations for EDA Notebooks
Deutch et al. 2020.
Challenges:
1. How to evaluate the interestingness of the view?
Pick an interestingness measure from the list of possible measures that has
the highest score for a given view
2. How to show the most interesting part of the view?
Find the part of the tuple that contributes most to the interestingness score
via Shapley values (similar idea as feature selection)
Open Challenges
1. Can the rewards be made generic for any usecase? Can they be extended
to take care of operators specific to ML usecases (e.g. outliers, label
noise etc)
2. How to make the auto-generated sessions personalized, reactive to
users’ information needs?
3. How to build an effective, reproducible, experimental framework to
evaluate the quality of auto-generated sessions?
Summary
Three main areas:
Automatic Interactive Data Exploration Techniques
EDA by capturing and predicting user’s interest
End to end Automated EDA and explanations
Early work with deep learning systems and opportunity to expand
with more operators and generalization across usecases
Tutorial Outline
• Part 1: Importance of Data Centric AI
• Part 2: Advances in exploratory data analysis
• Part 3: Advances in data visualization techniques
• Part 4: Scalable data centric AI
• Open Discussion
Part 3: Visualization Systems
and Pipelines
Pipeline and Tools for Data Visualization
(Heer, 2022)
See also survey of (Qin et al., VLDB J., 2019)
(dos Santos et al., Computers & Graphics, 2004)
Main Challenges of Visualization Systems
● Accuracy
○ Reduce the impact of dirty data and show the uncertainties
● Usability
○ Integrate Human in the Loop
○ Be understood, interpreted, and trusted by humans
○ Ease/self-adapt the design, tuning, and use
● Efficiency
○ Runtime
○ Incremental
○ Progressive
Interactive
Visualization
Interactive
Visualization
Broad research areas
● Visualizations for data quality control
● Interactive visualization techniques
● Visualization recommendations techniques
Visualizations for
Data Quality
Control
Visualizations for Data Quality
Control
Interactive Visualization
Visualization
Recommendation
Designing a Visual Analysis Pipeline for DQ Control:
Screening – Diagnosis – Correction
Adapted from Van
den Broeck et al.,
2005 by Liu et al.,
2018
Visualization Tools for Data Quality Control
(Ward et al. 2008) proposed a methodology to
measure and expose: data quality, abstraction
quality, and visual quality.
Among many DQ-ware visualisation tools:
- DaVis (Sulo et al., 2005)
- TimeCleanser (Gschwandtner et al., 2014)
- VisPlause (Arbesser et al, 2017)
(Kandel et al., 2011)
Visplause for DQ checks Arbesser et al, IEEE Trans. VCG 2017
https://www.youtube.com/watch?v=5stVUf5CC3E
TimeCleanser for Time-oriented data cleansing
Gschwandtner et al., 2014
Time-oriented data quality checks with a set of corresponding visual artifacts
Open areas/questions
● As we move towards more of AI usecases, there is a need for visualization
systems to focus on data quality for ML issues along with existing checks.
Interactive
Visualization
Visualizations for Data Quality
Control
Interactive Visualization
Visualization
Recommendation
Interactive Visualization Shen et al., IEEE TVCG 2022
Visualization-oriented Natural Language Interfaces (V-NLI)
● NL2VIS systems take NL
queries as inputs and
provide visualizations as
output.
● Fundamental challenges:
○ Query intent understanding
○ Data transformation
○ Visual Mapping
○ View transformations
○ Human in loop interactions
○ Dialogue management
ncNet Luo et al, IEEE VCG 2021
ncNet: Natural Language to Visualization by Neural Machine Translation
Data-Debugging Through Interactive Visual
Explanations (Afzal et al, 2021)
● Data readiness as an
important module for
ML pipelines
● Certain remediations to
the data (example
change of bad labels
caused due to labeling
mistakes) needs SME
input and review
Proposed Methodology
Global View and Local View
Global view Local view
Open areas and questions
● As we move towards more of AI usecases, there is a need for visualization
systems to focus on data quality for ML issues along with existing checks.
● V-NLI interfaces today support queries closer to usecases to derive analytical
insights. Can it support queries for AI usecases (example find all label noise
data points in the data)
Visualization
Recommendation
Visualizations for Data Quality
Control
Interactive Visualization
Visualization
Recommendation
Importance of Visualization Recommendations
● Manual Visualization
○ Trial and error based model
○ Visual Encoding: Identify appropriate type of visualization (charts,
transformations)
○ Implementation: Code the visualization
● Automated Visualization Recommendations: automatically recommend (type of
graph, field to be encoded) for a given dataset
○ learn the visualization rules from data, experience , or user history
○ Incorporates data, visualization design context, user behavior etc.
Types of Visualization Recommendations Qin et al., VLDB J., 2019
Voyager (Rule Based) Wongsuphasawat et.al, TVCG 2016
● Architecture ● An Example
DeepEye (Hybrid) Luo et al, IEEE ICDE 2018
● DeepEye, an automatic data visualization system that tackle
○ Visual Recognition: given a visualization, is it “good” or “bad”?
○ Visualization Ranking: given two visualizations, which one is “better”?
○ Visualization Selection: given a dataset, how to find top-k visualizations?
VizML (ML based) Hu et al, ACM CHI 2019
● A Machine Learning Approach to Visualization Recommendation
Concluding Remarks
● Visual analytics offers efficient tools to help and engage the users in
data quality analysis and improvement
● Human in the loop still comes with multiple usability challenges
● The 4 Vs of Big Data
● There are many opportunities for:
○ Managing and orchestrating human/machine resources
○ Recommending features & impactful and accurate visualizations
○ Revisiting our frameworks and technologies to integrate adaptive
visual and interactive layers to ML black-boxes
62
Tutorial Outline
• Part 1: Importance of Data Centric AI
• Part 2: Advances in exploratory data analysis
• Part 3: Advances in data visualization techniques
• Part 4: Scalable data centric AI
• Open Discussion
Data Centric AI for real workloads
Enterprise ML systems
Chall
Hidden technical debt in machine learning systems (Sculley, NeurIPS 2015)
Industry Challenges
● Growing data sizes: terabytes and petabytes of data
● How to conduct data quality checks?
● How to explore and visualize data efficiently?
● Compute considerations (also related to sustainability)
● Data is stored in different databases/sources
● connectivity to different sources, different schemas, ..
Automating data quality for ML at scale
● Schelter, 2018, Schelter, 2019 describe a system that is built on Spark and
can perform unit tests on data, built and deployed at Amazon
● Swami, ICDE 2020 describe a system “Data Sentinel” which is a declarative
production-scale data validation platform, built and deployed at LinkedIn.
● Breck, SysML 2019 describe a data validation for ML system that is designed
to detect anomalies specifically in data fed to ML pipelines. This is part of
TFX, a ML platform at Google.
Automating Large Scale Data Quality Verification
(Schelter, 2018, Schelter, 2019)
Deequ : Open Source Library
https://github.com/awslabs/deequ
Metrics supported by the system
Data Quality Checking for Machine Learning with
MeSQuaL (Comignani, EDBT 2020)
RASL: Relational Algebra in Scikit-Learn
Pipelines(Sahni et al, 2021)
● One common practice is to use Spark for
data preprocessing, using aggregation to
reduce its size, followed by scikit-learn for
machine learning in a separate pipeline.
● This paper suggests adding relational
algebra operators (e.g. join, aggregates) to
Scikit-learn, such that these operators have
the same scikit learn syntax and semantics
Visualization of the data preparation part
Using RASL
Open Source : https://github.com/ibm/lale
Conclusions
● Scalability to large datasets is critical for enterprise workloads
● Some systems have been proposed that take advantage of architectures like
Spark to process large datasets
● Open areas on how to make these systems scalable for any data centric AI
operations like detection of label noise
In this tutorial, we have covered:
• Part 1: Importance of Data Centric AI
• Part 2: Advances in exploratory data analysis
• Part 3: Advances in data visualization techniques
• Part 4: Scalable data centric AI
• Open Discussion
Thank you for your time and
attention!

Advances in Exploratory Data Analysis, Visualisation and Quality for Data Centric AI Systems

  • 1.
    Advances in ExploratoryData Analysis, Visualisation and Quality for Data Centric AI Systems Please add your picture in the box here Hima Patel Shanmukha Guttula Ruhi Sharma Mittal Naresh Manwani Laure Berti- Equille Abhijit Manatkar
  • 2.
    Who are we IBMResearch, India The International Institute of Information Technology Hyderabad, India Institut de Recherche pour le Développement, France Hima Patel Shanmukha Guttula Ruhi Sharma Mittal Naresh Manwani Abhijit Manatkar Laure Berti-Equille
  • 3.
    Hima Patel Senior TechnicalStaff Member Research Manager, Data and Hybrid Platforms IBM Research India Tutorial will be presented by: @hima_patel
  • 4.
    Tutorial Outline • Part1: Importance of Data Centric AI • Part 2: Advances in exploratory data analysis • Networking • Part 3: Advances in data visualization techniques • Part 4: Scalable data centric AI • Open Discussion The tutorial has been planned to cover the main research challenges, ideas and a discuss a few example papers to understand the ideas better. We will not be covering all the papers and systems in each area.
  • 5.
    Part 1: Importanceof Data Centric AI
  • 6.
    Once upon atime.. Yay!! I am so excited!! After many weeks… Still struggling with the data ?
  • 7.
    Data preparation isone of the most time consuming steps of AI lifecycle “Data collection and preparation are typically the most time-consuming activities in developing an AI-based application, much more so than selecting and tuning a model.” – MIT Sloan Survey https://sloanreview.mit.edu/projects/reshaping-business-with-artificial- intelligence/ Data preparation accounts for about 80% of the work of data scientists” - Forbes https://www.forbes.com/sites/gilpress/2016/03/23/data-preparation- most-time-consuming-least-enjoyable-data-science-task-survey- says/#70d9599b6f63
  • 8.
    Data preparation isalso imperative for building AI models Data preparation for AI is a foundational and critical step for building better and faster AI pipelines
  • 9.
    Broad components ofdata centric AI systems Data Quality Analysis …. Exploratory Data Analysis Data Visualisati on …. Data Cleaning Synthetic Data Generation …. Data Labelling
  • 10.
    Enterprise data centricAI systems are expected to.. Data Quality Analysis …. Explorator y Data Analysis Data Visualis ation …. Data Cleaning Syntheti c Data Generati on …. Data Labelling • Work on large datasets (Gigabytes, terabytes,..) • Data is stored in multiple tables and in multiple sources.. • Be compute aware
  • 11.
    Data Quality forML and Cleaning Gupta et al, KDD 2021 Jain et al, KDD 2020 Data Quality for ML Tabular Datasets Unstructured Datasets Spatio Temporal Datasets Metrics to measure data quality for ML tasks:  Data Cleaning  Class Imbalance  Data Valuation  Data Homogeneity  Data Transformation  Label Noise  Class Overlap  …. Select open source libraries: Data Quality For AI : https://developer.ibm.com/apis/catalog/dataquality4ai--data-quality- for-ai/Introduction/ Tensorflow Data Validation: https://www.tensorflow.org/tfx/guide/tfdv Pandas Profiler: https://github.com/pandas-profiling/pandas-profiling Data Quality Analysis …. Explorator y Data Analysis Data Visualis ation …. Data Cleaning Syntheti c Data Generati on …. Data Labelling
  • 12.
    In this tutorial,we will cover Data Quality Analysis …. Data Labelling Exploratory Data Analysis …. Data Cleaning Synthetic Data Generation …. Data Visualisation Challenges associated with large scale datasets
  • 13.
    Tutorial Outline • Part1: Importance of Data Centric AI • Part 2: Advances in exploratory data analysis • Part 3: Advances in data visualization techniques • Part 4: Scalable data centric AI • Open Discussion
  • 14.
    Part 2: Advancesin Exploratory Data Analysis (EDA)
  • 15.
    Importance of EDA Beforemaking inferences on your data, it is necessary to examine and understand all your variables. Why? ● To discover trends and relationships present in the data ● To find violations of statistical assumptions ● To catch data quality issues ● To uncover the structure of your dataset
  • 16.
    Challenges while performingEDA ● Manual EDA is cumbersome and time consuming. ● Requires profound analytical skills ● Domain knowledge or access to subject matter expert for the dataset ● No standard steps, varies from data scientist to data scientist based on experience and skills. To overcome the above challenges, there has been a focus on automation of EDA in the last few years.
  • 17.
    Broad areas ofresearch 1. Automatic Interactive Data Exploration Techniques 2. EDA by capturing and predicting user’s interest 3. End to end EDA Automation and explanations
  • 18.
    Automatic Interactive Data Exploration Automatic InteractiveData Exploration Techniques EDA by capturing and predicting user’s interest End to end EDA Automation and explanations
  • 19.
    Steps followed bya user for data exploration “Manual” iterative exploration: • Query formulation • Query processing • Result reviewing (and back to step 1) Challenges: • Ad-hoc queries: “correct” predicates are unknown a priori • Labor intensive: thousands of objects to review • Resource intensive: execution of long query sequences on big data
  • 20.
    Automation ideas ● Explorationmodel • Relies on user’s relevance feedback on data samples • Eliminates query formulation step • Navigates the user through the data space • Reduces result reviewing overhead ● Performance goals • Effectiveness • Captures user interests with high accuracy • Efficiency • Minimizes reviewing effort and compute effort • Offers interactive experience
  • 21.
    Active Learning BasedInteractive Database Exploration (AIDE) Huang et al. 2018, Dimitriadau et al. 2016 Picture Credit: Dimitriadau et al. 2016
  • 22.
    Classification and QueryFormulation Dimitriadau et al. 2014
  • 23.
    EDA by capturing andpredicting user’s interest Automatic Interactive Data Exploration Techniques EDA by capturing and predicting user’s interest End to end EDA Automation and explanations
  • 24.
    Capturing user’s interest Ininteractive data exploration systems, a user’s interest is captured via feedback on relevant samples However, user’s interest is : - Subjective - Can change dynamically in the same session - Contextual (based on what was seen previously) - May not be captured by one mathematical expression (interestingness measure)
  • 25.
    Interestingness Measures Interestingness measuresin the literature can be broadly grouped into following buckets: 1. Diversity: Displays whose elements demonstrate notable differences in values, are ranked higher. 2. Dispersion: It favors displays which have relatively similar elements. 3. Peculiarity: A display is peculiar if it presents or contains anomalous patterns. 4. Conciseness: Such measures consider the size of the display, i.e. the number of elements it contains. Displays that convey thousands of rows are difficult to interpret, therefore are considered less interesting. Geng and Hamilton, 2006 , McGarry, 2005.
  • 26.
    Capture user interestingnessfrom session logs Milo et al, 2019
  • 27.
    Dynamic Interest Selectionas Multiclass Classification Milo et al. 2019 1. Given EDA sessions, create training data with the following input-output pairs. Input is the current state of the EDA and output is the interesting measure. 2. Interesting measure can be found using approach discussed just now. 3. Thus, each interestingness measure is treated as a class. 4. Train a multiclass classifier using the session logs 5. At every step, dynamic interest selection is treated as multiclass classification problem.
  • 28.
    End to endEDA Automation and Explanations Automatic Interactive Data Exploration Techniques EDA by capturing and predicting user’s interest End to end EDA Automation and explanations
  • 29.
    Fully Automated EDA FullyAutomated EDA: Given an input dataset, generate entire EDA session which captures dataset highlights and interesting aspects. Generated sessions should allow users to gain preliminary insights on their dataset. Reduced manual efforts and inputs.
  • 30.
    ATENA: Deep RLModel for Fully Auto EDA (El et al. 2020) Dataset EDA sessions for the full dataset Use deep reinforcement learning method to generate EDA sessions Main idea is to use interestingness measures as rewards.
  • 31.
    ATENA: State andAction Spaces, Rewards State Space: Display dt is encoded to a numeric vector, with the following features: Entropy, number of distinct values, and the number of null values for each attribute. For each attribute, whether it is currently grouped/aggregated. Number of groups and the groups’ size mean and variance. Display vectors of three most recent operations in the session. Action Space: FILTER(attr, op, term), GROUP(g_attr, agg_func, agg_attr), BACK()
  • 32.
    ATENA: State andAction Spaces, Rewards Rewards: Interestingness reward for group-by operations: promotes compact group-by results that covers many tuples as both informative and easy to understand. Interestingness reward for filter operations:favors filter operations whose result display dt deviates significantly from the previous display dt−1 Diversity: To encourage actions inducing new observations of different parts of the data than those examined thus far. Coherency: Sequence of operations is compelling and easy to follow
  • 33.
    Balancing Familiarity andCuriosity in Data Exploration with Deep Reinforcement Learning (Personnaz et al. 2021) Proposed Solution: Modeled as A3C DRL Agent Reward is defined as a function of familiarity and curiosity.
  • 34.
    Auto Explanation ofEDA Notebooks EDA notebooks created by data scientists are often referred back for performing similar analysis. However, most of these EDA notebooks are not well documented and explanation of each view is missing. For example, at each view, the algorithm can tell which of the element is most interesting.
  • 35.
    ExplainED: Explanations forEDA Notebooks Deutch et al. 2020. Challenges: 1. How to evaluate the interestingness of the view? Pick an interestingness measure from the list of possible measures that has the highest score for a given view 2. How to show the most interesting part of the view? Find the part of the tuple that contributes most to the interestingness score via Shapley values (similar idea as feature selection)
  • 36.
    Open Challenges 1. Canthe rewards be made generic for any usecase? Can they be extended to take care of operators specific to ML usecases (e.g. outliers, label noise etc) 2. How to make the auto-generated sessions personalized, reactive to users’ information needs? 3. How to build an effective, reproducible, experimental framework to evaluate the quality of auto-generated sessions?
  • 37.
    Summary Three main areas: AutomaticInteractive Data Exploration Techniques EDA by capturing and predicting user’s interest End to end Automated EDA and explanations Early work with deep learning systems and opportunity to expand with more operators and generalization across usecases
  • 38.
    Tutorial Outline • Part1: Importance of Data Centric AI • Part 2: Advances in exploratory data analysis • Part 3: Advances in data visualization techniques • Part 4: Scalable data centric AI • Open Discussion
  • 39.
    Part 3: VisualizationSystems and Pipelines
  • 40.
    Pipeline and Toolsfor Data Visualization (Heer, 2022) See also survey of (Qin et al., VLDB J., 2019) (dos Santos et al., Computers & Graphics, 2004)
  • 41.
    Main Challenges ofVisualization Systems ● Accuracy ○ Reduce the impact of dirty data and show the uncertainties ● Usability ○ Integrate Human in the Loop ○ Be understood, interpreted, and trusted by humans ○ Ease/self-adapt the design, tuning, and use ● Efficiency ○ Runtime ○ Incremental ○ Progressive Interactive Visualization Interactive Visualization
  • 42.
    Broad research areas ●Visualizations for data quality control ● Interactive visualization techniques ● Visualization recommendations techniques
  • 43.
    Visualizations for Data Quality Control Visualizationsfor Data Quality Control Interactive Visualization Visualization Recommendation
  • 44.
    Designing a VisualAnalysis Pipeline for DQ Control: Screening – Diagnosis – Correction Adapted from Van den Broeck et al., 2005 by Liu et al., 2018
  • 45.
    Visualization Tools forData Quality Control (Ward et al. 2008) proposed a methodology to measure and expose: data quality, abstraction quality, and visual quality. Among many DQ-ware visualisation tools: - DaVis (Sulo et al., 2005) - TimeCleanser (Gschwandtner et al., 2014) - VisPlause (Arbesser et al, 2017) (Kandel et al., 2011)
  • 46.
    Visplause for DQchecks Arbesser et al, IEEE Trans. VCG 2017 https://www.youtube.com/watch?v=5stVUf5CC3E
  • 47.
    TimeCleanser for Time-orienteddata cleansing Gschwandtner et al., 2014 Time-oriented data quality checks with a set of corresponding visual artifacts
  • 48.
    Open areas/questions ● Aswe move towards more of AI usecases, there is a need for visualization systems to focus on data quality for ML issues along with existing checks.
  • 49.
    Interactive Visualization Visualizations for DataQuality Control Interactive Visualization Visualization Recommendation
  • 50.
    Interactive Visualization Shenet al., IEEE TVCG 2022 Visualization-oriented Natural Language Interfaces (V-NLI) ● NL2VIS systems take NL queries as inputs and provide visualizations as output. ● Fundamental challenges: ○ Query intent understanding ○ Data transformation ○ Visual Mapping ○ View transformations ○ Human in loop interactions ○ Dialogue management
  • 51.
    ncNet Luo etal, IEEE VCG 2021 ncNet: Natural Language to Visualization by Neural Machine Translation
  • 52.
    Data-Debugging Through InteractiveVisual Explanations (Afzal et al, 2021) ● Data readiness as an important module for ML pipelines ● Certain remediations to the data (example change of bad labels caused due to labeling mistakes) needs SME input and review
  • 53.
  • 54.
    Global View andLocal View Global view Local view
  • 55.
    Open areas andquestions ● As we move towards more of AI usecases, there is a need for visualization systems to focus on data quality for ML issues along with existing checks. ● V-NLI interfaces today support queries closer to usecases to derive analytical insights. Can it support queries for AI usecases (example find all label noise data points in the data)
  • 56.
    Visualization Recommendation Visualizations for DataQuality Control Interactive Visualization Visualization Recommendation
  • 57.
    Importance of VisualizationRecommendations ● Manual Visualization ○ Trial and error based model ○ Visual Encoding: Identify appropriate type of visualization (charts, transformations) ○ Implementation: Code the visualization ● Automated Visualization Recommendations: automatically recommend (type of graph, field to be encoded) for a given dataset ○ learn the visualization rules from data, experience , or user history ○ Incorporates data, visualization design context, user behavior etc.
  • 58.
    Types of VisualizationRecommendations Qin et al., VLDB J., 2019
  • 59.
    Voyager (Rule Based)Wongsuphasawat et.al, TVCG 2016 ● Architecture ● An Example
  • 60.
    DeepEye (Hybrid) Luoet al, IEEE ICDE 2018 ● DeepEye, an automatic data visualization system that tackle ○ Visual Recognition: given a visualization, is it “good” or “bad”? ○ Visualization Ranking: given two visualizations, which one is “better”? ○ Visualization Selection: given a dataset, how to find top-k visualizations?
  • 61.
    VizML (ML based)Hu et al, ACM CHI 2019 ● A Machine Learning Approach to Visualization Recommendation
  • 62.
    Concluding Remarks ● Visualanalytics offers efficient tools to help and engage the users in data quality analysis and improvement ● Human in the loop still comes with multiple usability challenges ● The 4 Vs of Big Data ● There are many opportunities for: ○ Managing and orchestrating human/machine resources ○ Recommending features & impactful and accurate visualizations ○ Revisiting our frameworks and technologies to integrate adaptive visual and interactive layers to ML black-boxes 62
  • 63.
    Tutorial Outline • Part1: Importance of Data Centric AI • Part 2: Advances in exploratory data analysis • Part 3: Advances in data visualization techniques • Part 4: Scalable data centric AI • Open Discussion
  • 64.
    Data Centric AIfor real workloads
  • 65.
    Enterprise ML systems Chall Hiddentechnical debt in machine learning systems (Sculley, NeurIPS 2015)
  • 66.
    Industry Challenges ● Growingdata sizes: terabytes and petabytes of data ● How to conduct data quality checks? ● How to explore and visualize data efficiently? ● Compute considerations (also related to sustainability) ● Data is stored in different databases/sources ● connectivity to different sources, different schemas, ..
  • 67.
    Automating data qualityfor ML at scale ● Schelter, 2018, Schelter, 2019 describe a system that is built on Spark and can perform unit tests on data, built and deployed at Amazon ● Swami, ICDE 2020 describe a system “Data Sentinel” which is a declarative production-scale data validation platform, built and deployed at LinkedIn. ● Breck, SysML 2019 describe a data validation for ML system that is designed to detect anomalies specifically in data fed to ML pipelines. This is part of TFX, a ML platform at Google.
  • 68.
    Automating Large ScaleData Quality Verification (Schelter, 2018, Schelter, 2019) Deequ : Open Source Library https://github.com/awslabs/deequ
  • 69.
  • 70.
    Data Quality Checkingfor Machine Learning with MeSQuaL (Comignani, EDBT 2020)
  • 71.
    RASL: Relational Algebrain Scikit-Learn Pipelines(Sahni et al, 2021) ● One common practice is to use Spark for data preprocessing, using aggregation to reduce its size, followed by scikit-learn for machine learning in a separate pipeline. ● This paper suggests adding relational algebra operators (e.g. join, aggregates) to Scikit-learn, such that these operators have the same scikit learn syntax and semantics Visualization of the data preparation part Using RASL Open Source : https://github.com/ibm/lale
  • 72.
    Conclusions ● Scalability tolarge datasets is critical for enterprise workloads ● Some systems have been proposed that take advantage of architectures like Spark to process large datasets ● Open areas on how to make these systems scalable for any data centric AI operations like detection of label noise
  • 73.
    In this tutorial,we have covered: • Part 1: Importance of Data Centric AI • Part 2: Advances in exploratory data analysis • Part 3: Advances in data visualization techniques • Part 4: Scalable data centric AI • Open Discussion
  • 74.
    Thank you foryour time and attention!