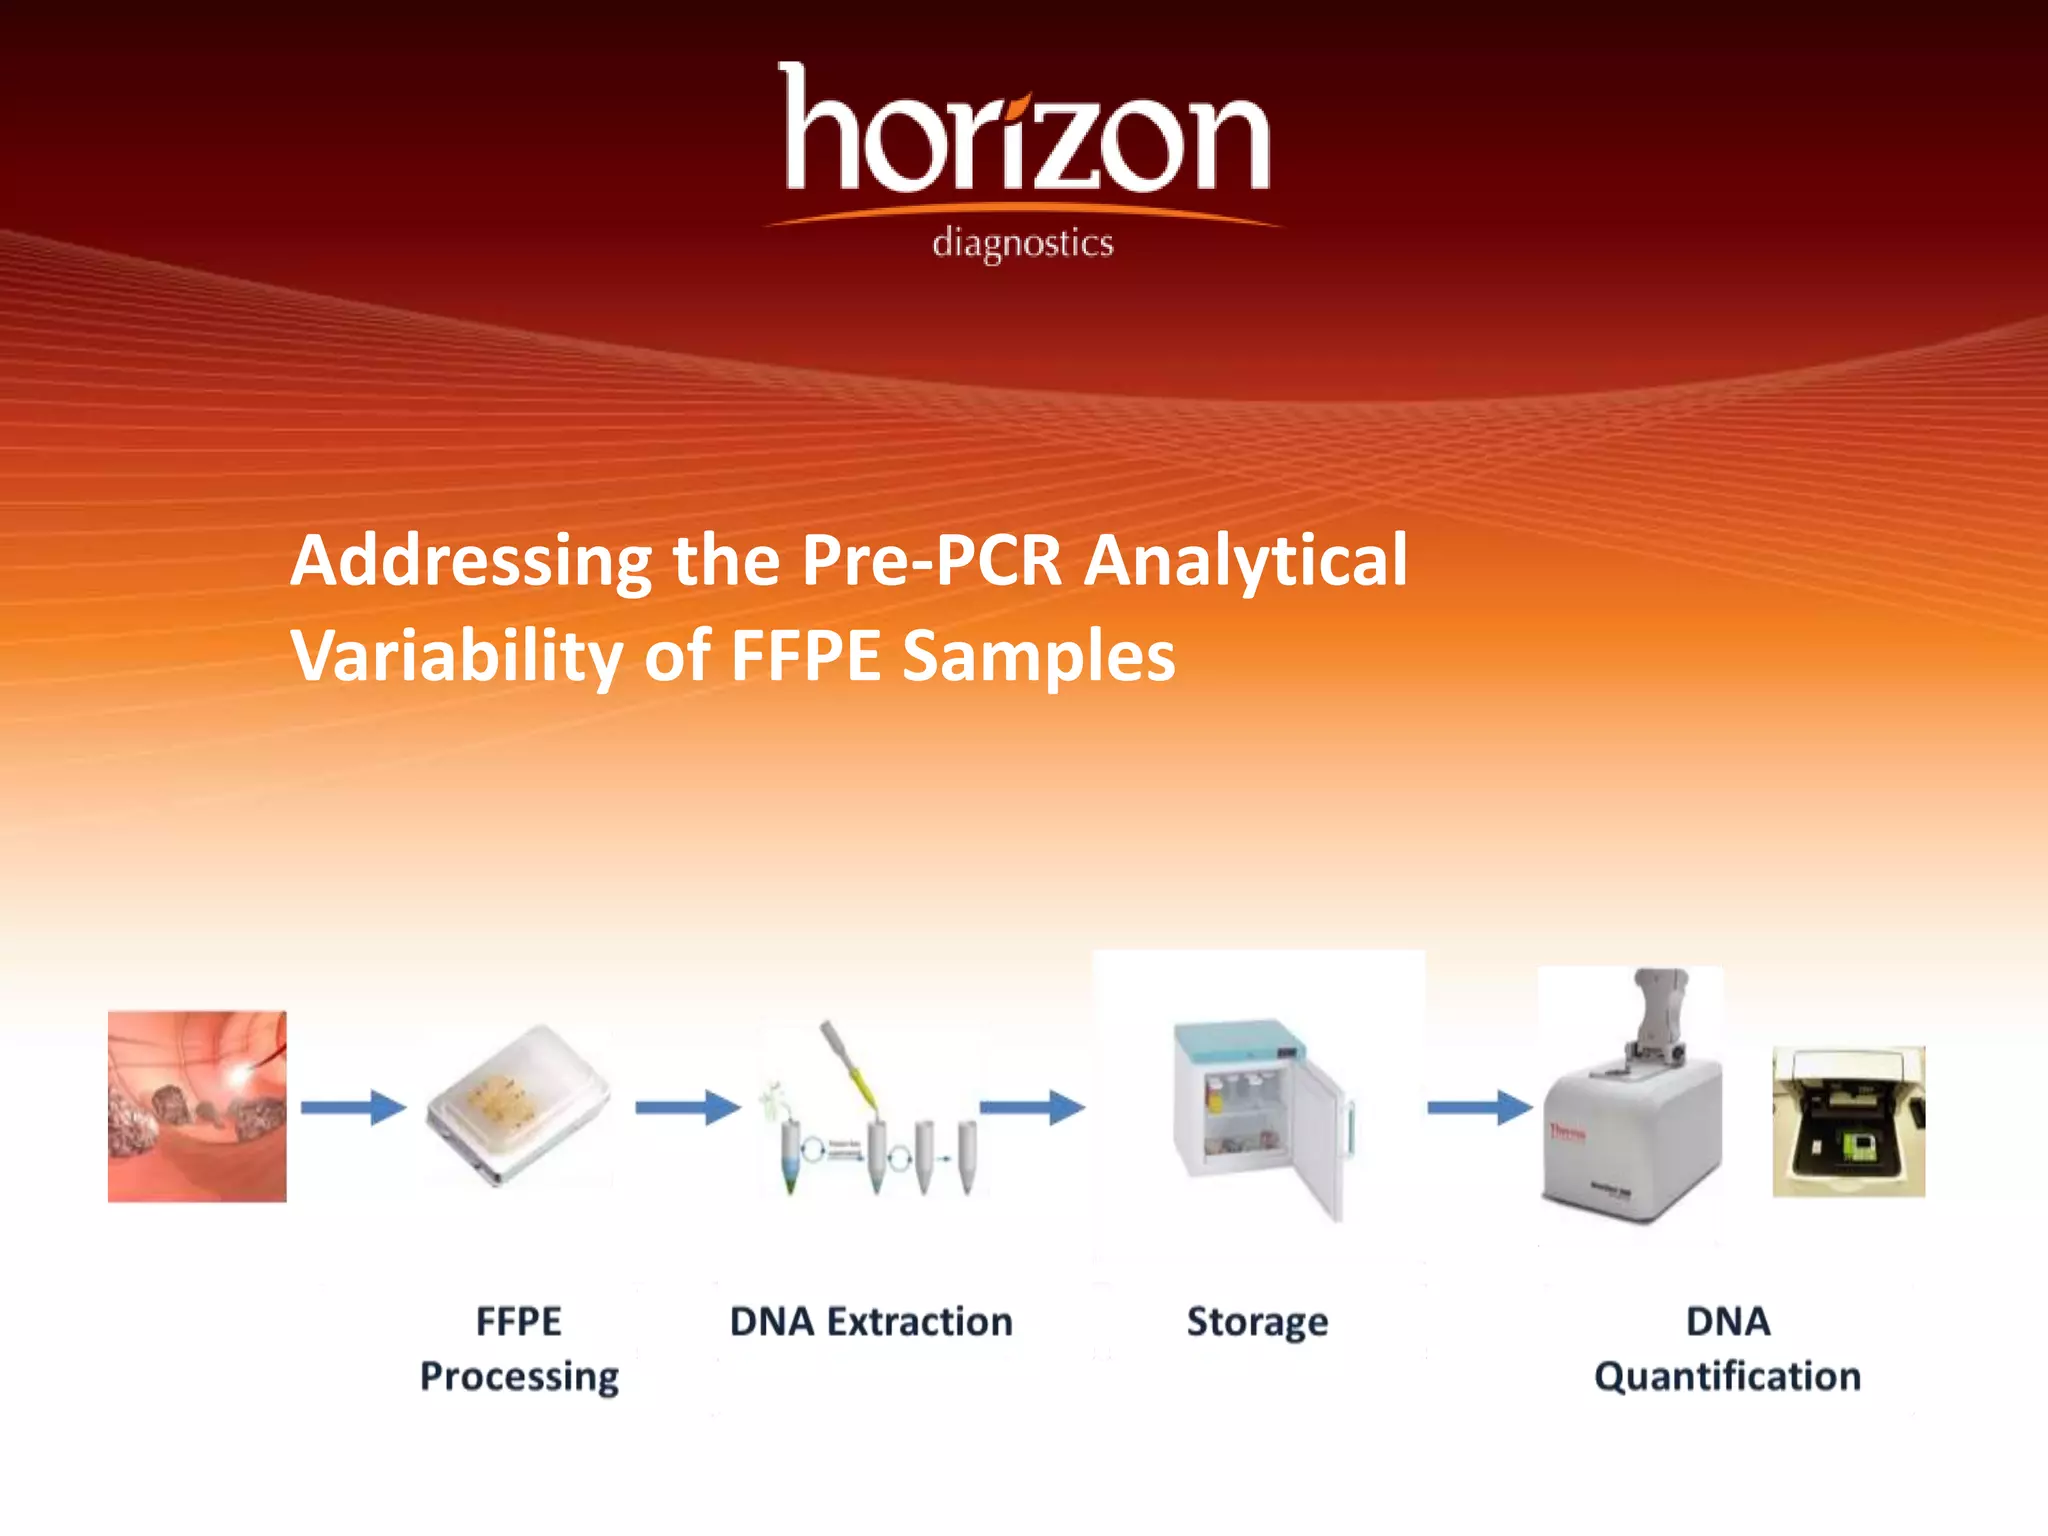
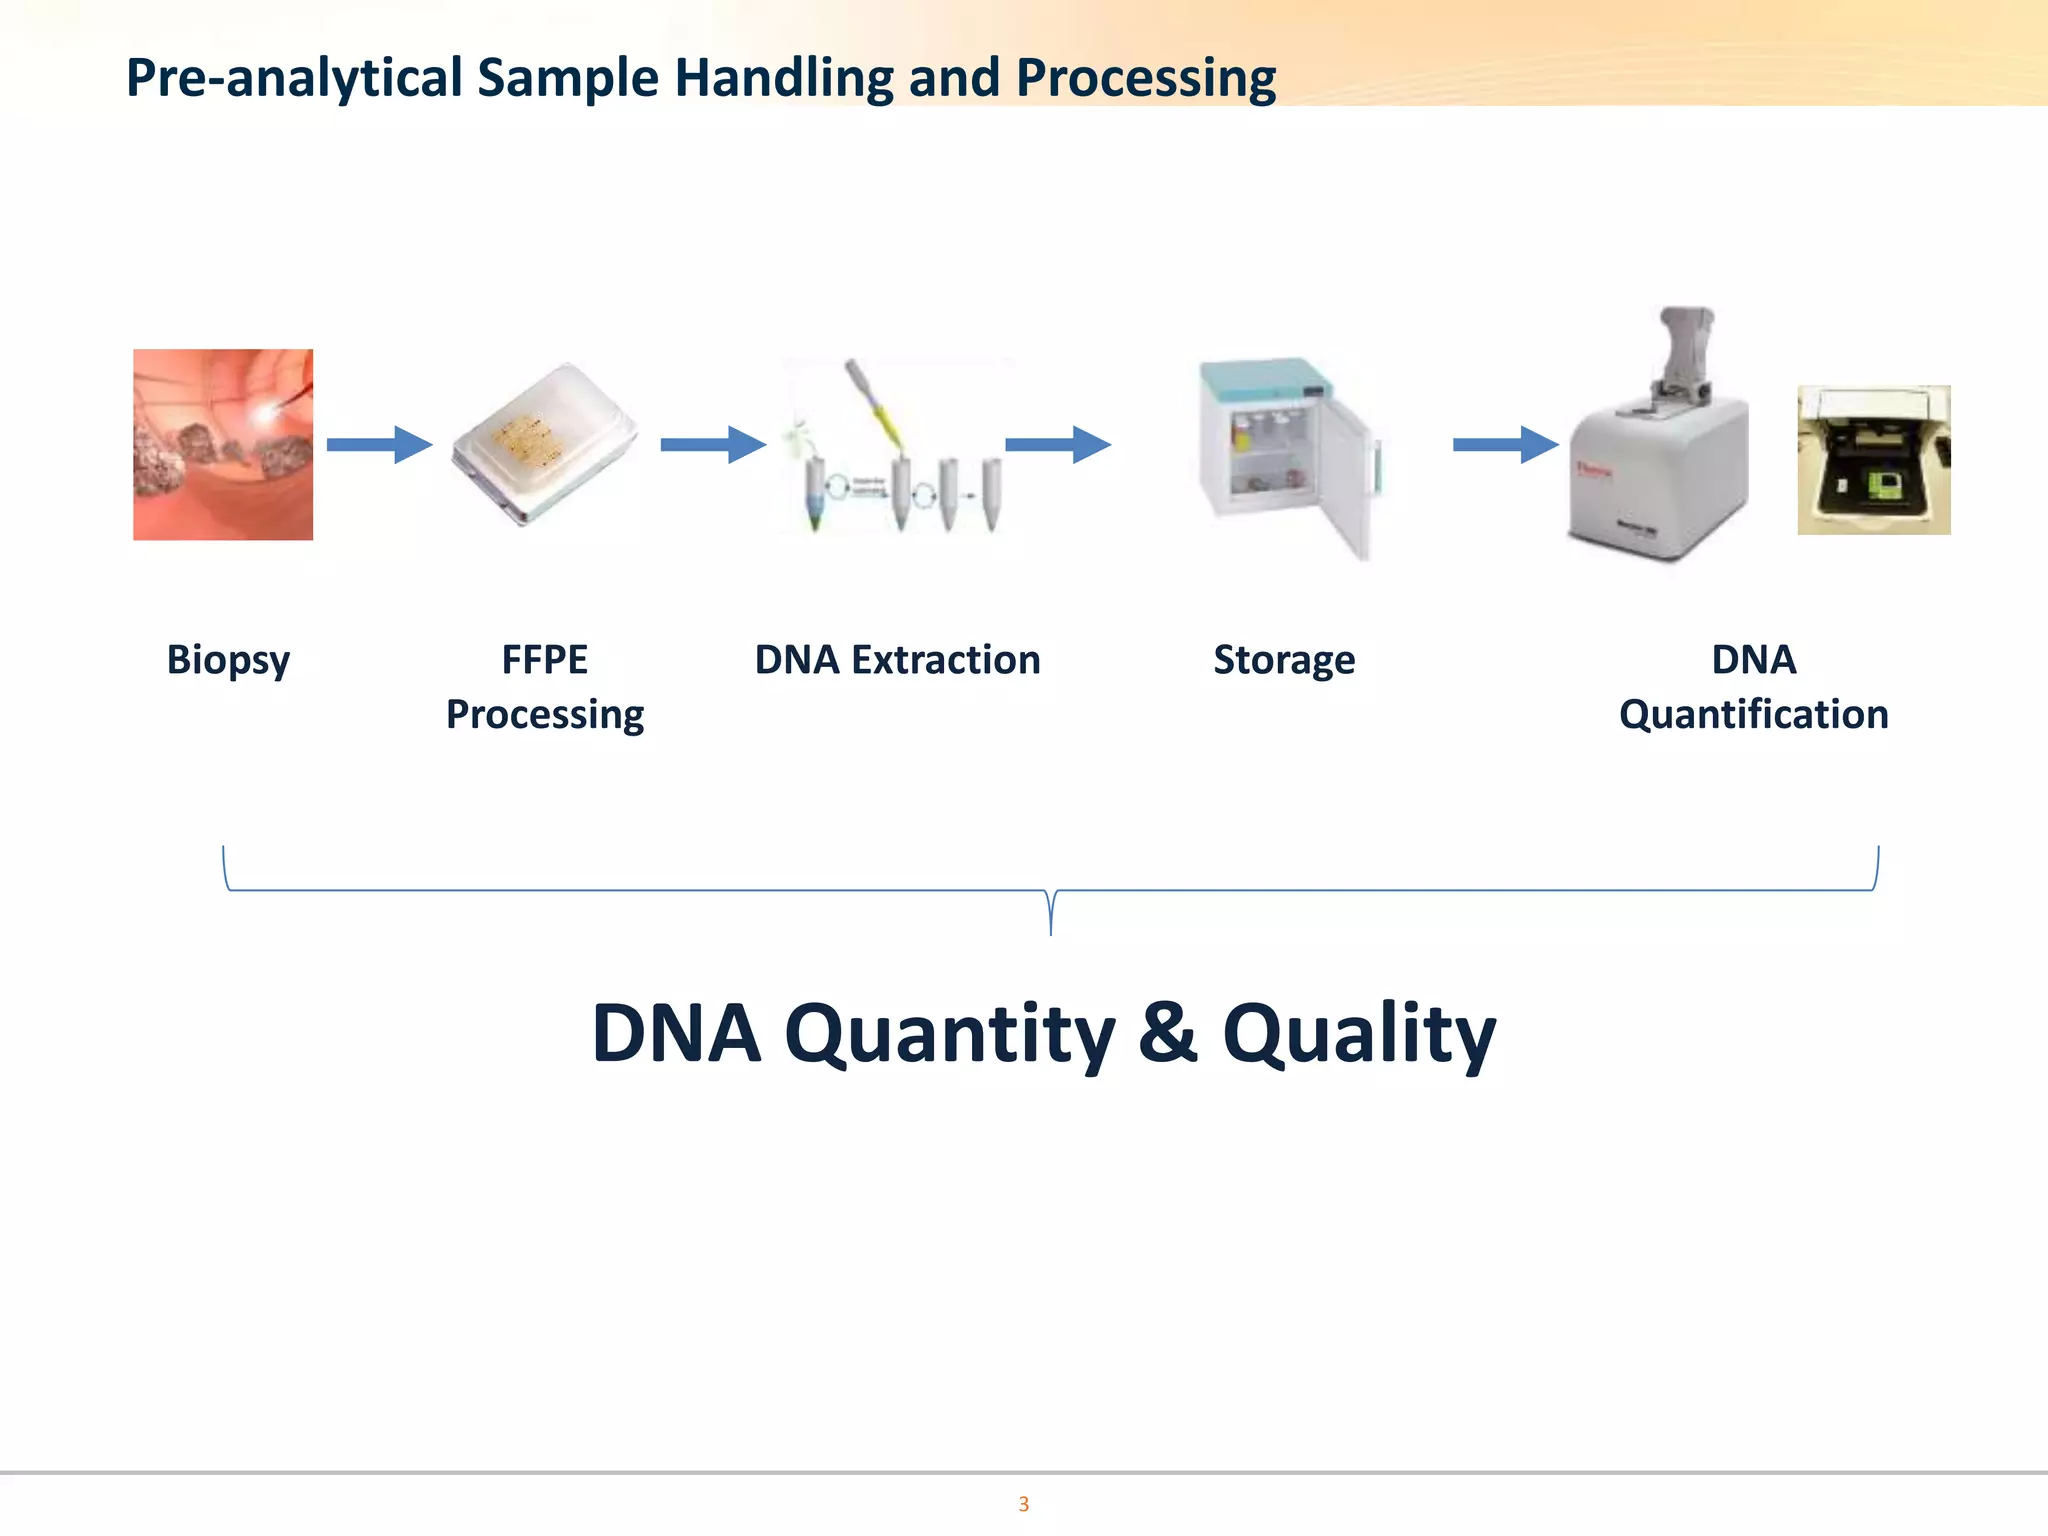
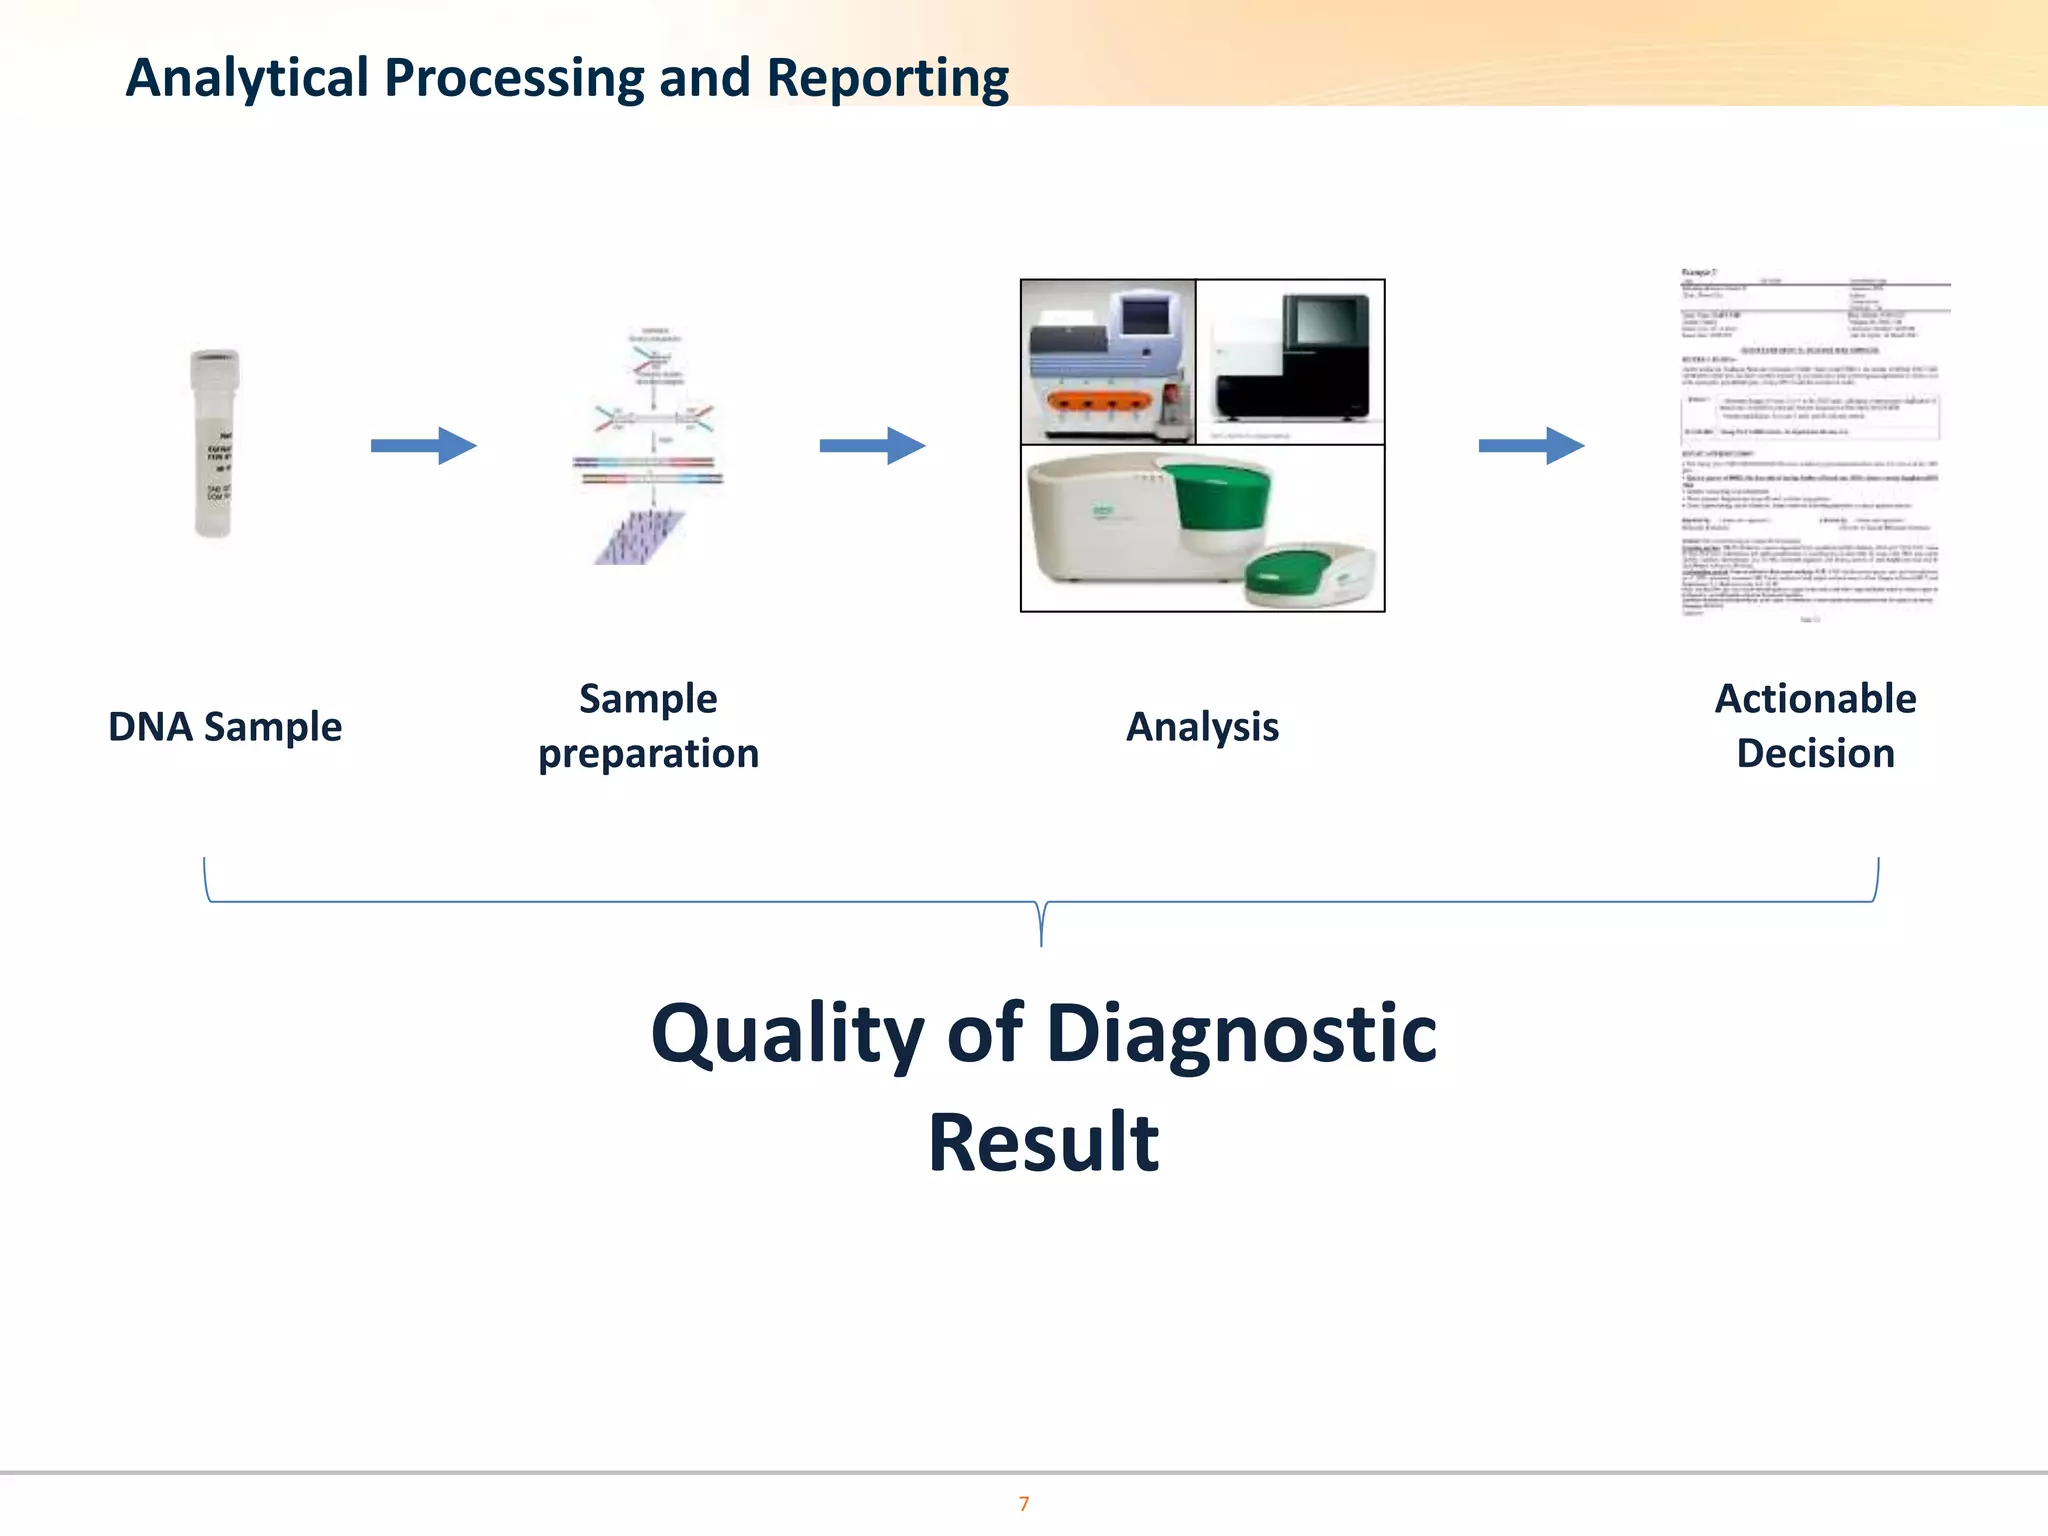
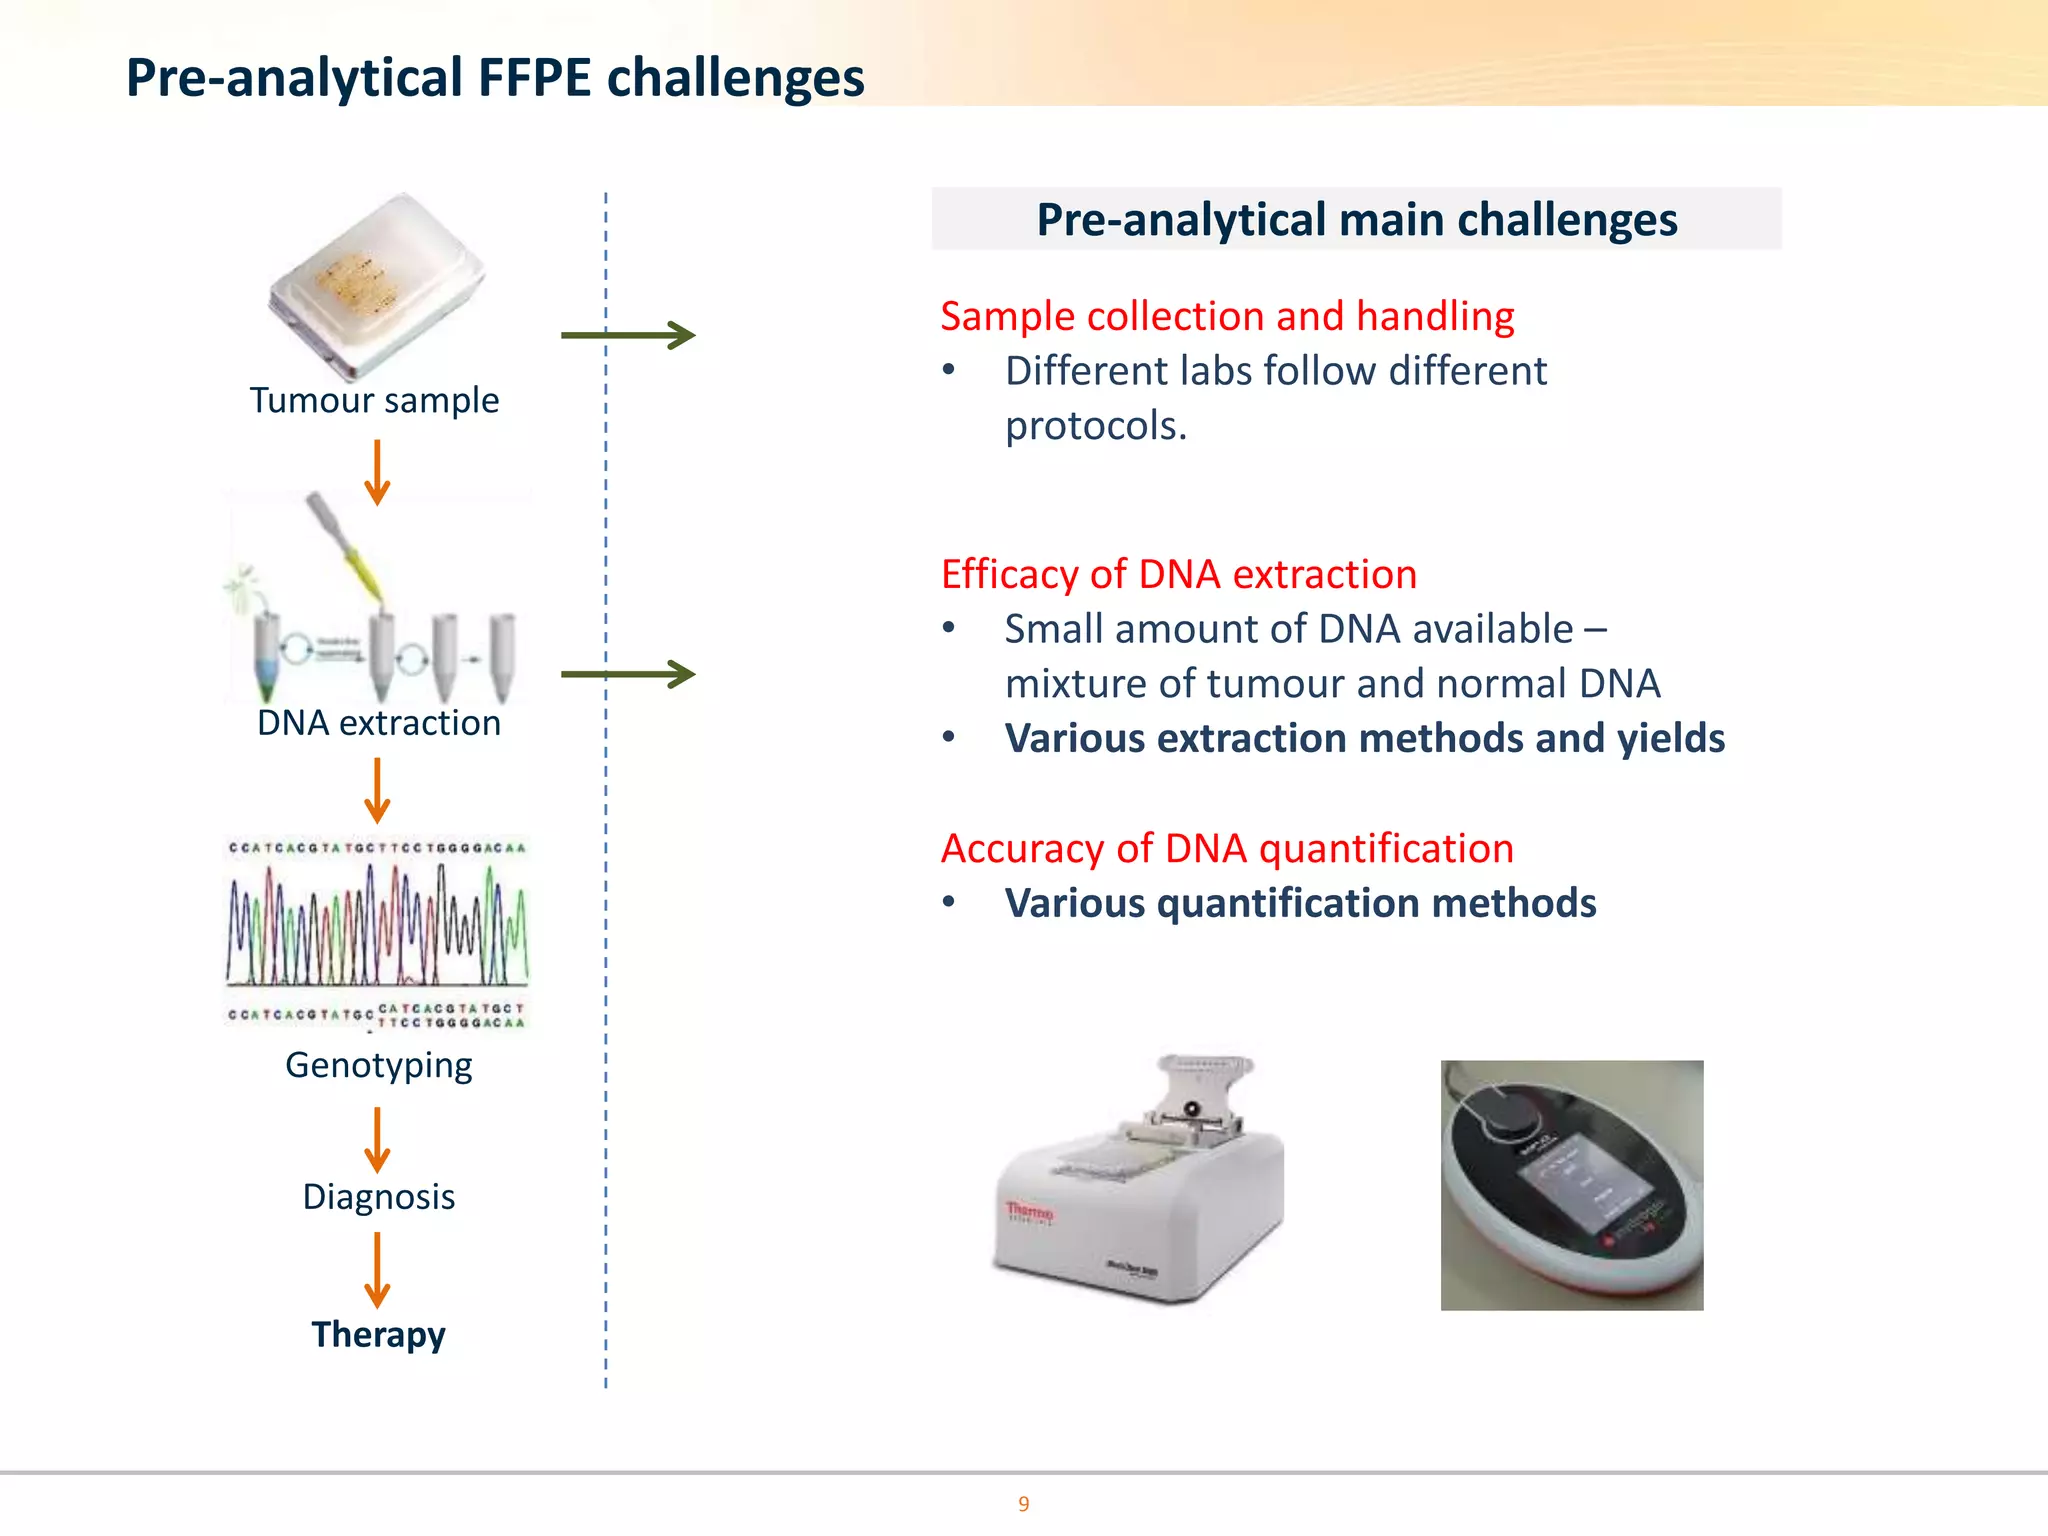
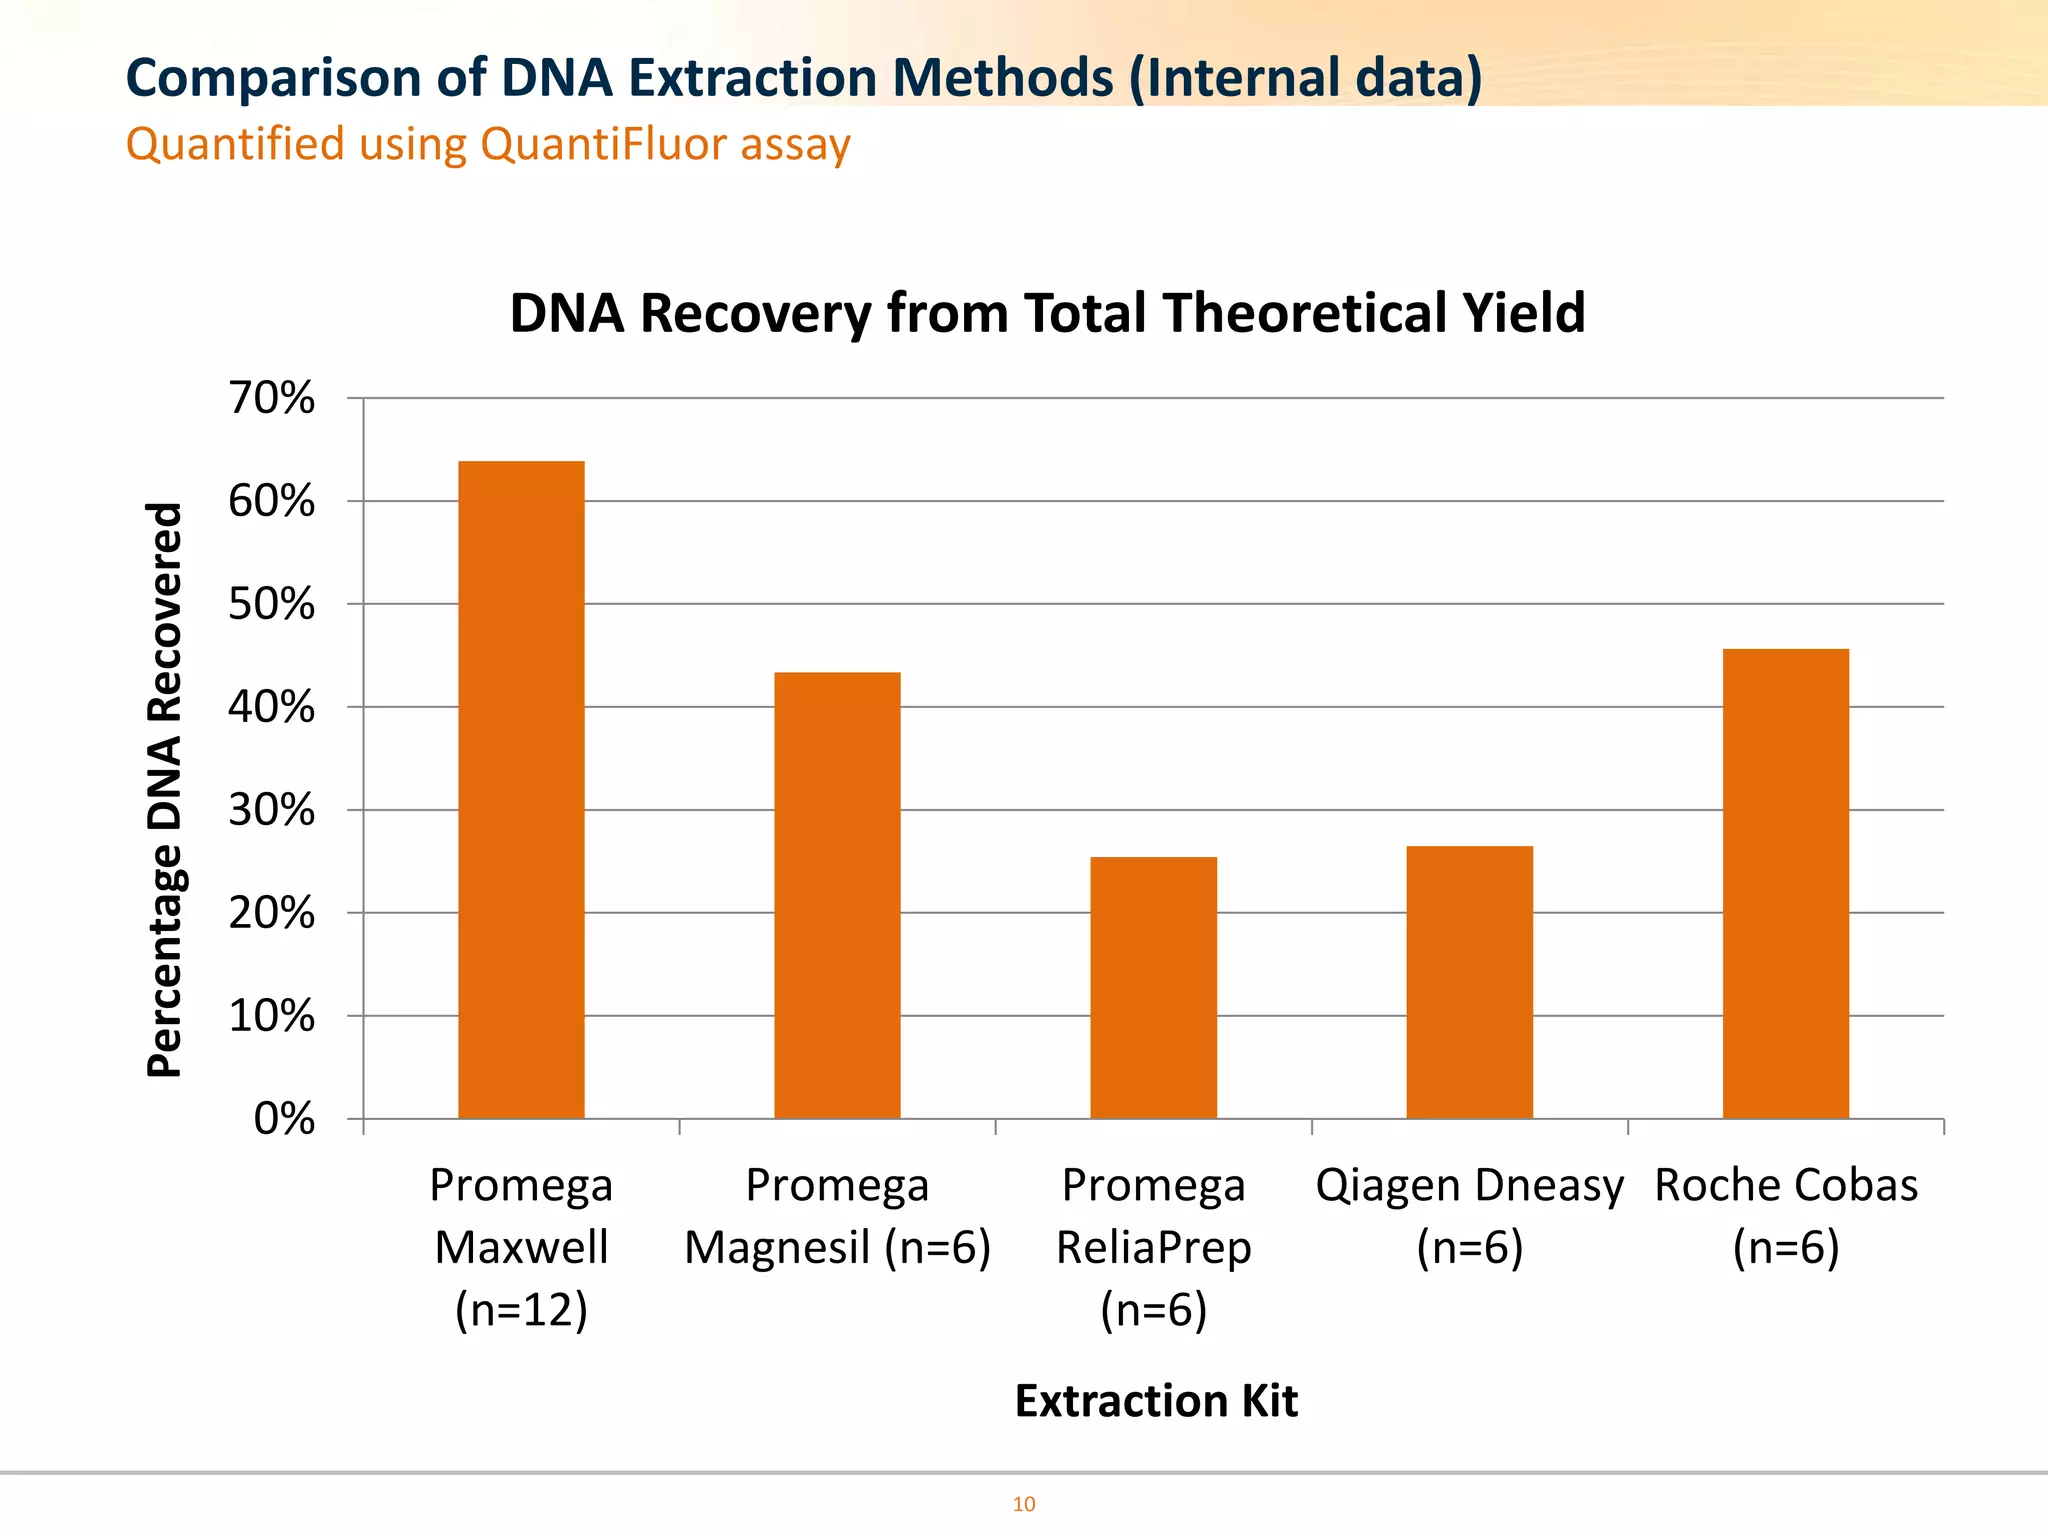
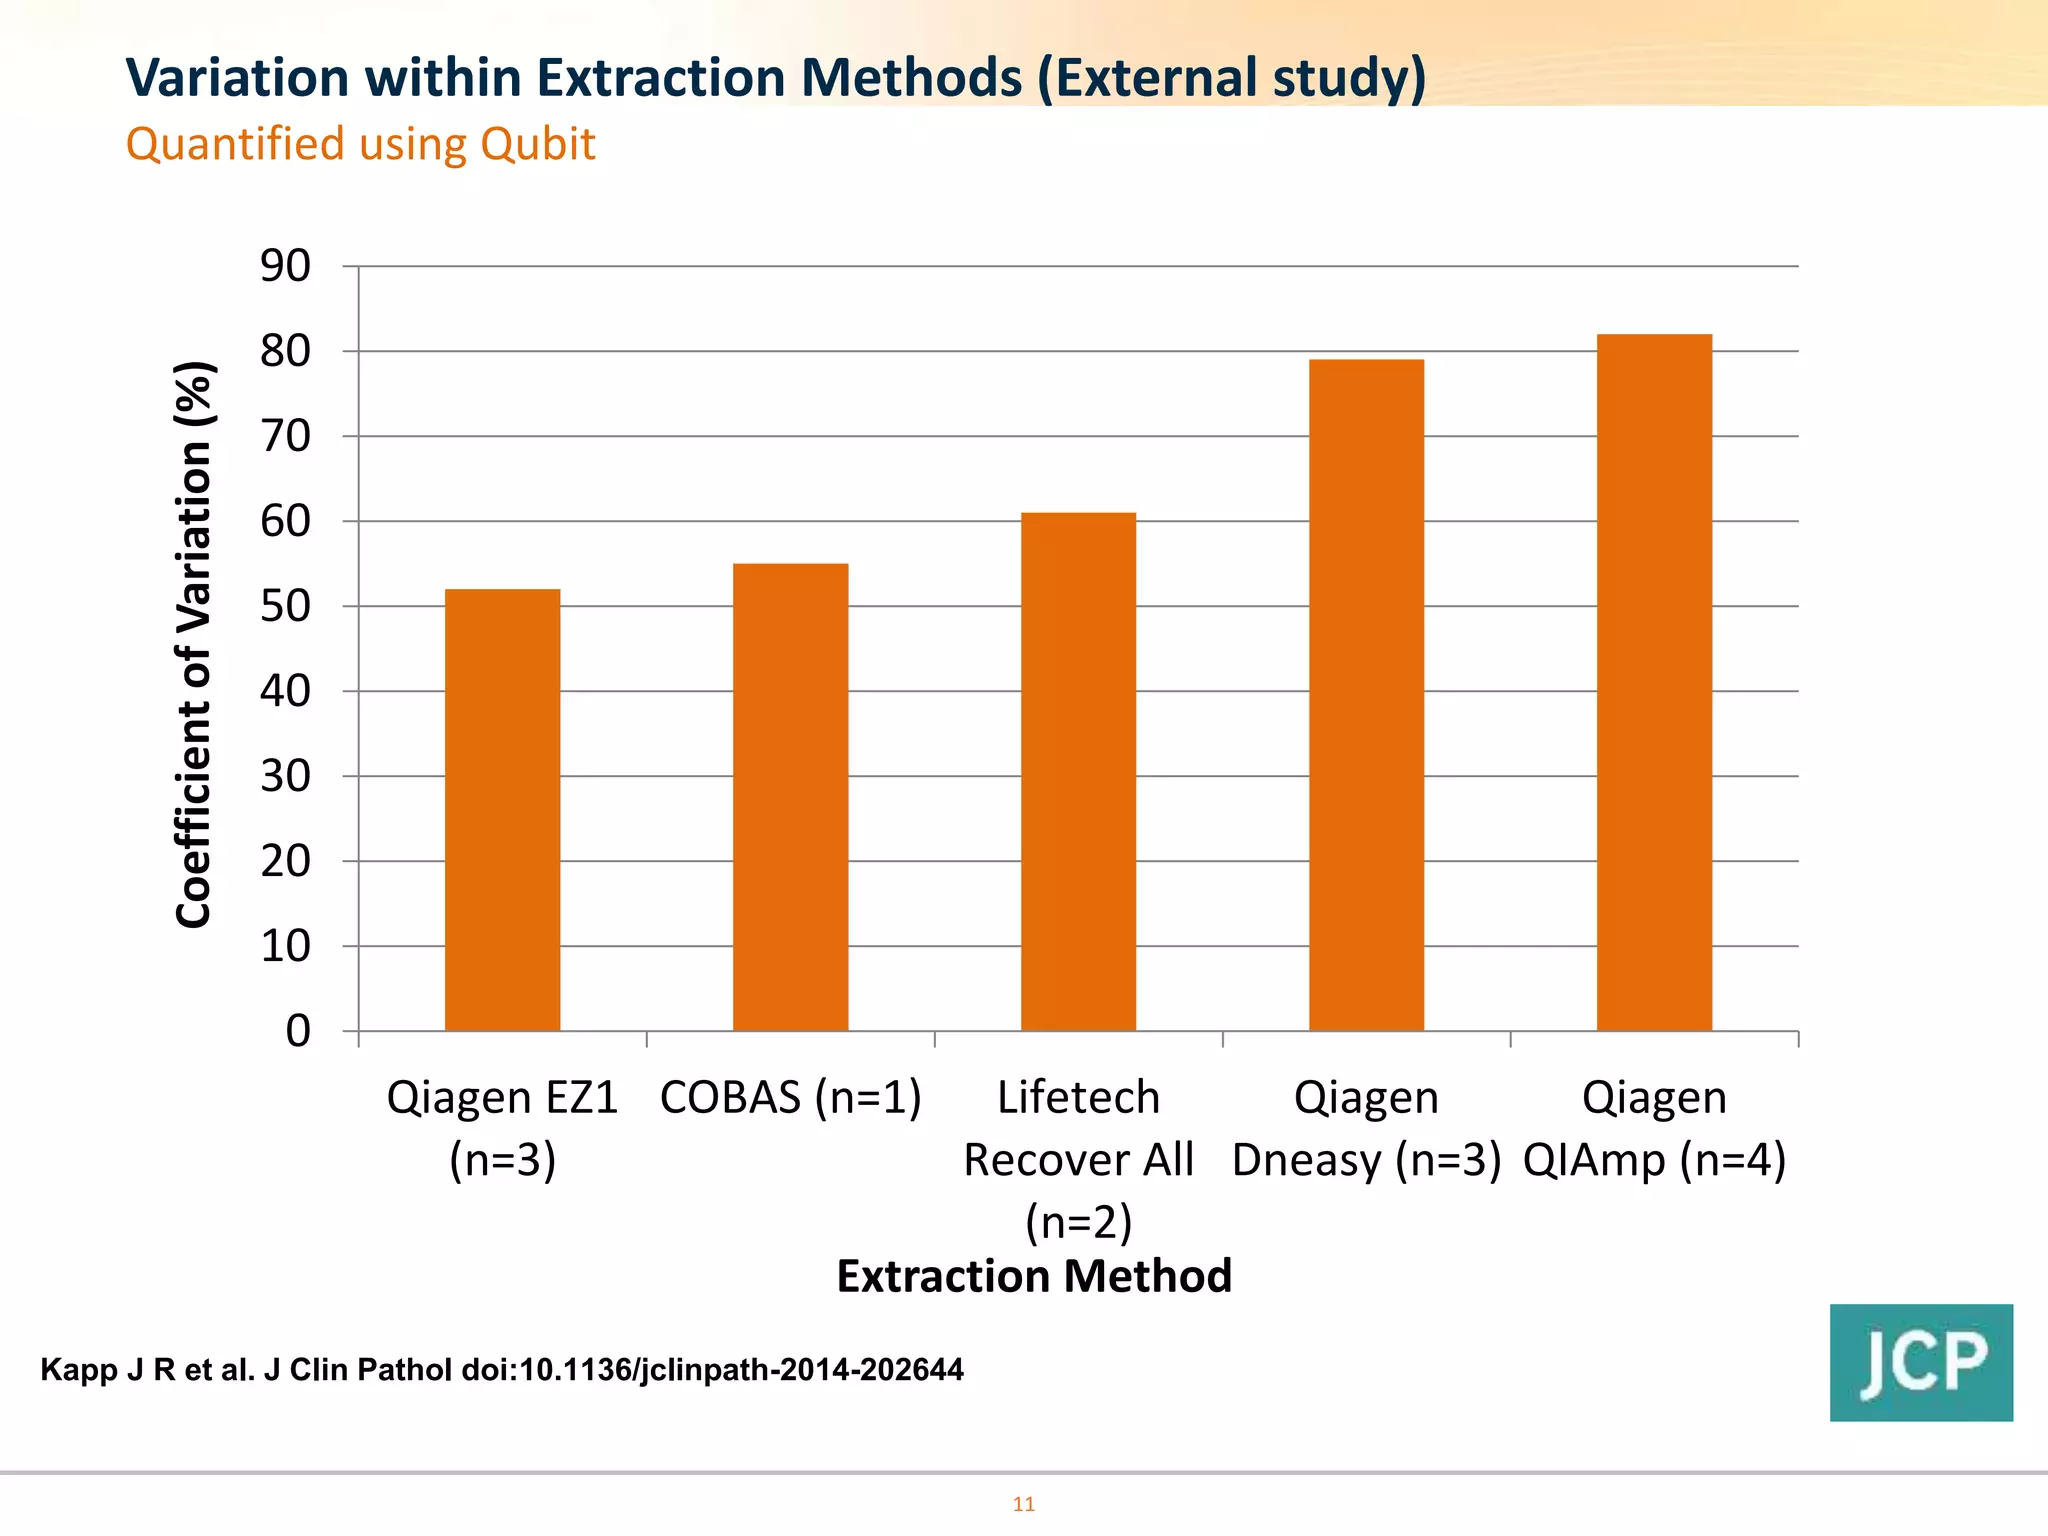
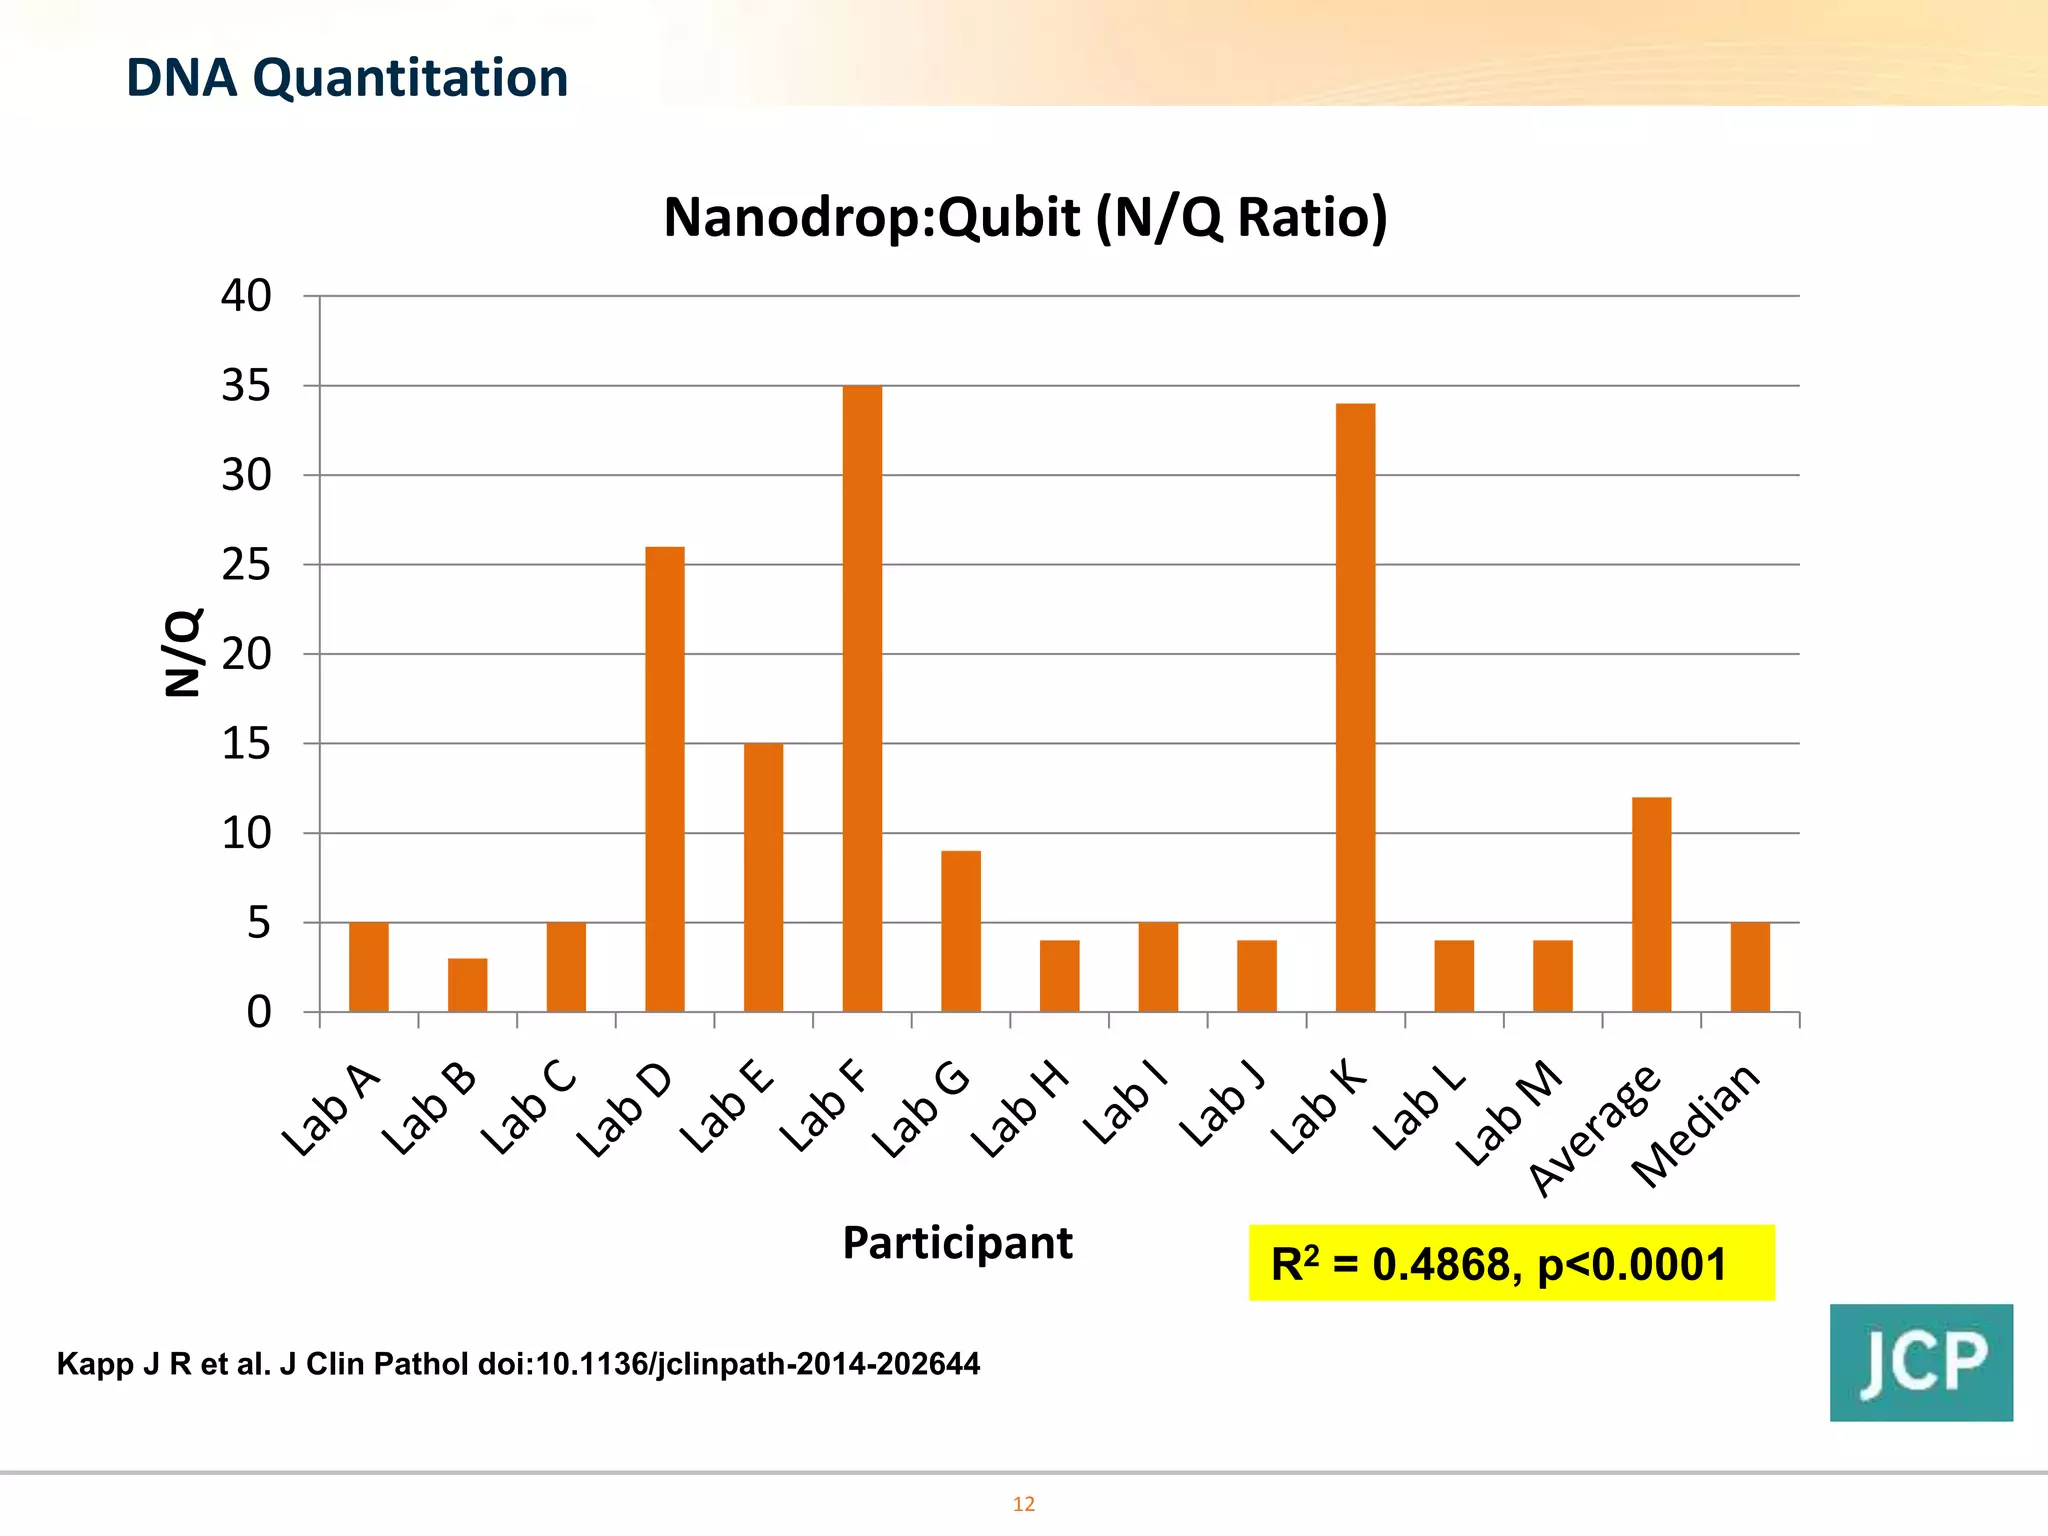
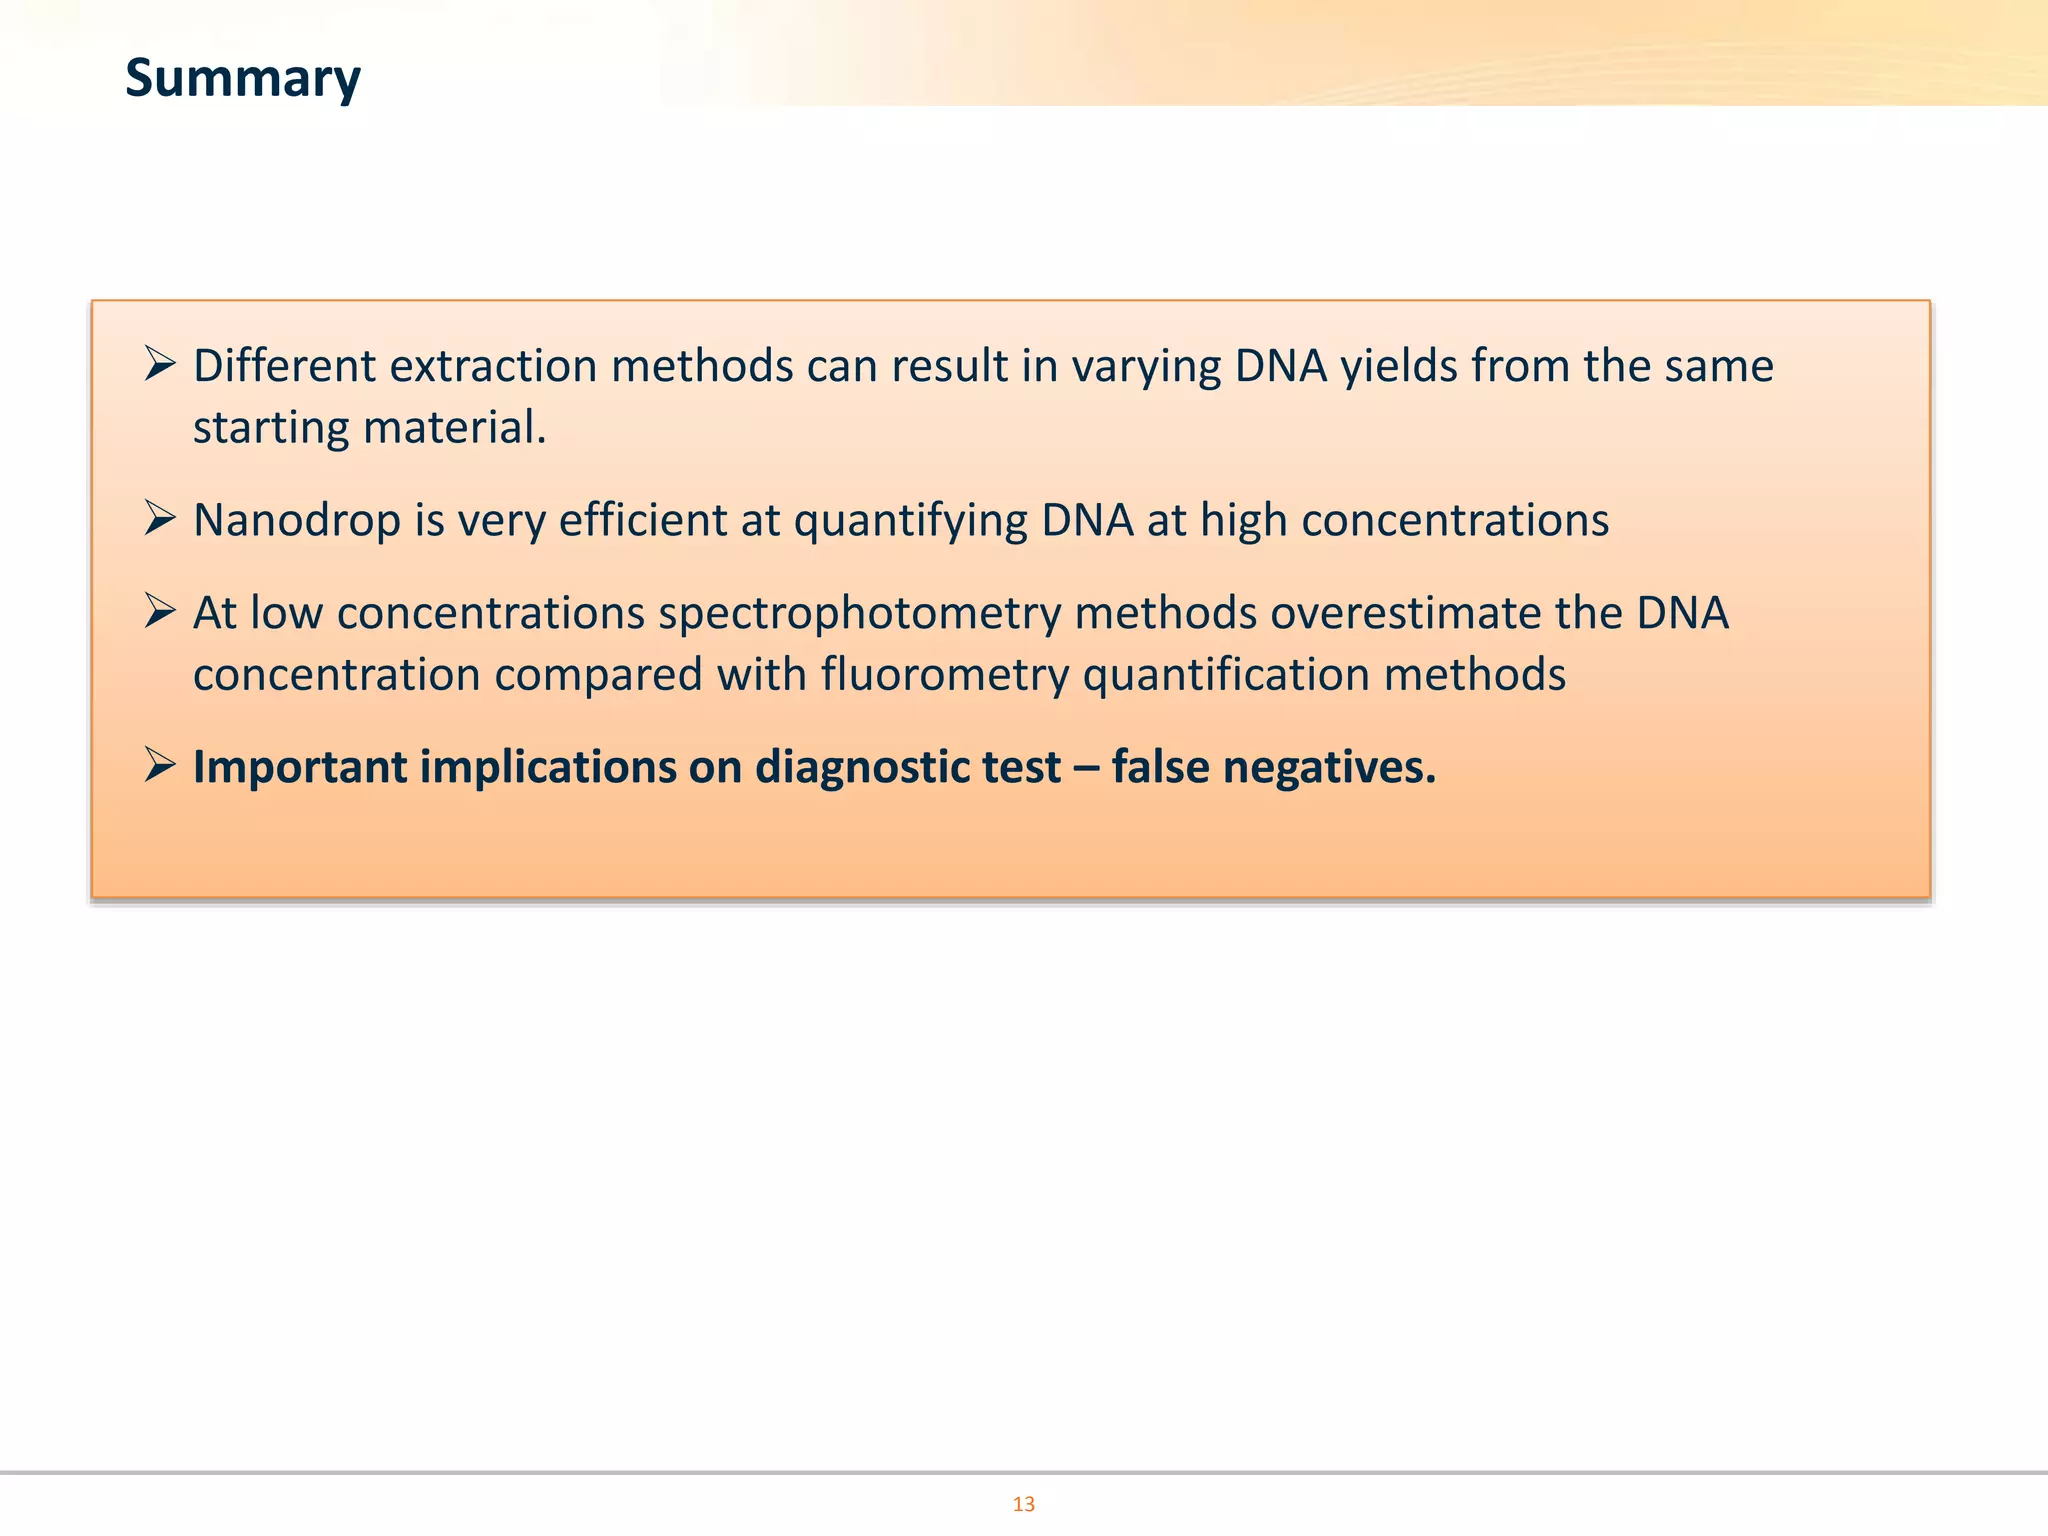
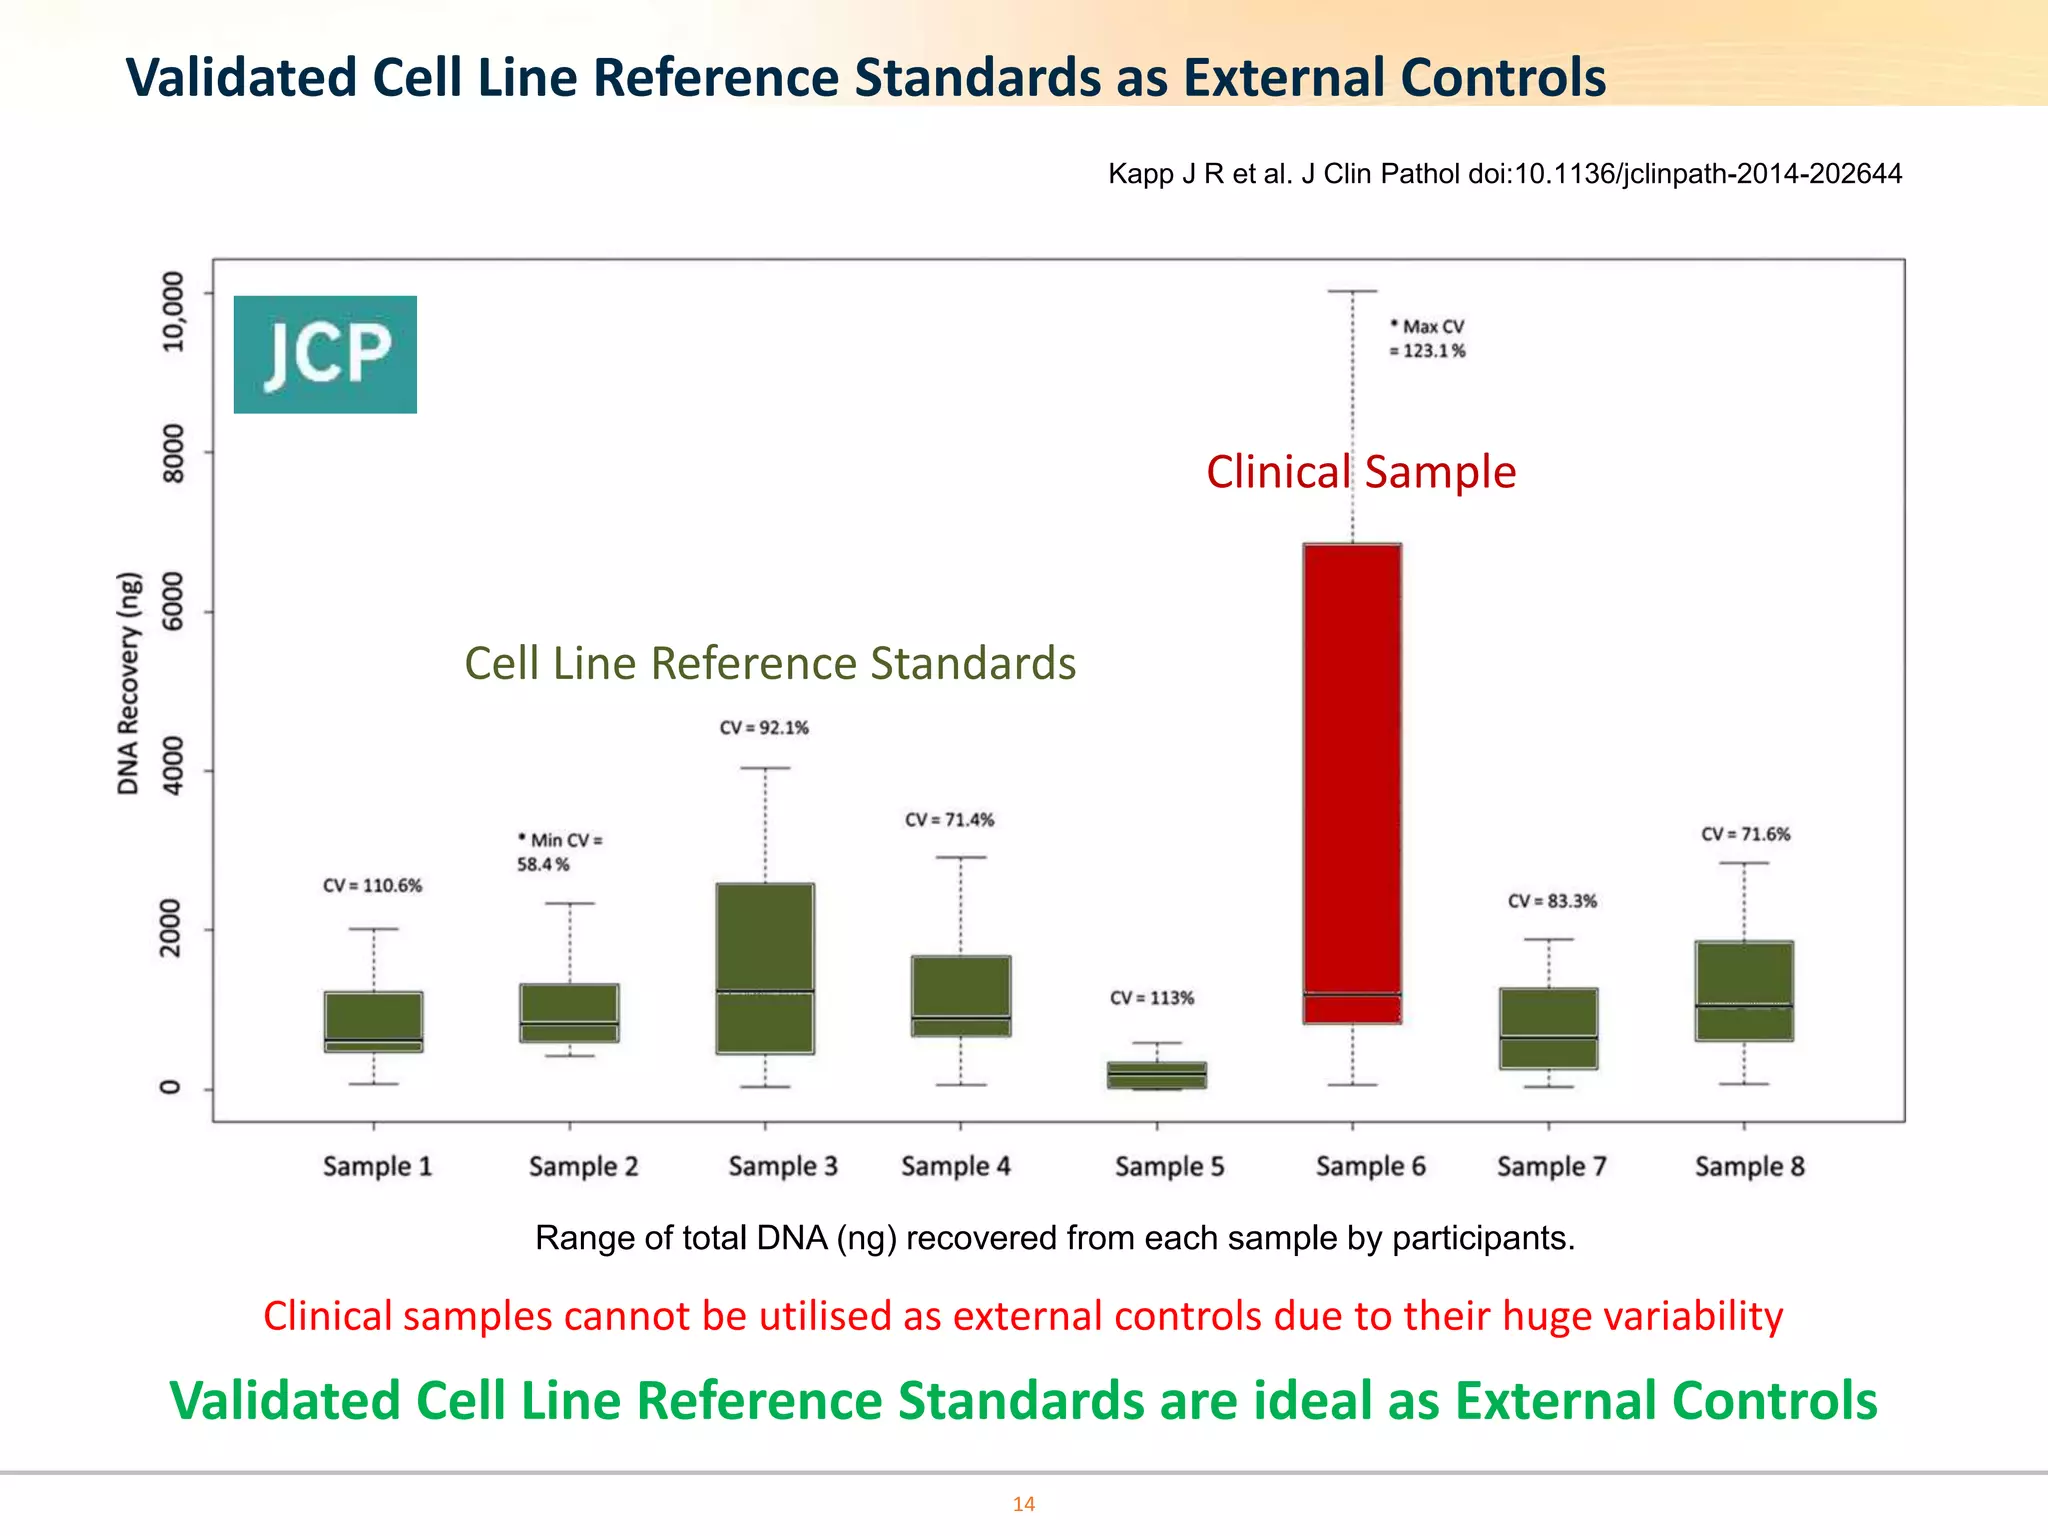
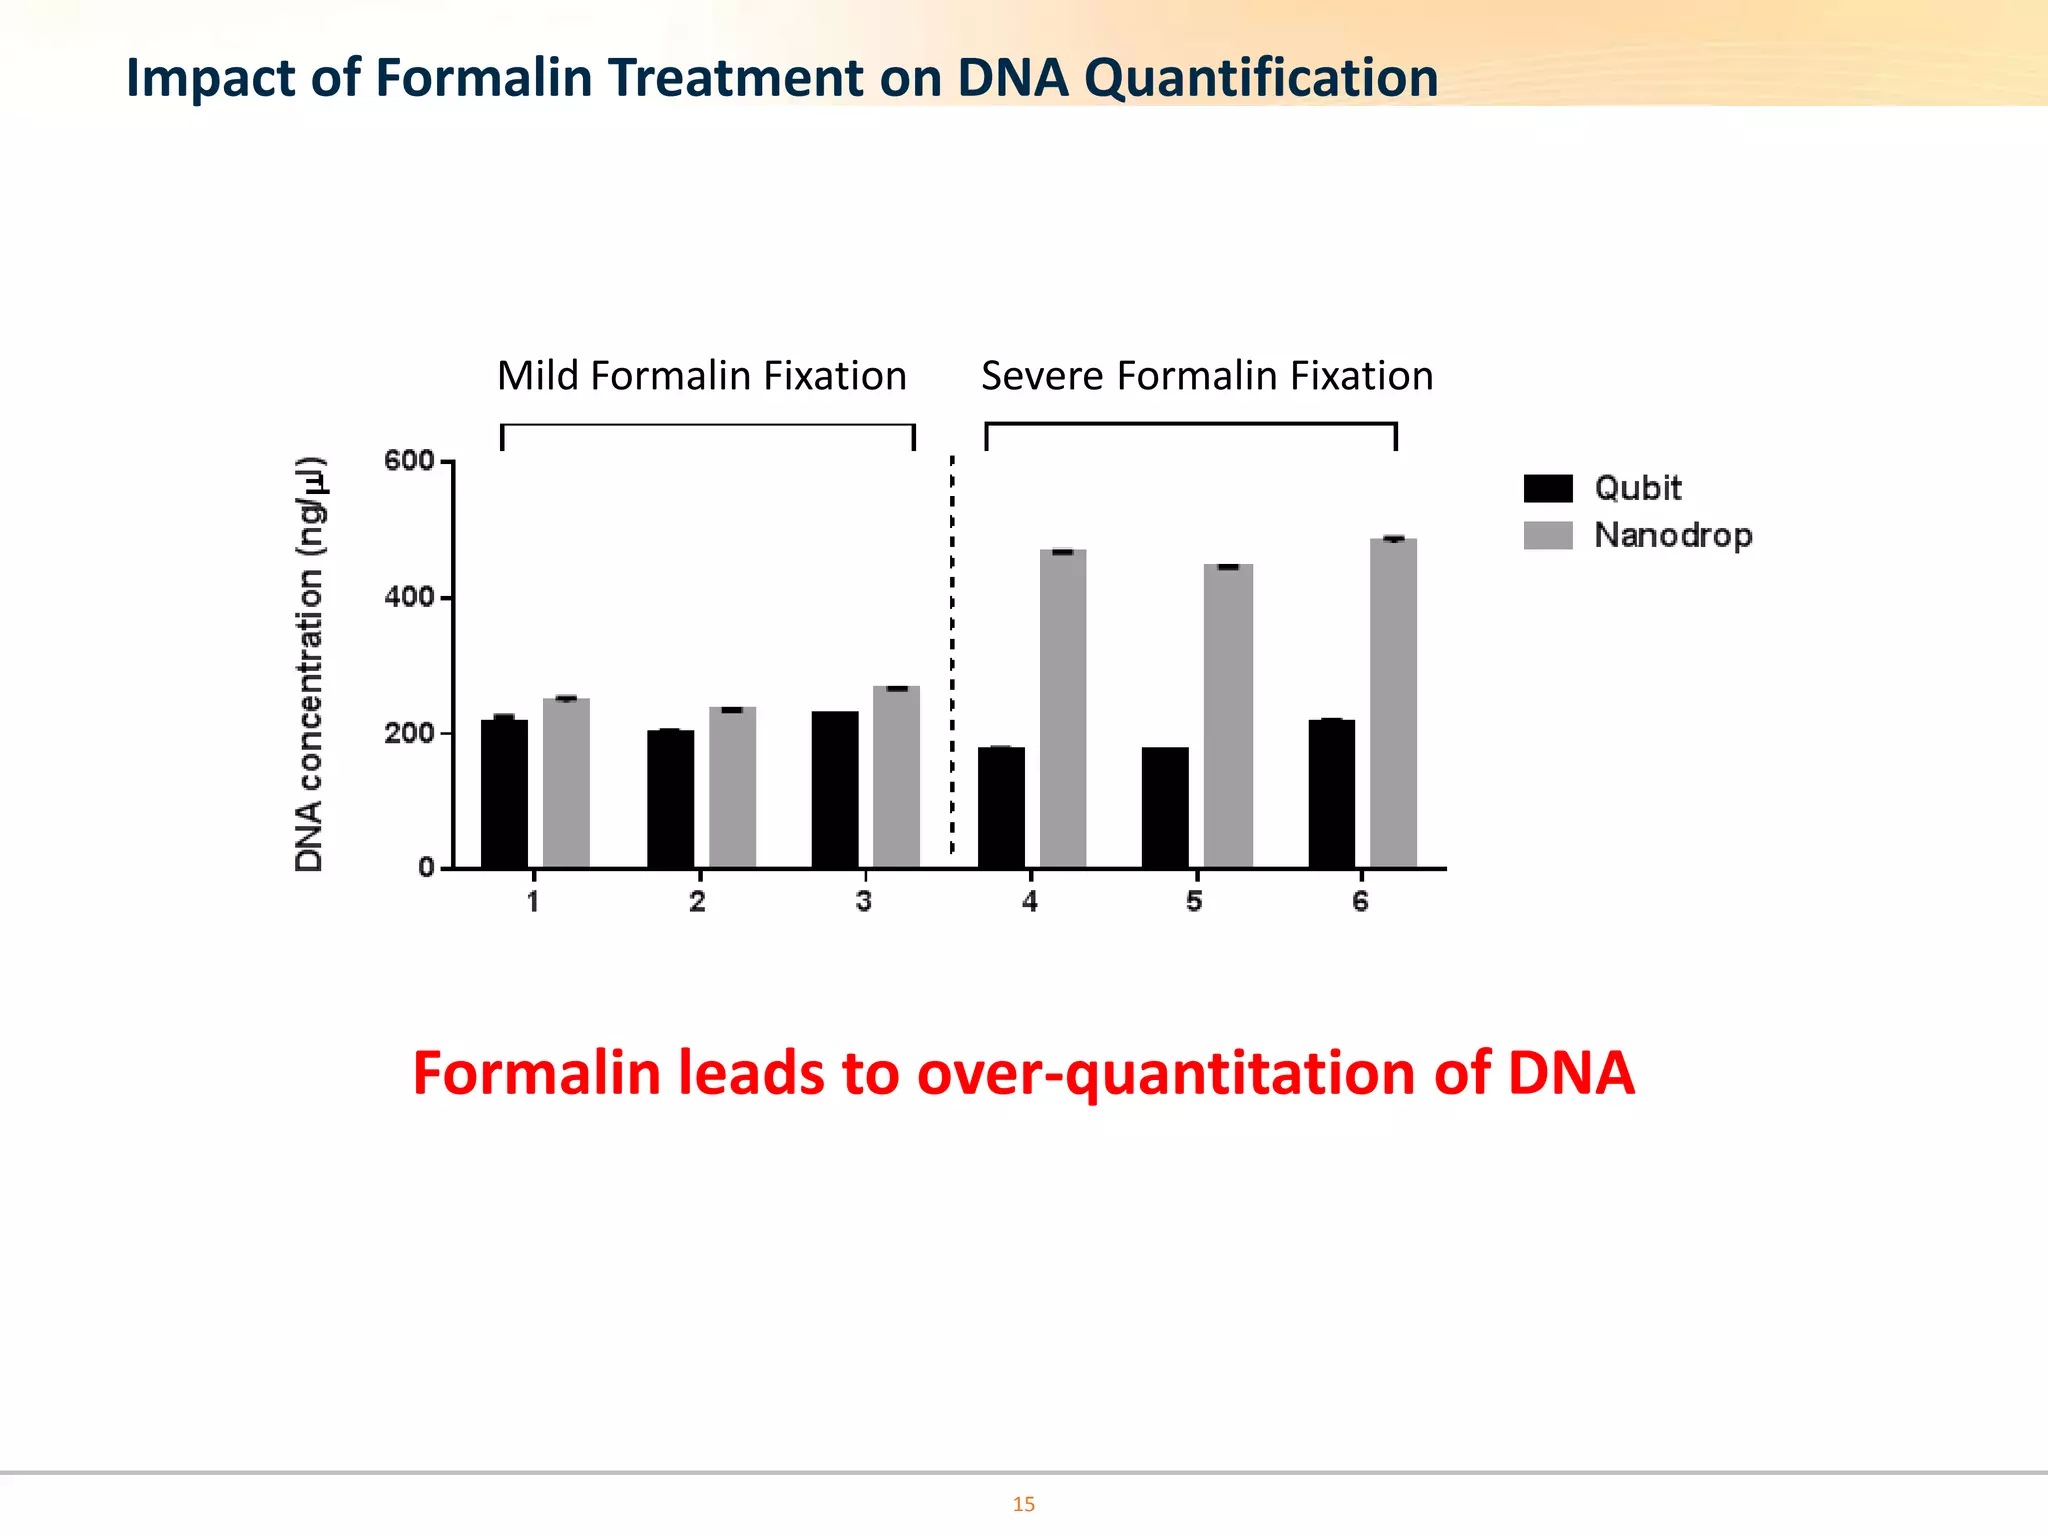
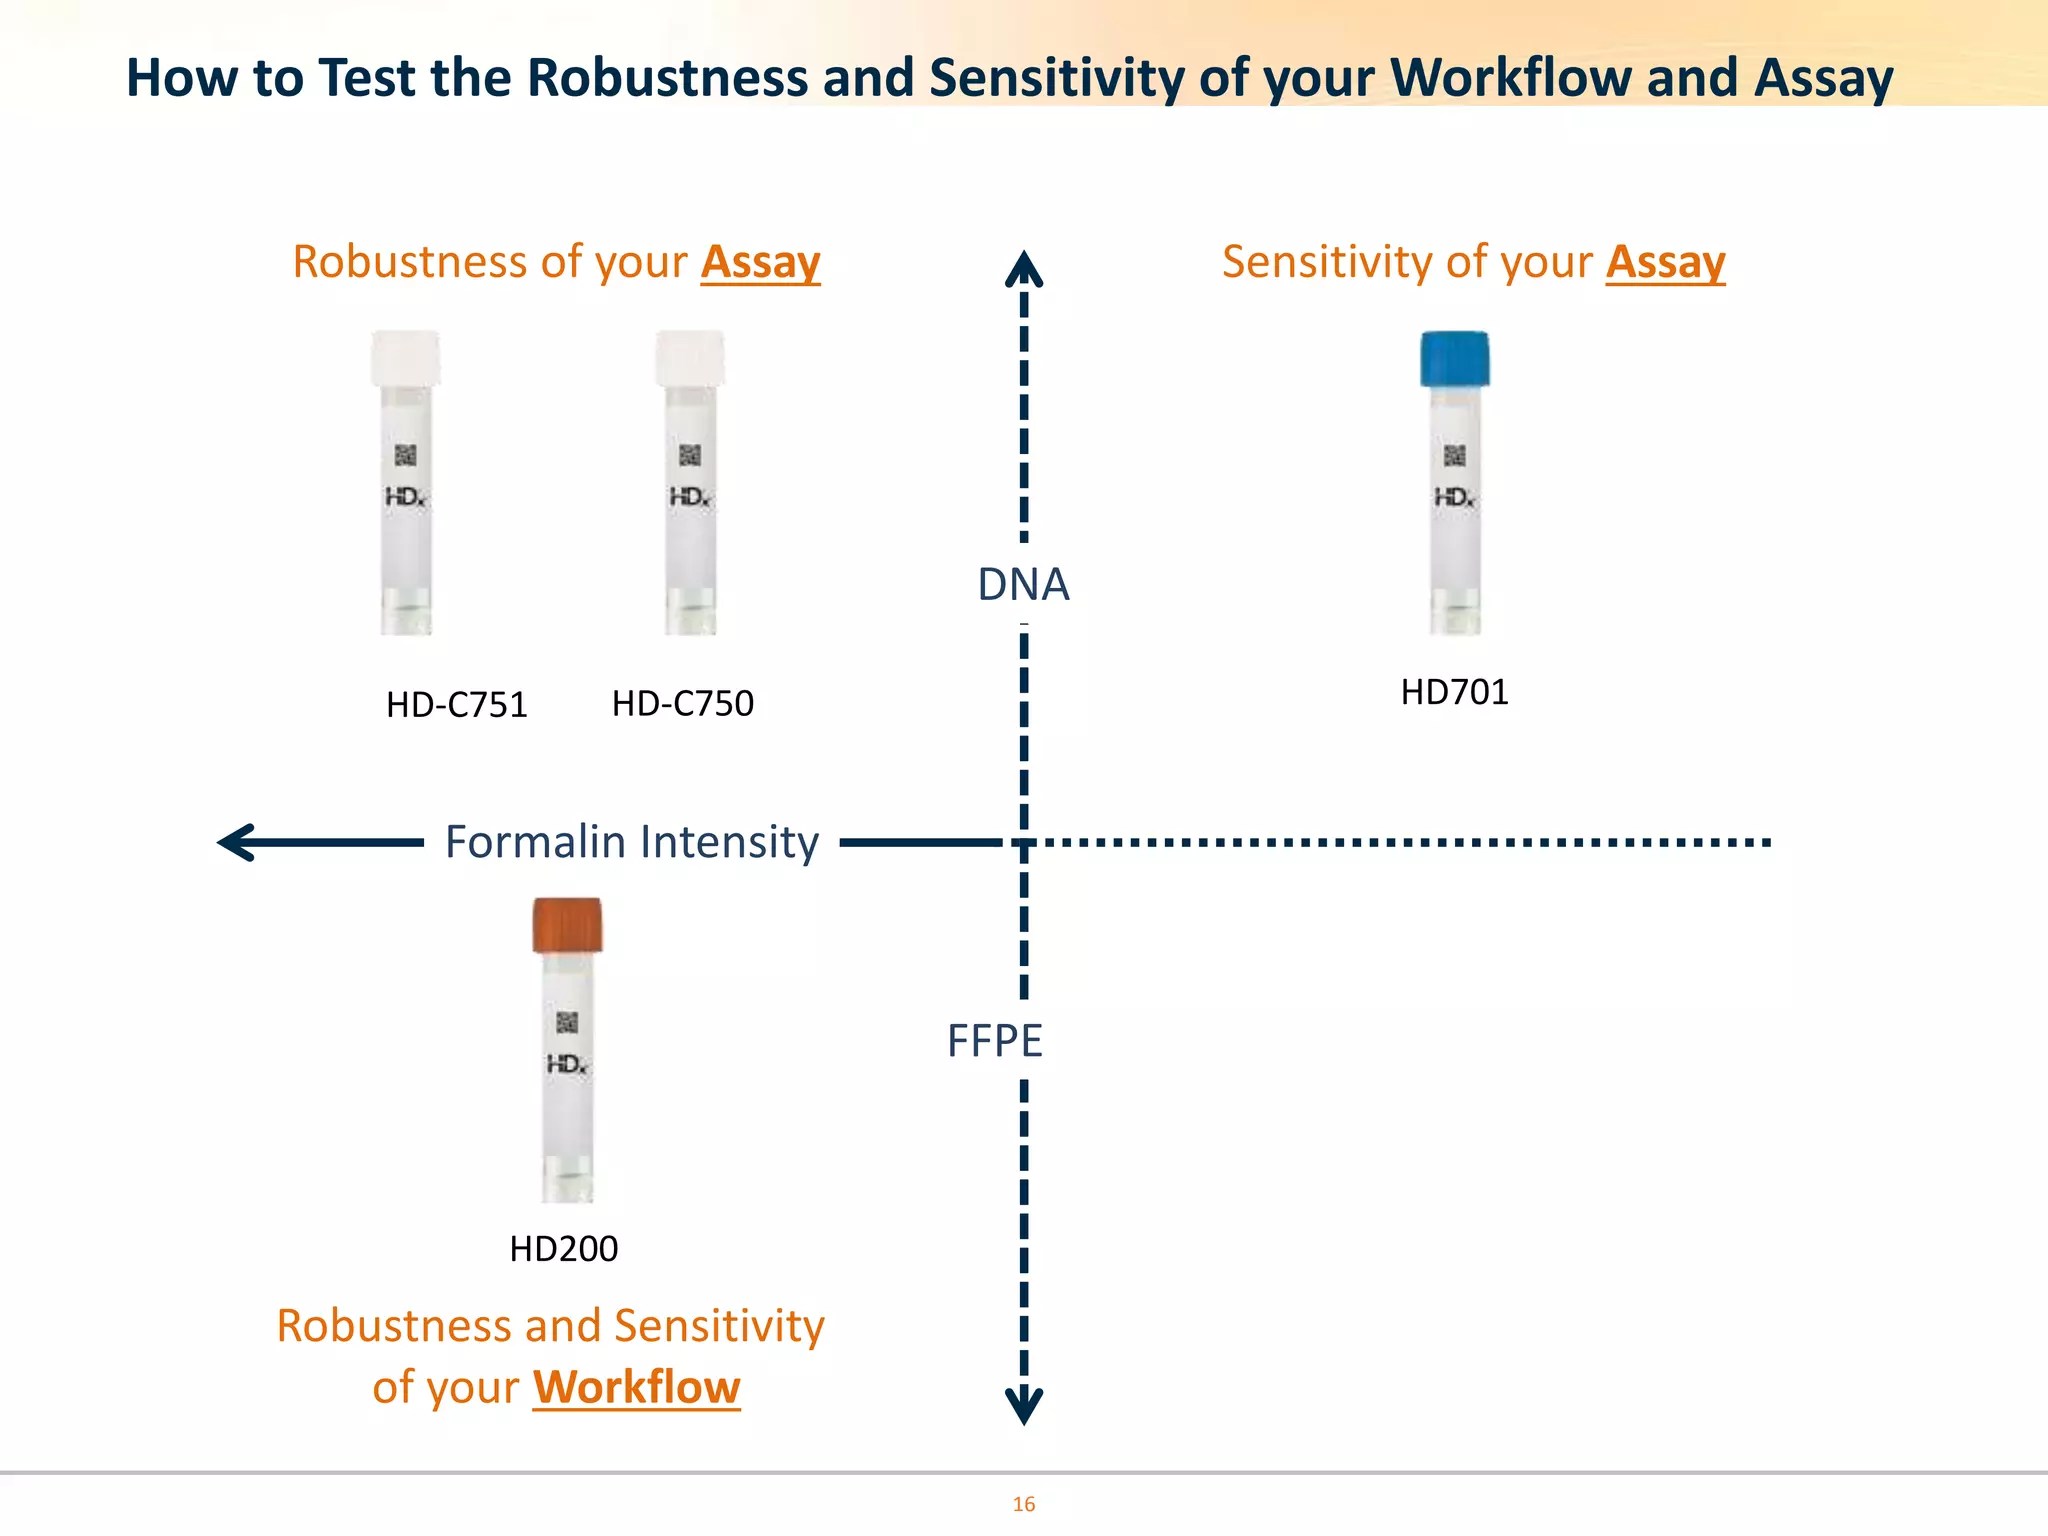
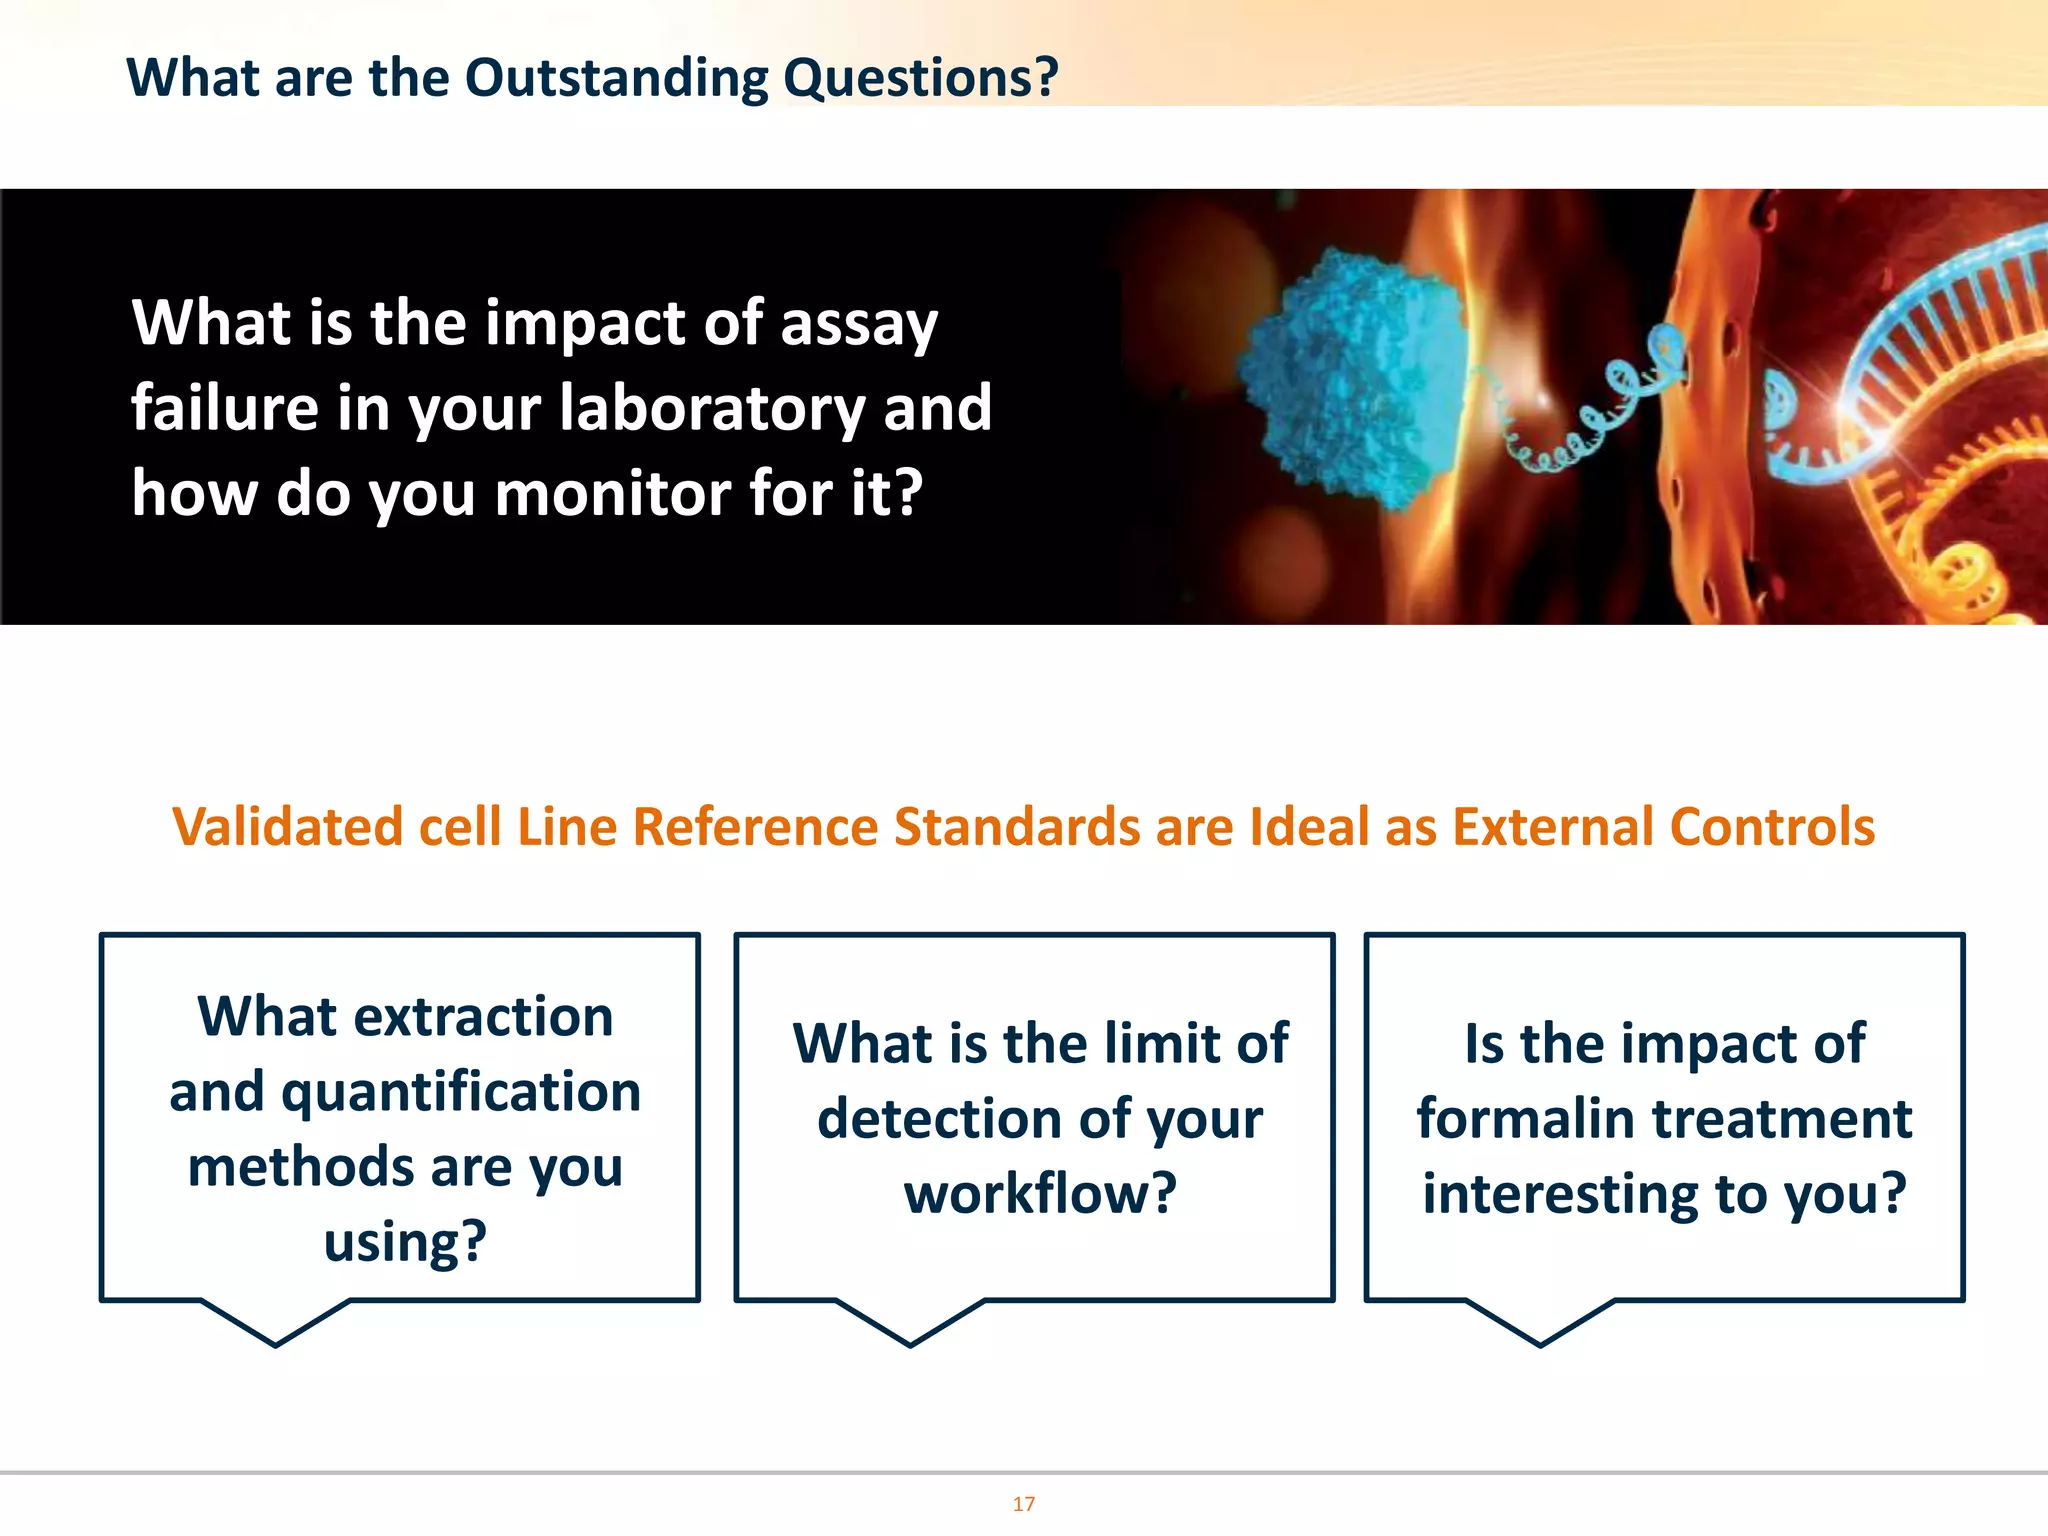
Addressing the Pre-PCR Analytical
Variability of FFPE Samples
What is the impact of assay failure
in your laboratory and how do you
monitor for it?
2
Addressing the Pre-PCR Analytical Variability of FFPE Samples
Pre-analytical Sample Handling and Processing
Biopsy DNA
Quantification
StorageDNA Extraction
DNA Quantity & Quality
FFPE
Processing
3
7
Analytical Processing and Reporting
DNA Sample Analysis
Actionable
Decision
Quality of Diagnostic
Result
Sample
preparation
5
FFPE HDx™ Reference Standards to monitor your complete workflow
Mutant Wild type
FFPE Processing
FFPE Sections
Digital PCR
Sanger Sequencing
RT-PCR
SNP 6.0
6
Characterization of FFPE HDx™ Reference Standards as External Controls
Specific Allelic Frequencies
i.e. 1%, 5%, 50%
Consistent FFPE Sections
400ng - 700ng per vial
What is the impact of assay failure
in your laboratory and how do you
monitor for it?
7
0
5
10
15
20
25
30
35
40
PercentageofIncorrectResults
EGFR Sample Tested
EGFR Genotyping Errors
External Quality Assessment 2014
8
External Quality Assessment Proficiency Testing Scheme - 2014
Using HDx™ Reference Standards the EQA scheme was able to identify and recommend improvements
Pre-analytical FFPE challenges
Pre-analytical main challenges
Efficacy of DNA extraction
• Small amount of DNA available –
mixture of tumour and normal DNA
• Various extraction methods and yields
Sample collection and handling
• Different labs follow different
protocols.
Tumour sample
Diagnosis
Therapy
DNA extraction
Genotyping
Accuracy of DNA quantification
• Various quantification methods
9
0%
10%
20%
30%
40%
50%
60%
70%
Promega
Maxwell
(n=12)
Promega
Magnesil (n=6)
Promega
ReliaPrep
(n=6)
Qiagen Dneasy
(n=6)
Roche Cobas
(n=6)
PercentageDNARecovered
Extraction Kit
DNA Recovery from Total Theoretical Yield
Comparison of DNA Extraction Methods (Internal data)
Quantified using QuantiFluor assay
10
0
10
20
30
40
50
60
70
80
90
Qiagen EZ1
(n=3)
COBAS (n=1) Lifetech
Recover All
(n=2)
Qiagen
Dneasy (n=3)
Qiagen
QIAmp (n=4)
CoefficientofVariation(%)
Extraction Method
Kapp J R et al. J Clin Pathol doi:10.1136/jclinpath-2014-202644
Variation within Extraction Methods (External study)
Quantified using Qubit
11
0
5
10
15
20
25
30
35
40
N/Q
Participant
Nanodrop:Qubit (N/Q Ratio)
Kapp J R et al. J Clin Pathol doi:10.1136/jclinpath-2014-202644
R2 = 0.4868, p<0.0001
DNA Quantitation
12
Summary
 Different extraction methods can result in varying DNA yields from the same
starting material.
 Nanodrop is very efficient at quantifying DNA at high concentrations
 At low concentrations spectrophotometry methods overestimate the DNA
concentration compared with fluorometry quantification methods
 Important implications on diagnostic test – false negatives.
13
Range of total DNA (ng) recovered from each sample by participants.
Kapp J R et al. J Clin Pathol doi:10.1136/jclinpath-2014-202644
Clinical Sample
Clinical samples cannot be utilised as external controls due to their huge variability
Cell Line Reference Standards
Validated Cell Line Reference Standards are ideal as External Controls
Validated Cell Line Reference Standards as External Controls
14
Mild Formalin Fixation Severe Formalin Fixation
Formalin leads to over-quantitation of DNA
Impact of Formalin Treatment on DNA Quantification
15
How to Test the Robustness and Sensitivity of your Workflow and Assay
Sensitivity of your Assay
HD701
Formalin Intensity
HD200
Robustness and Sensitivity
of your Workflow
HD-C751
FFPE
DNA
Robustness of your Assay
HD-C750
16
17
What are the Outstanding Questions?
What is the impact of assay
failure in your laboratory and
how do you monitor for it?
What extraction
and quantification
methods are you
using?
What is the limit of
detection of your
workflow?
Is the impact of
formalin treatment
interesting to you?
Validated cell Line Reference Standards are Ideal as External Controls
References
 Variation in pre-PCR processing of FFPE samples leads to discrepancies in BRAF
and EGFR mutation detection: a diagnostic RING trial (2014)
Kapp J, Diss T, Spicer J,Gandy M, Schrijver I, Jennings L, Li M, Tsongalis G, et al.,
Journal of Clinical Pathology, Volume 67
 Assessing standardization of molecular testing for non-small-cell lung cancer:
results of a worldwide external quality assessment (EQA) scheme for EGFR
mutation testing (2014)
Patton, S., Normanno, N., Murray, S., Kerr, K., Dietel, M., Filipits, M., et al. British
Journal of Cancer, 413-420.
18

Addressing the Pre-PCR Analytical Variability of FFPE Samples

  • 1.
    Addressing the Pre-PCRAnalytical Variability of FFPE Samples
  • 2.
    What is theimpact of assay failure in your laboratory and how do you monitor for it? 2 Addressing the Pre-PCR Analytical Variability of FFPE Samples
  • 3.
    Pre-analytical Sample Handlingand Processing Biopsy DNA Quantification StorageDNA Extraction DNA Quantity & Quality FFPE Processing 3
  • 4.
    7 Analytical Processing andReporting DNA Sample Analysis Actionable Decision Quality of Diagnostic Result Sample preparation
  • 5.
    5 FFPE HDx™ ReferenceStandards to monitor your complete workflow Mutant Wild type FFPE Processing FFPE Sections Digital PCR Sanger Sequencing RT-PCR SNP 6.0
  • 6.
    6 Characterization of FFPEHDx™ Reference Standards as External Controls Specific Allelic Frequencies i.e. 1%, 5%, 50% Consistent FFPE Sections 400ng - 700ng per vial
  • 7.
    What is theimpact of assay failure in your laboratory and how do you monitor for it? 7
  • 8.
    0 5 10 15 20 25 30 35 40 PercentageofIncorrectResults EGFR Sample Tested EGFRGenotyping Errors External Quality Assessment 2014 8 External Quality Assessment Proficiency Testing Scheme - 2014 Using HDx™ Reference Standards the EQA scheme was able to identify and recommend improvements
  • 9.
    Pre-analytical FFPE challenges Pre-analyticalmain challenges Efficacy of DNA extraction • Small amount of DNA available – mixture of tumour and normal DNA • Various extraction methods and yields Sample collection and handling • Different labs follow different protocols. Tumour sample Diagnosis Therapy DNA extraction Genotyping Accuracy of DNA quantification • Various quantification methods 9
  • 10.
    0% 10% 20% 30% 40% 50% 60% 70% Promega Maxwell (n=12) Promega Magnesil (n=6) Promega ReliaPrep (n=6) Qiagen Dneasy (n=6) RocheCobas (n=6) PercentageDNARecovered Extraction Kit DNA Recovery from Total Theoretical Yield Comparison of DNA Extraction Methods (Internal data) Quantified using QuantiFluor assay 10
  • 11.
    0 10 20 30 40 50 60 70 80 90 Qiagen EZ1 (n=3) COBAS (n=1)Lifetech Recover All (n=2) Qiagen Dneasy (n=3) Qiagen QIAmp (n=4) CoefficientofVariation(%) Extraction Method Kapp J R et al. J Clin Pathol doi:10.1136/jclinpath-2014-202644 Variation within Extraction Methods (External study) Quantified using Qubit 11
  • 12.
    0 5 10 15 20 25 30 35 40 N/Q Participant Nanodrop:Qubit (N/Q Ratio) KappJ R et al. J Clin Pathol doi:10.1136/jclinpath-2014-202644 R2 = 0.4868, p<0.0001 DNA Quantitation 12
  • 13.
    Summary  Different extractionmethods can result in varying DNA yields from the same starting material.  Nanodrop is very efficient at quantifying DNA at high concentrations  At low concentrations spectrophotometry methods overestimate the DNA concentration compared with fluorometry quantification methods  Important implications on diagnostic test – false negatives. 13
  • 14.
    Range of totalDNA (ng) recovered from each sample by participants. Kapp J R et al. J Clin Pathol doi:10.1136/jclinpath-2014-202644 Clinical Sample Clinical samples cannot be utilised as external controls due to their huge variability Cell Line Reference Standards Validated Cell Line Reference Standards are ideal as External Controls Validated Cell Line Reference Standards as External Controls 14
  • 15.
    Mild Formalin FixationSevere Formalin Fixation Formalin leads to over-quantitation of DNA Impact of Formalin Treatment on DNA Quantification 15
  • 16.
    How to Testthe Robustness and Sensitivity of your Workflow and Assay Sensitivity of your Assay HD701 Formalin Intensity HD200 Robustness and Sensitivity of your Workflow HD-C751 FFPE DNA Robustness of your Assay HD-C750 16
  • 17.
    17 What are theOutstanding Questions? What is the impact of assay failure in your laboratory and how do you monitor for it? What extraction and quantification methods are you using? What is the limit of detection of your workflow? Is the impact of formalin treatment interesting to you? Validated cell Line Reference Standards are Ideal as External Controls
  • 18.
    References  Variation inpre-PCR processing of FFPE samples leads to discrepancies in BRAF and EGFR mutation detection: a diagnostic RING trial (2014) Kapp J, Diss T, Spicer J,Gandy M, Schrijver I, Jennings L, Li M, Tsongalis G, et al., Journal of Clinical Pathology, Volume 67  Assessing standardization of molecular testing for non-small-cell lung cancer: results of a worldwide external quality assessment (EQA) scheme for EGFR mutation testing (2014) Patton, S., Normanno, N., Murray, S., Kerr, K., Dietel, M., Filipits, M., et al. British Journal of Cancer, 413-420. 18

Editor's Notes

  • #2 Before I begin, I would like to ask you one question – what is the impact of assay failure in your laboratory and how do you monitor for it?
  • #6 FFPE The FFPE reference standards are provided as predefined FFPE sections in a tube that you take extract the DNA and run on your molecular assay. These are ideal for the routine monitoring of your workflow and can be adopted to be run daily in your assay workflow. We expect a DNA recovery of between 400ng – 700ng from our FFPE sections depending on the DNA extraction method that you use. We pride ourselves on the consistency and homogeneity of our FFPE blocks and sections and this allows you to test both the pre-analytical and analytical aspects of your workflow.
  • #7 FFPE The FFPE reference standards are provided as predefined FFPE sections in a tube that you take extract the DNA and run on your molecular assay. These are ideal for the routine monitoring of your workflow and can be adopted to be run daily in your assay workflow. We expect a DNA recovery of between 400ng – 700ng from our FFPE sections depending on the DNA extraction method that you use. We pride ourselves on the consistency and homogeneity of our FFPE blocks and sections and this allows you to test both the pre-analytical and analytical aspects of your workflow.
  • #9 EGFR test, 91 labs participated 70%. With their best efforts put forward still got it wrong 30% of the time.
  • #10 I’d like to start with an introduction to the main pre-analytical challenges. On the left hand side you will see the typical workflow for FFPE sample processing and the first challenge starts right at the beginning of the process with differences in sample collection and handling. Different labs follow different protocols for sample fixation and FFPE embedding and these can both influence the downstream processing of the samples. The second challenge relates to the efficacy of DNA extraction – often with tissue samples there is only a small amount of material available, some of which could be normal tissue. In addition, labs use various DNA extraction methods, some of which are automated, some are manual and all can result in different DNA yields obtained. Finally, the third challenge is in the accuracy of DNA quantification with different methods sometimes yielding quite startlingly different results. Over the next few slides I will discuss the challenges in more detail and show you some internal and external study data….
  • #11 This slide is internally generated data and demonstrates the variation between five of the commonly used DNA extraction methods. The graph shows the different extraction methods employed on the X axis, with a sample number of 6 of 12 for each method. Each FFPE section extracted was the same Horizon FFPE Reference Standard which Jonathan introduced you to earlier and they were all quantified using the QuantliFluor assay. On the Y axis shows the percentage of DNA recovered. In this particular dataset the Promega Maxwell platform gives the greatest yield from the sections and also showed a high degree reproducibility across the 12 replicates. The take home message here is that this data highlights that the same samples extracted on different platforms can give quite different yields.
  • #12 The data presented on this slide was externally generated and highlights the variation within different FFPE extraction methods. Thirteen molecular pathology laboratories were recruited and participated in this study – They extracted a total of 104 FFPE curls utilising five different extraction methods. The FFPE curls extracted were all Horizon FFPE Reference Standards and DNA extractions were quantified using the Qubit. The N number refers to the number of labs employing that particular method. The results demonstrate that Qiagen EZ1 had the lowest yield variance (CV of 52%) and the Qiagen QIAamp had the highest with a CV of 82%. This slide highlights that different extraction methods can have different levels of variability across multiple samples. Qiagen EZ1 = For automated purification of DNA from 1–6 or 1–14 forensic and human identity samples per run
  • #13 This dataset was also externally generated from the same study as the previous slide – The figure shows the average nanodrop to qubit ratio for each one of the 13 laboratories as well as the average and median ratio for the entire cohort. The correlation between nanodrop and qubit measurements for 78 identical samples was poor with an R2 of 0.48 and a P value of less than 0.0001. The median nanodrop readings were 5.1 fold higher that the qubit measurements for the same samples. If they measured the same the N/Q ratio would be 1 The take-home message for this slide is that for every participating lab, the nanodrop over quantified the DNA concentration compared to the Qubit reading. Analyzing the cause of a failed assay is a particular challenge for laboratories not used to handling FFPE samples, or for laboratories using quantification methodologies that tend to overestimate the amount of DNA in a sample when measuring concentrations below 20 ng per microliter. As a comparison of the different methodologies spectrophotometery is very accurate for samples above 10 or 20ng/µL and can be used to confirm contamination with protein or RNA. In comparison Fluometry based methods are suitable for DNA concetrations below 10ng/µL but can be inaccurate for very highly concentrated samples. However, fluormety methods can be used for both high molecular weight and fragmented DNA samples.
  • #14 Important to realise that different extraction methods can result in varying DNA yields from the same starting material. At low concentrations (less than 20ng/µL) the spectrophotometry methods can overestimate the DNA concentration
  • #15 Range of total DNA (in nanograms) recovered from each sample by participants. In total, 104 samples were analysed. Samples 1–4 comprise theoretical DNA yields of approximately 1100 ng, sample 5 comprises a cell-negative curl, sample 6 comprises a tonsil tissue specimen, sample 7 comprises 1100 ng theoretical DNA yield, in turn harbouring BRAF V600E and EGFR G719S, and sample 8 comprises 1100 ng theoretical DNA yield, in turn harbouring BRAF V600E and EGFR L858R. The range of DNA recovered from the engineered samples, after dropping laboratory K outlier values, was >55-fold for two of the six and >5-fold for the four others. Range in DNA recovered from control sample 6, excluding outliers from laboratory K, was >40-fold.