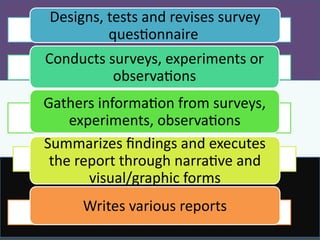
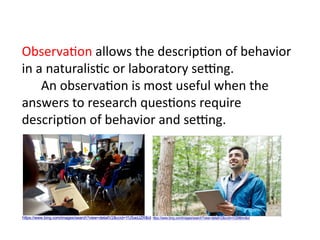
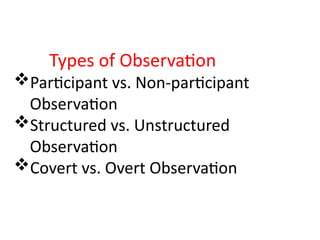
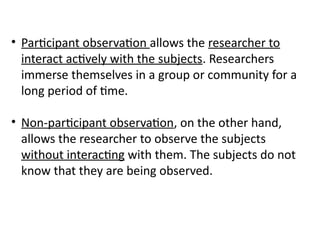
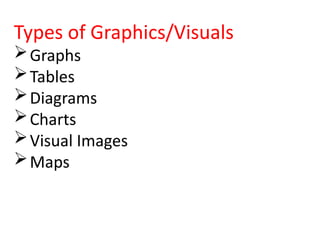
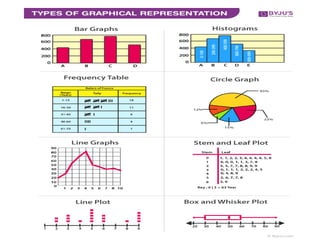
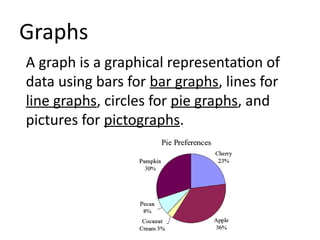
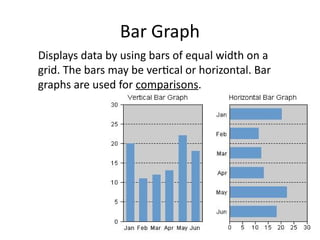
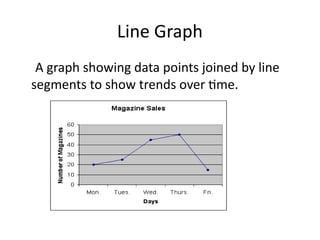
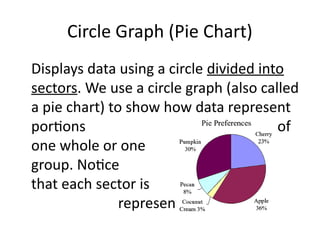
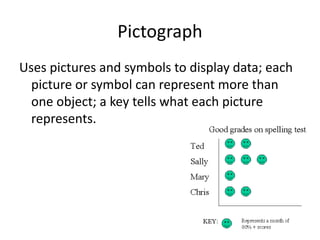
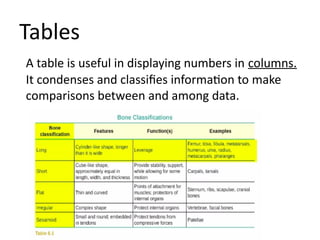
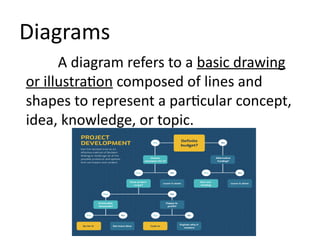
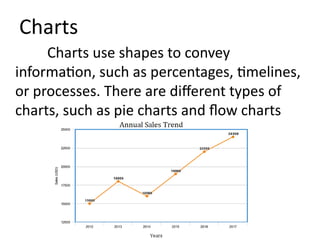
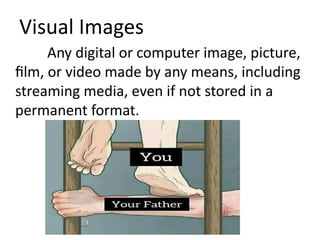
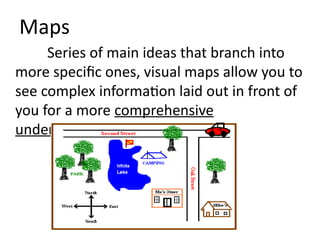
Designs, tests and revises survey
questionnaire
Conducts surveys, experiments or
observations
Gathers information from surveys,
experiments, observations
Summarizes findings and executes
the report through narrative and
visual/graphic forms
Writes various reports
Observation allows the description of behavior
in a naturalistic or laboratory setting.
An observation is most useful when the
answers to research questions require
description of behavior and setting.
Types of Observation
Participant vs. Non-participant
Observation
Structured vs. Unstructured
Observation
Covert vs. Overt Observation
• Participant observation allows the researcher to
interact actively with the subjects. Researchers
immerse themselves in a group or community for a
long period of time.
• Non-participant observation, on the other hand,
allows the researcher to observe the subjects
without interacting with them. The subjects do not
know that they are being observed.
• Structured observation occurs when the
researcher has a list of behaviors that he/she
wants to observe.
• Unstructured observation occurs when the
researcher allows behaviors to emerge.
These behaviors are then documented
through an in-depth narrative account.
• Covert observation occurs when the
subjects are not aware that they are
being observed.
• Overt observation occurs when the
subjects are aware that they are
being observed.
Experiment is a procedure undertaken
scientifically and systematically to make a
discovery and to test a hypothesis. An
experiment can be performed in a
laboratory or in natural setting.
How to Gather Information
 Written descriptions - The researcher makes written
descriptions of the people, situations or environment.
 Video recordings- The camera may not always see
everything.
 Photographs and artifacts-Include objects of
significance—memorabilia, instruments, tools and
others.
 Documentation-is used to provide information—a
local paper, information on a notice board,
administrative policies and procedures.
Graphics/Visuals
 Visual aids are supplements for words using
pictures, graphs, or other visual information.
 They help the audience understand and
remember the data.
 They increase audience interest.
 They act as notes or reminders for the speaker.
Types of Graphics/Visuals
Graphs
Tables
Diagrams
Charts
Visual Images
Maps
A graph is a graphical representation of
data using bars for bar graphs, lines for
line graphs, circles for pie graphs, and
pictures for pictographs.
Graphs
Bar Graph
Displays data by using bars of equal width on a
grid. The bars may be vertical or horizontal. Bar
graphs are used for comparisons.
Line Graph
A graph showing data points joined by line
segments to show trends over time.
Circle Graph (Pie Chart)
Displays data using a circle divided into
sectors. We use a circle graph (also called
a pie chart) to show how data represent
portions of
one whole or one
group. Notice
that each sector is
represented by %
Pictograph
Uses pictures and symbols to display data; each
picture or symbol can represent more than
one object; a key tells what each picture
represents.
A table is useful in displaying numbers in columns.
It condenses and classifies information to make
comparisons between and among data.
Tables
A diagram refers to a basic drawing
or illustration composed of lines and
shapes to represent a particular concept,
idea, knowledge, or topic.
Diagrams
Charts use shapes to convey
information, such as percentages, timelines,
or processes. There are different types of
charts, such as pie charts and flow charts
Charts
Any digital or computer image, picture,
film, or video made by any means, including
streaming media, even if not stored in a
permanent format.
Visual Images
Series of main ideas that branch into
more specific ones, visual maps allow you to
see complex information laid out in front of
you for a more comprehensive
understanding.
Maps
1. What are the four ways in gathering
data?
2. What are the things to remember in
designing a survey questionnaire?
3. What are the different visuals/ graphic
aids that we can use to present
gathered data?
Let’s sum it up!
1.Design survey questionnaire.
2.Conduct survey.
3.Gather information from survey.
4.Summarize findings and execute the
report through narrative and
visual/graphic forms
5.Write survey report.
Deadline: February 3, 2023 (Friday)
Last Output!
A research report is an expanded paper
that presents results and interpretation of
a phenomenon so that readers can better
understand it.
It is not a summary of different articles.
Rather, it is produced through formal
investigation and scientific inquiry.
What is a research report?
•Topic
•Type of paper
•Length
•Number of sources required
•Type of Sources
•Documentation Style
•Deadlines
•Format
•Parts of the Research Report
Requirements needed to complete a research
report:
1. Title Page
2. Abstract
3. Introduction
4. Literature Review
5. Methodology
6. Results
7. Discussion
8. Conclusion
9. References
Parts of a Research Report
1.It is a graphical representation of data using
symbols that are usually boxes, lines, and
arrows.
2.This visual is useful in displaying numbers in
columns, condensing and classifying information
to make comparisons.
3.It refers to a basic drawing or illustration
composed of lines and shapes to represent a
particular concept, idea, knowledge, or topic.
I. Identify what visual or graphic form was
being described.
4. It is a series of main ideas that branch into
more specific ones. It allows you to see
complex information for a more
comprehensive understanding.
5. It is a type of observation that allows the
researcher to interact actively with the
subjects.
6. It allows the researcher to observe the
subjects without interacting with them.
7. It occurs when the researcher has a list of
behaviors that he/she wants to observe.
8. It occurs when the researcher allows
behaviors to emerge. These behaviors are
then documented through an in-depth
narrative account.
9. It occurs when the subjects are aware that
they are being observed.
10. It happens when the subjects are not
aware that they are being observed.

Additional powerpoint presentation in EAPP

  • 1.
    Designs, tests andrevises survey questionnaire Conducts surveys, experiments or observations Gathers information from surveys, experiments, observations Summarizes findings and executes the report through narrative and visual/graphic forms Writes various reports
  • 2.
    Observation allows thedescription of behavior in a naturalistic or laboratory setting. An observation is most useful when the answers to research questions require description of behavior and setting.
  • 3.
    Types of Observation Participantvs. Non-participant Observation Structured vs. Unstructured Observation Covert vs. Overt Observation
  • 4.
    • Participant observationallows the researcher to interact actively with the subjects. Researchers immerse themselves in a group or community for a long period of time. • Non-participant observation, on the other hand, allows the researcher to observe the subjects without interacting with them. The subjects do not know that they are being observed.
  • 5.
    • Structured observationoccurs when the researcher has a list of behaviors that he/she wants to observe. • Unstructured observation occurs when the researcher allows behaviors to emerge. These behaviors are then documented through an in-depth narrative account.
  • 6.
    • Covert observationoccurs when the subjects are not aware that they are being observed. • Overt observation occurs when the subjects are aware that they are being observed.
  • 7.
    Experiment is aprocedure undertaken scientifically and systematically to make a discovery and to test a hypothesis. An experiment can be performed in a laboratory or in natural setting.
  • 8.
    How to GatherInformation  Written descriptions - The researcher makes written descriptions of the people, situations or environment.  Video recordings- The camera may not always see everything.  Photographs and artifacts-Include objects of significance—memorabilia, instruments, tools and others.  Documentation-is used to provide information—a local paper, information on a notice board, administrative policies and procedures.
  • 9.
    Graphics/Visuals  Visual aidsare supplements for words using pictures, graphs, or other visual information.  They help the audience understand and remember the data.  They increase audience interest.  They act as notes or reminders for the speaker.
  • 10.
  • 12.
    A graph isa graphical representation of data using bars for bar graphs, lines for line graphs, circles for pie graphs, and pictures for pictographs. Graphs
  • 13.
    Bar Graph Displays databy using bars of equal width on a grid. The bars may be vertical or horizontal. Bar graphs are used for comparisons.
  • 14.
    Line Graph A graphshowing data points joined by line segments to show trends over time.
  • 15.
    Circle Graph (PieChart) Displays data using a circle divided into sectors. We use a circle graph (also called a pie chart) to show how data represent portions of one whole or one group. Notice that each sector is represented by %
  • 16.
    Pictograph Uses pictures andsymbols to display data; each picture or symbol can represent more than one object; a key tells what each picture represents.
  • 17.
    A table isuseful in displaying numbers in columns. It condenses and classifies information to make comparisons between and among data. Tables
  • 18.
    A diagram refersto a basic drawing or illustration composed of lines and shapes to represent a particular concept, idea, knowledge, or topic. Diagrams
  • 19.
    Charts use shapesto convey information, such as percentages, timelines, or processes. There are different types of charts, such as pie charts and flow charts Charts
  • 20.
    Any digital orcomputer image, picture, film, or video made by any means, including streaming media, even if not stored in a permanent format. Visual Images
  • 21.
    Series of mainideas that branch into more specific ones, visual maps allow you to see complex information laid out in front of you for a more comprehensive understanding. Maps
  • 22.
    1. What arethe four ways in gathering data? 2. What are the things to remember in designing a survey questionnaire? 3. What are the different visuals/ graphic aids that we can use to present gathered data? Let’s sum it up!
  • 23.
    1.Design survey questionnaire. 2.Conductsurvey. 3.Gather information from survey. 4.Summarize findings and execute the report through narrative and visual/graphic forms 5.Write survey report. Deadline: February 3, 2023 (Friday) Last Output!
  • 24.
    A research reportis an expanded paper that presents results and interpretation of a phenomenon so that readers can better understand it. It is not a summary of different articles. Rather, it is produced through formal investigation and scientific inquiry. What is a research report?
  • 25.
    •Topic •Type of paper •Length •Numberof sources required •Type of Sources •Documentation Style •Deadlines •Format •Parts of the Research Report Requirements needed to complete a research report:
  • 26.
    1. Title Page 2.Abstract 3. Introduction 4. Literature Review 5. Methodology 6. Results 7. Discussion 8. Conclusion 9. References Parts of a Research Report
  • 27.
    1.It is agraphical representation of data using symbols that are usually boxes, lines, and arrows. 2.This visual is useful in displaying numbers in columns, condensing and classifying information to make comparisons. 3.It refers to a basic drawing or illustration composed of lines and shapes to represent a particular concept, idea, knowledge, or topic. I. Identify what visual or graphic form was being described.
  • 28.
    4. It isa series of main ideas that branch into more specific ones. It allows you to see complex information for a more comprehensive understanding. 5. It is a type of observation that allows the researcher to interact actively with the subjects. 6. It allows the researcher to observe the subjects without interacting with them.
  • 29.
    7. It occurswhen the researcher has a list of behaviors that he/she wants to observe. 8. It occurs when the researcher allows behaviors to emerge. These behaviors are then documented through an in-depth narrative account. 9. It occurs when the subjects are aware that they are being observed. 10. It happens when the subjects are not aware that they are being observed.