Downloaded 312 times

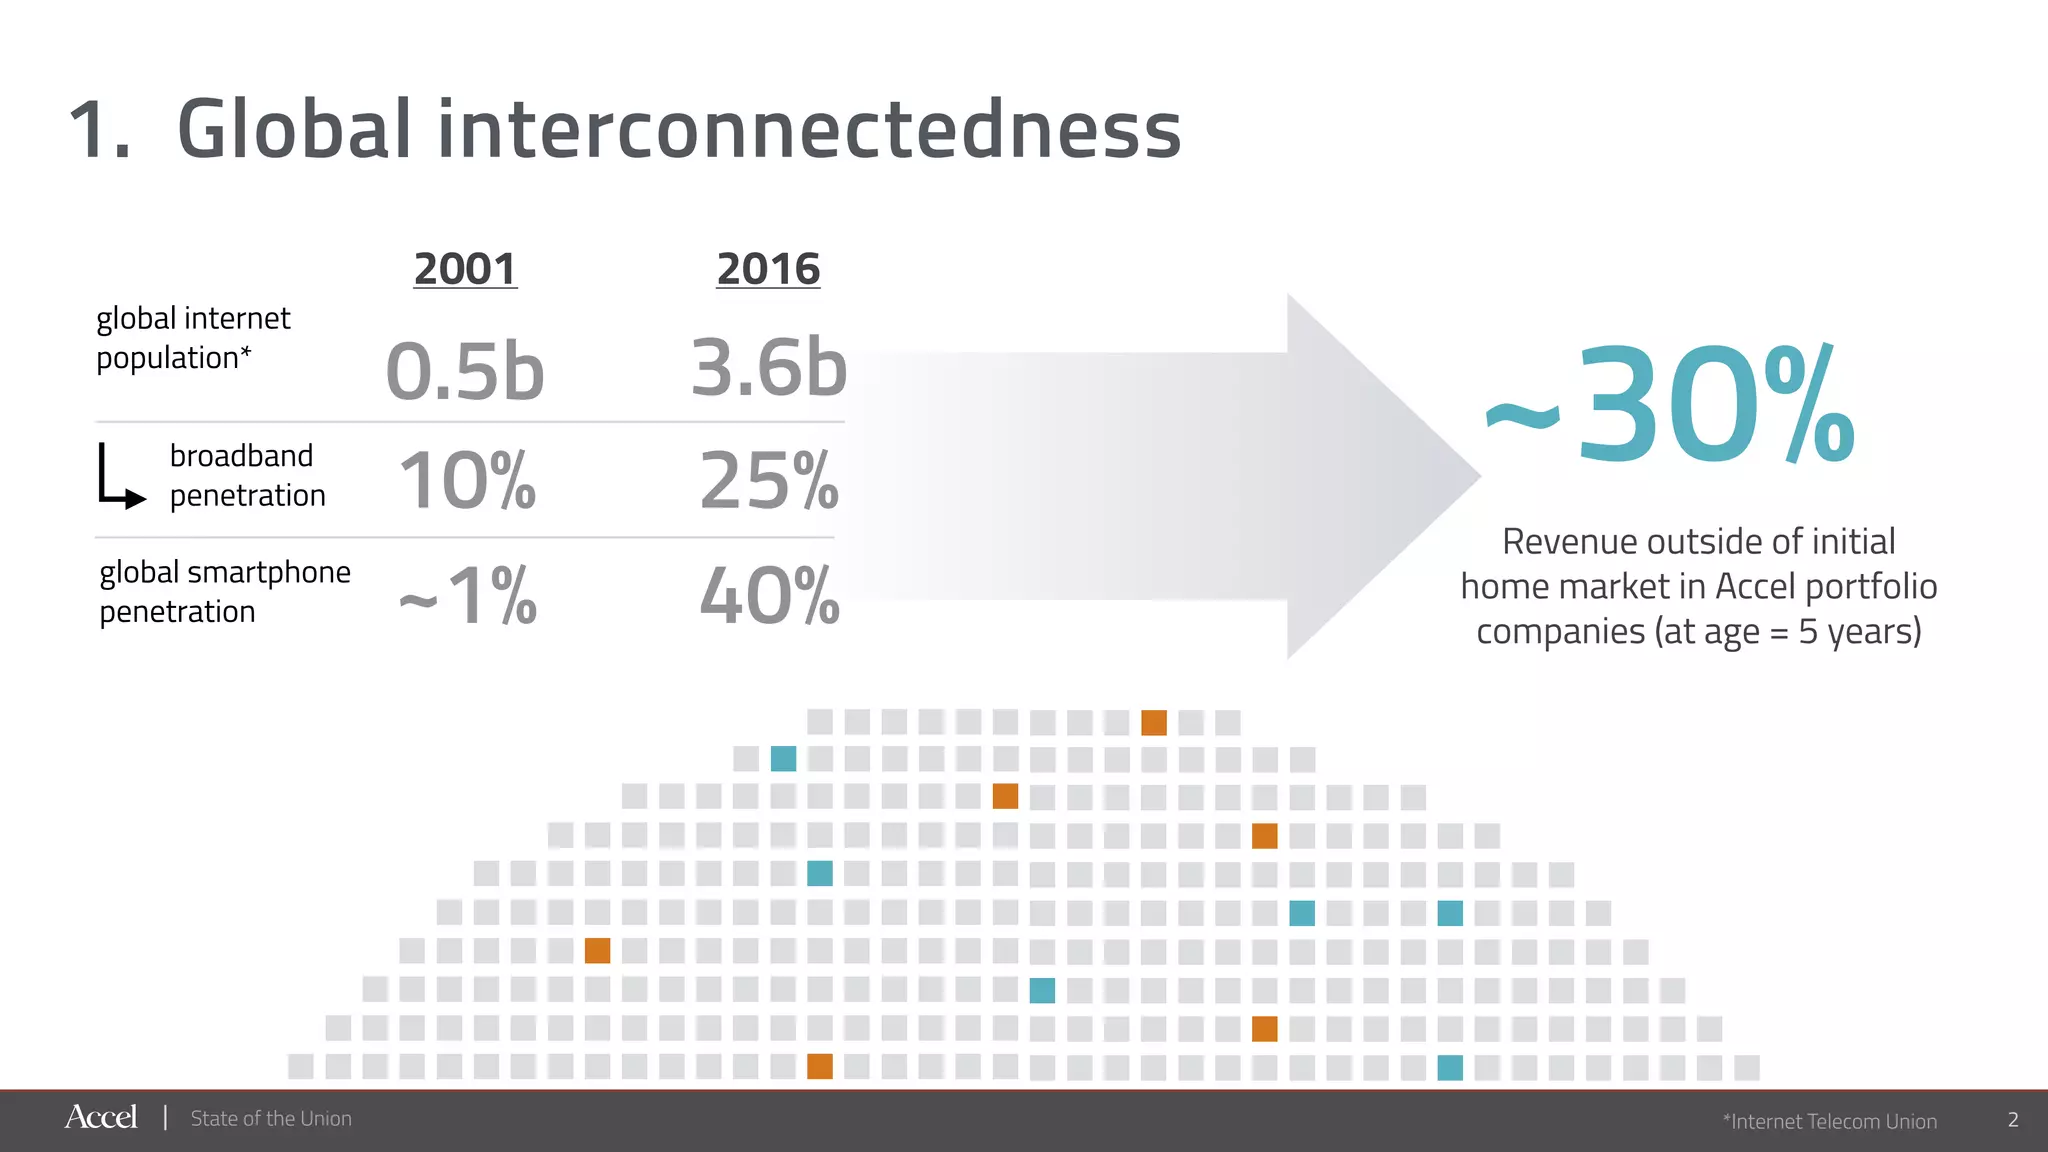

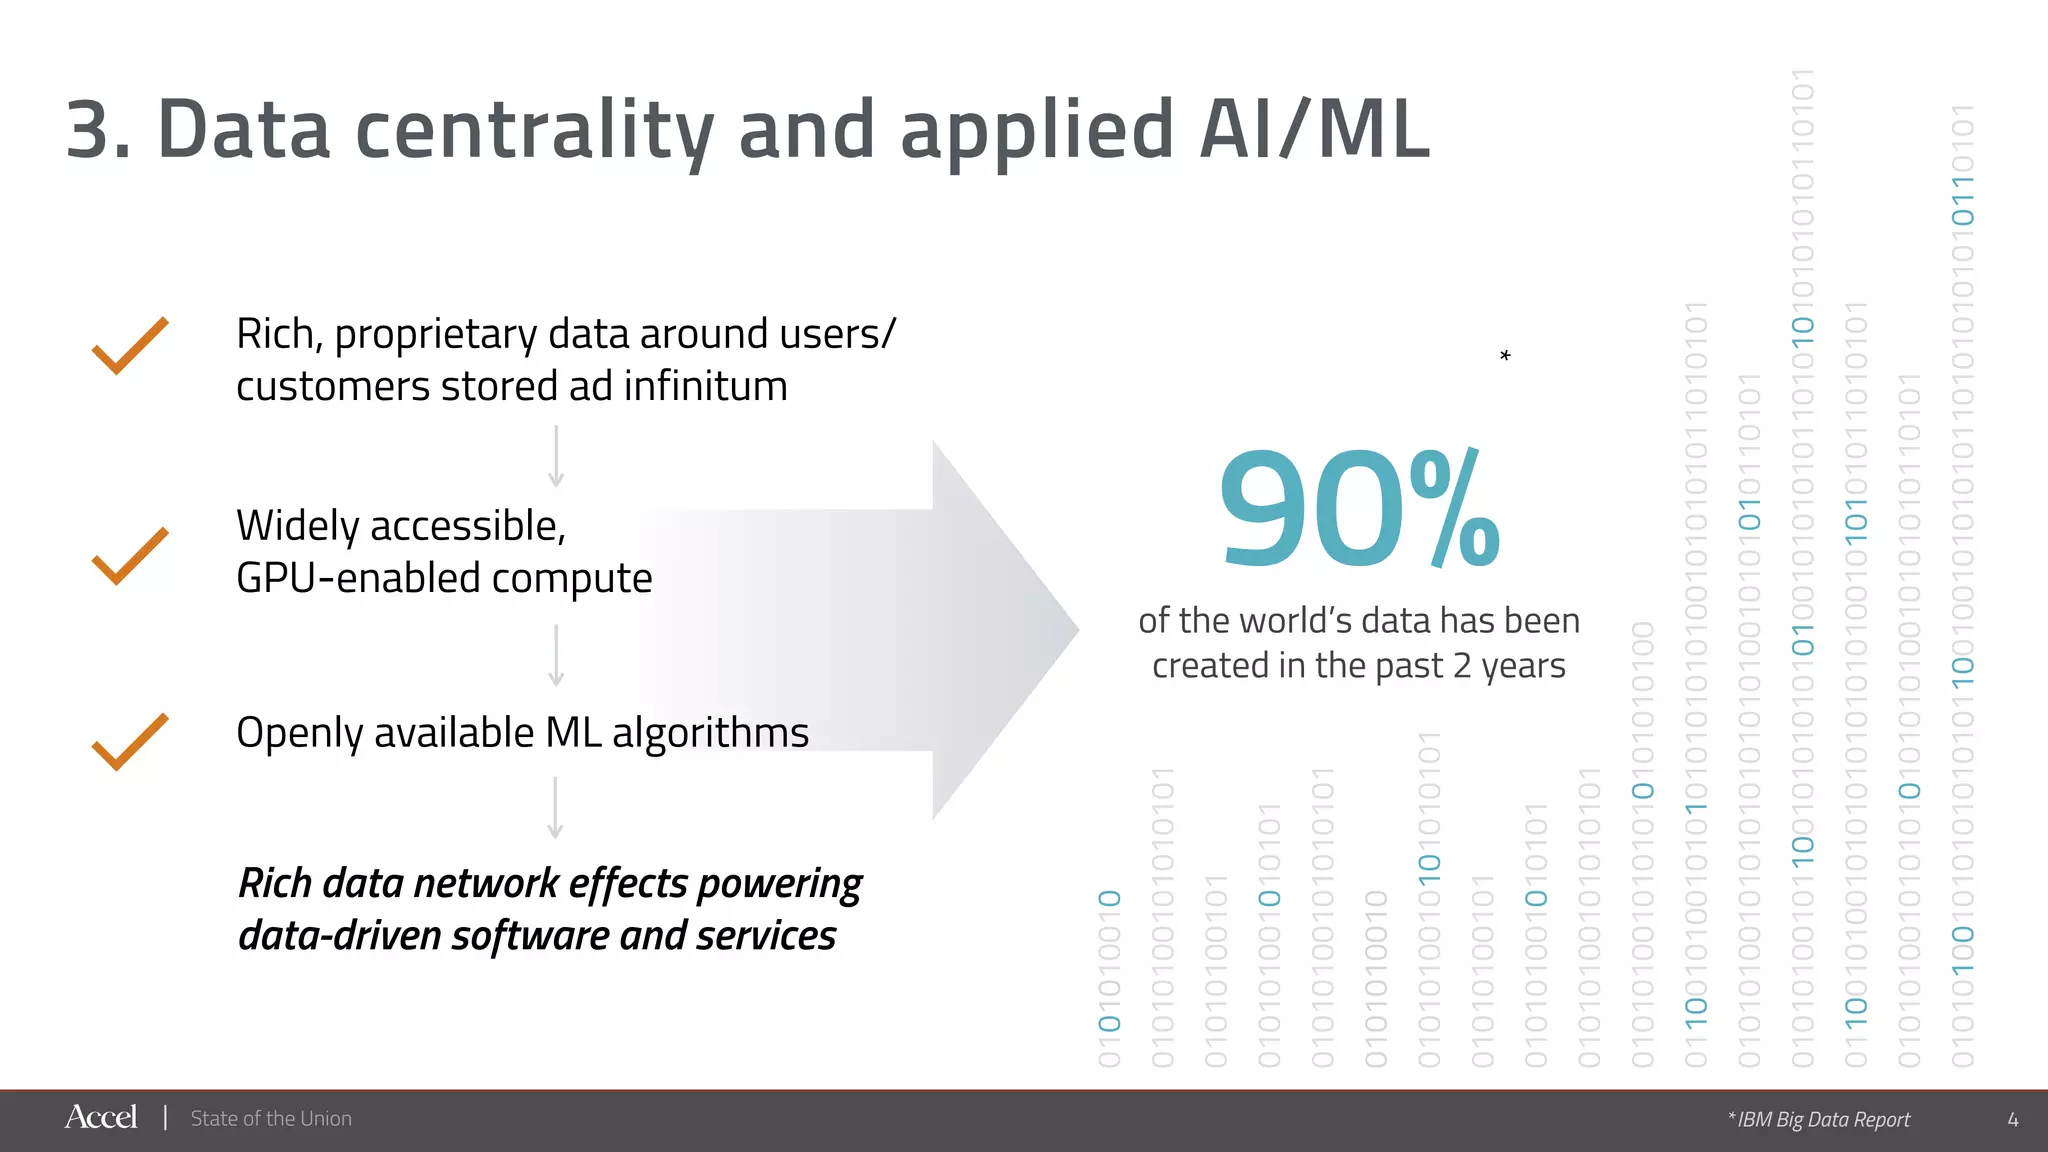

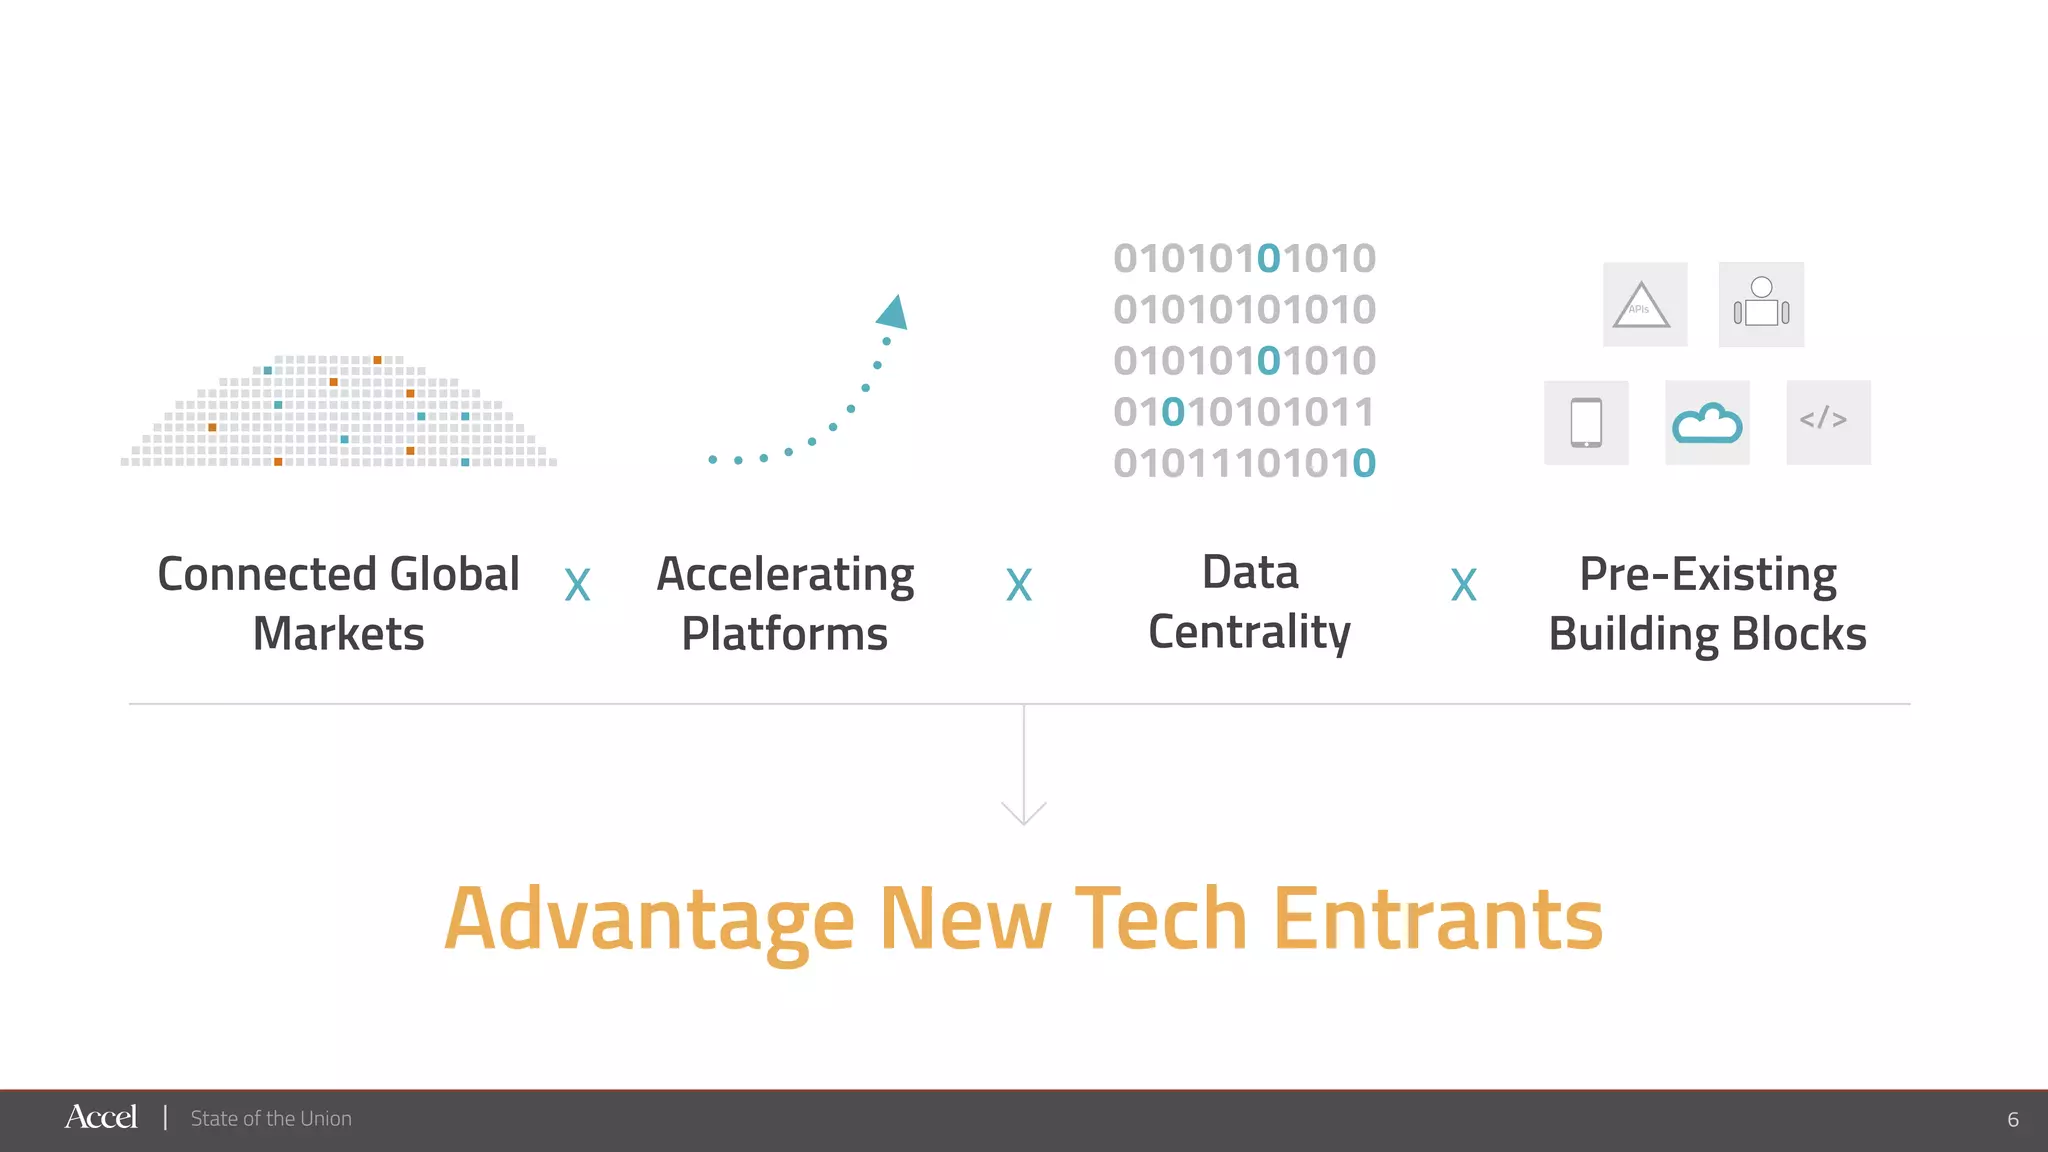


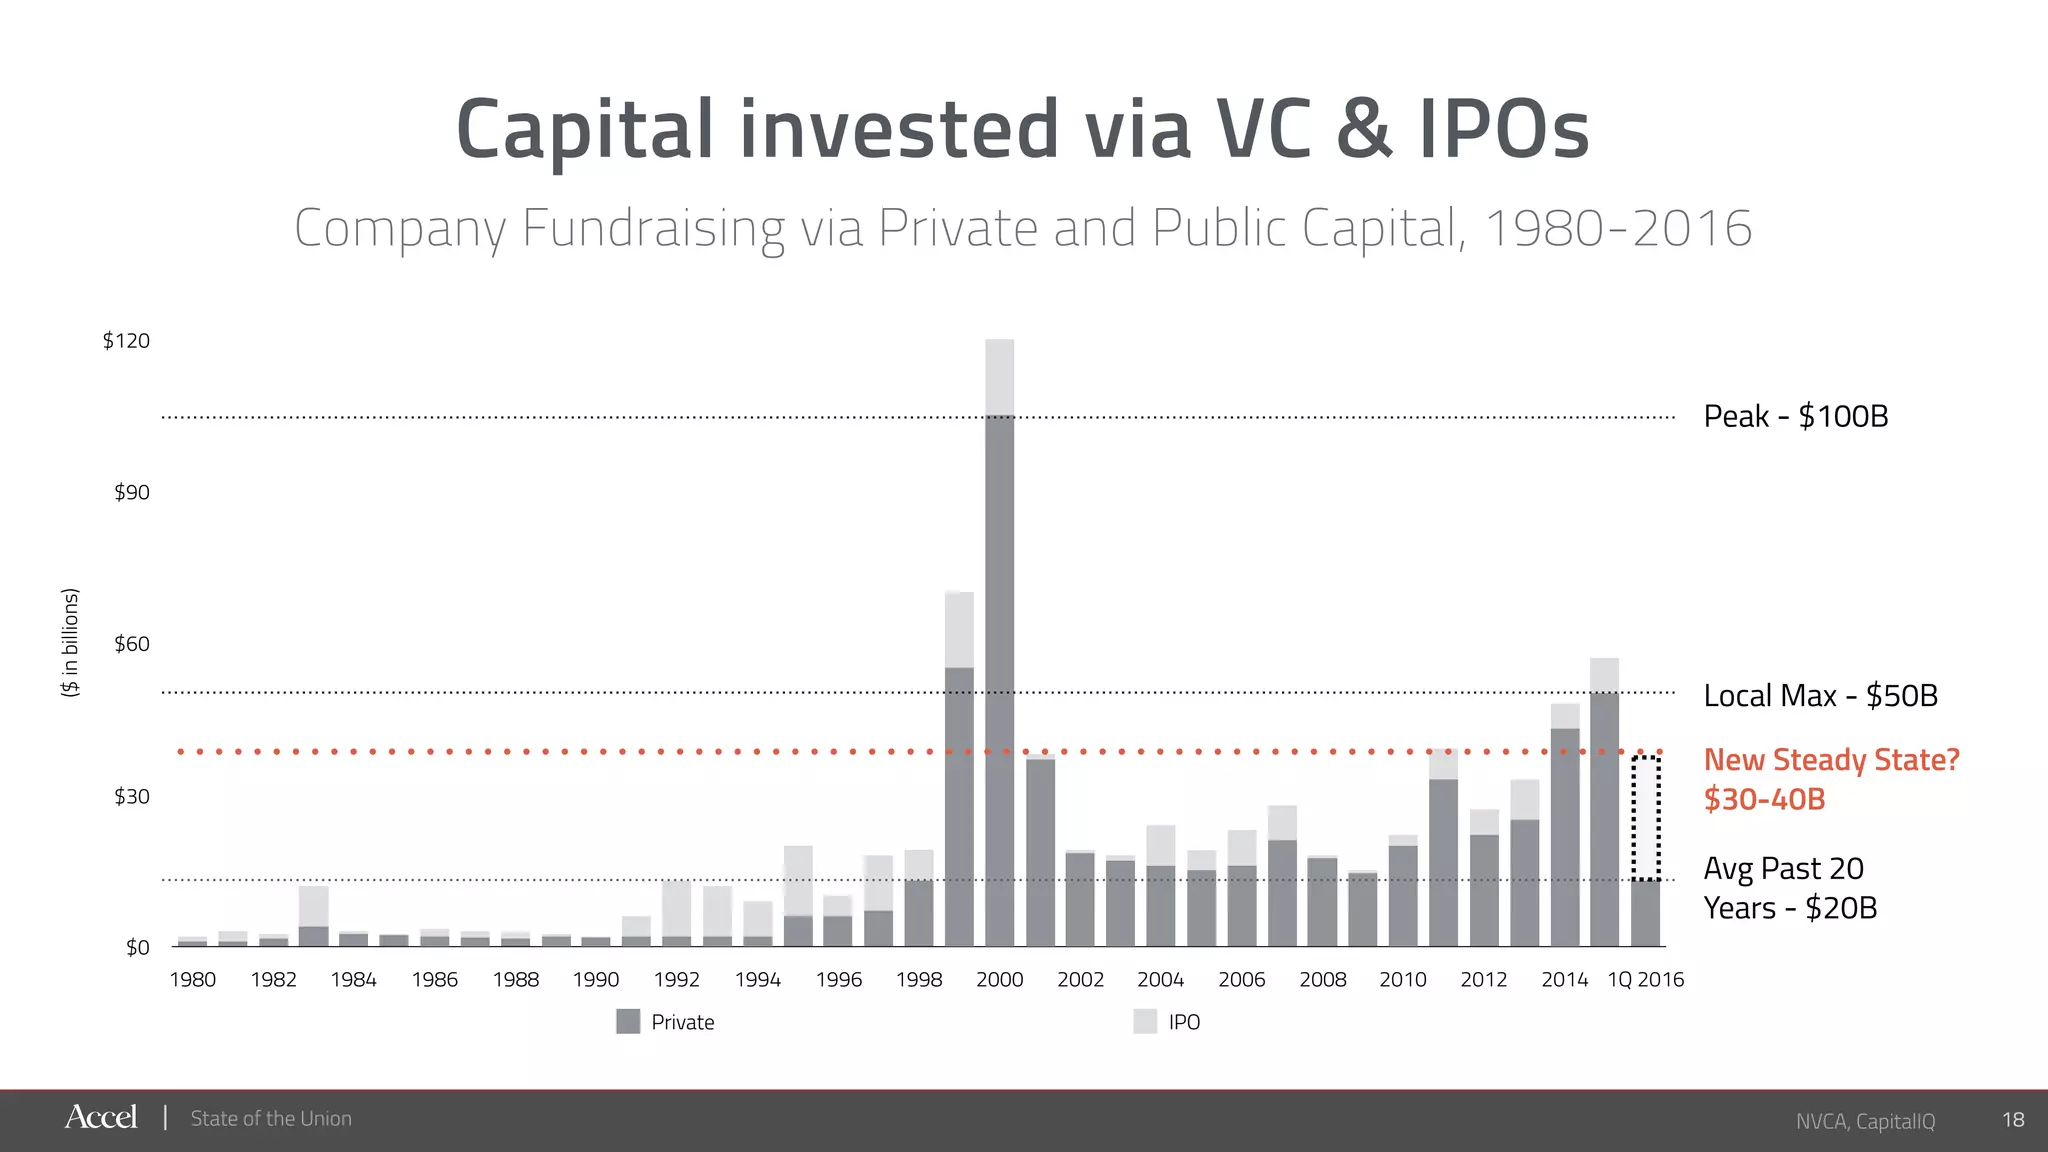


The document provides an overview of the current technology landscape from Accel's perspective, highlighting global interconnectedness, increasing data centrality, and the rise of new tech entrants. It outlines trends in venture capital, mergers and acquisitions, and IPO activity, illustrating how new guard companies are outperforming traditional industries. The analysis emphasizes the importance of diverse customer bases and efficient business models for growth and success in the evolving market.


![Vibe Coding vs. Spec-Driven Development [Free Meetup]](https://cdn.slidesharecdn.com/ss_thumbnails/vibecodingvsspecdrivendevelopment-251209105622-43f455e7-thumbnail.jpg?width=640&height=640&fit=bounds)


