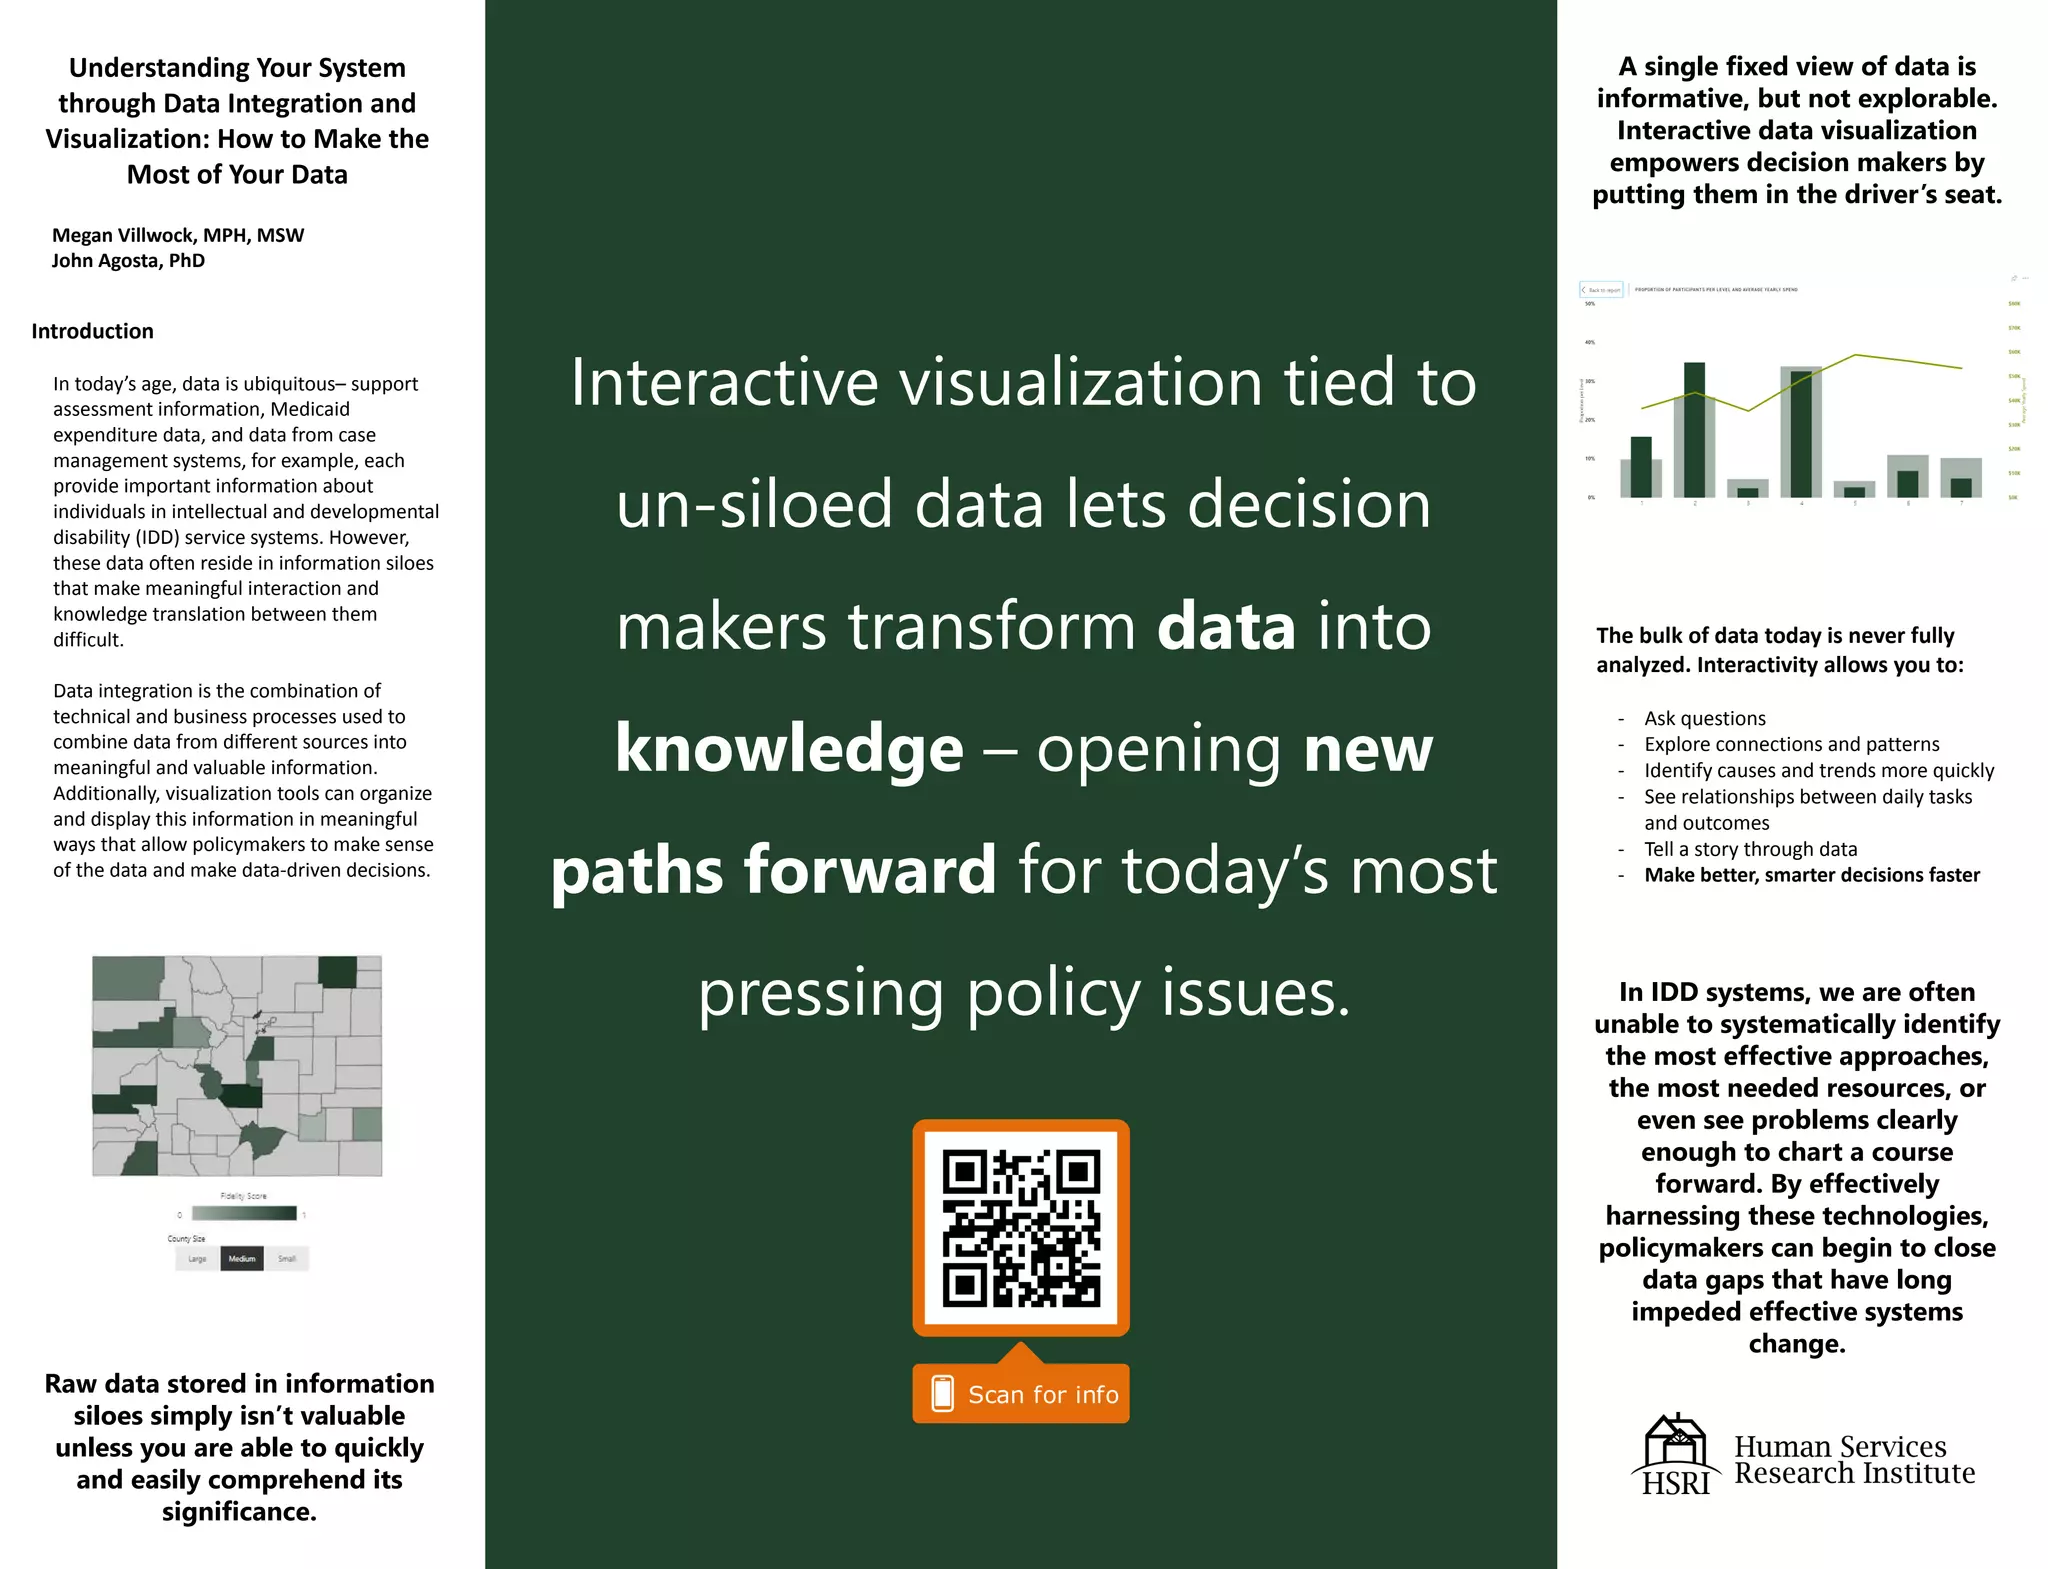
Data from different sources like case management and Medicaid are often siloed, making it difficult to interact with and translate into knowledge. Data integration combines these sources into meaningful information, while visualization tools display it in a way that allows policymakers to make sense of the data and make data-driven decisions. Interactive visualization tied to un-siloed data lets decision makers transform data into knowledge, opening new paths forward for pressing policy issues.