Recommended

Recommended
More Related Content
What's hot
What's hot (16)
Similar to A Systemic Study of Chitin Digestion Protocols
Similar to A Systemic Study of Chitin Digestion Protocols (20)
Recently uploaded
Recently uploaded (20)
A Systemic Study of Chitin Digestion Protocols
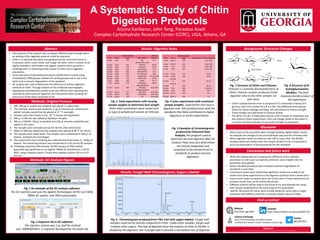
- 1. A Systematic Study of Chitin Digestion Protocols Arjuna Karikaran, John Tang, Parastoo Azadi Complex Carbohydrate Research Center (CCRC), UGA, Athens, GA Abstract • The purpose of the research was to explore different ways through which an existing chitin digestion protocol could be improved • Chitin is a naturally abundant mucopolysaccharide commonly found in crustacean shells, insect shells, and fungal cell walls. Chitin is known to be highly insoluble in both water and organic solvents which presents a challenge both in measuring small masses of chitin and in digestion procedures. • Some examples of attempted procedural modifications include using trimethylsilyl (TMS) groups instead of O-acetyl groups and to use a less harsh acid to prevent degradation of the standard. • GC analysis was used to determine the efficiency of various digestion methods of chitin. Through analysis of the produced spectrographs. • Appropriate quantification proved to be very difficult and improving the methods by which percent digestion was measured ended up being the main focus of the work conducted so far. Methods: Original Protocol 1. 300- 400 µg of sample was weighed and placed in a glass tube 2. The chitinase solution was prepared. 5 µg of chitinase per sample were added. Samples would then be placed at 37 ° C overnight 3. Samples were then frozen in the -10 ° C freezer and lyophilized 4. 400 µL of 4M HCL was added to hydrolyze samples 5. 200 µL of MeOH, 100 µL of pyridine and 100 µL of acetic anhydride was added in this order. 6. The samples were vortexed and sat for 30 min, then dried down. 7. 200µl of TMS was added and the samples were placed at 80 °C for 30 min 8. The samples were dried down. The samples were redissolved in 500 µL of hexane, vortexed and centrifuged. 9. The supernatant from vortexing was collected and dried down to ~100µL of hexane. The remaining solution was transferred to a GC vial for GC analysis. 10. Following extraction with hexane, GC/MS analysis of TMS methyl glycosides was performed on an Agilent 7890A GC interfaced to a 5975C MSD, using a Supelco Equity-1 fused silica capillary column (30 m x 0.25 mm ID). Results: Digestion Rates Fig. 3 Early experiments with varying sample weights to determine best weight. Some other parameters were varied such as type of sample and volume of chitinase. References Chen, X. (2015). Human Milk Oligosaccharides (HMOS). Advances in Carbohydrate Chemistry and Biochemistry, 72:113-190. doi:10.1016/bs.accb.2015.08.002 Mcguire, M. K., et al (2017). What’s normal? Oligosaccharide concentrations and profiles in milk produced by healthy women vary geographically. The American Journal of Clinical Nutrition 105(5):1086-1100. doi:10.3945/ajcn.116.139980 Website http://ast.uga.edu/ LinkedIn https://www.linkedin.com/groups/8307732 Find us online! Science Exchange www.scienceexchange.com/labs/complex- carbohydrate-research-center-analytical-services-uga Twitter @CCRCUGA Conclusions and future work Background: Structural Changes Methods: GC Analysis Figures • While the original goal of increasing the efficiency of the chitinase procedure in order was not explicitly achieved, many insights into the procedure were gained. • Better standard procedure were created to prevent degradation of standards in acid steps • Conclusions based upon statistically significant results are unable to be drawn from these experiments as the digestion protocol took a weeks time • Future work hopes to expand upon the trends seen in these experiments to produce results that can be statistically proven. • Different solvents will be used in the future to try and alleviate the issues with sample weighing from the early steps of the experiment • Specific directions for future work include doing the same steps in larger quantities with different solvents to provide a larger volume of data Results: Fungal Wall Chromatogram; Sugars Labeled Fig. 6 Chromatogram produced from FW1 trial with sugars labeled. Fungal wall samples could not be directly compared to chitin. Unlike other samples fungal wall contains other sugars. The rate of digestion from the analysis of chitin to GlcNAc is divided by the digestion rate in fungal wall to provide a normalized rate of digestion Fig. 1 An example of the GC analysis software. The GC machine used was the Agilent Technologies 5975C inert MSD, 7890A GC system, and 7693 autosampler. Fig. 2 Sequence list in GC software. The injection volume was 1 µL and the method was “AMINOZHIRUI” a sequence developed by the Azadi Lab Date Name Sample weight (µg) Step altered Percent Digestion 16-Sep Exp1 210 Std 31.7 16-Sep exp2 240 40 chitinase vs 20 chitinase 89.07 16-Sep exp3 270 Chitosan 23.64 23-Sep exp4 190 40 chitinase 53.4 23-Sep exp5 220 80 Chitinase 61.7 23-Sep exp6 220 20 Chitinase 28.4 30-Sep exp7 210 Fungal wall 14.3 (32.66) 30-Sep exp8 170 Chitin stds 43.78 7-Oct exp9 240 Chitin 56.77 7-Oct exp10 210 Chitobiose 65.63 14-Oct exp11 100 .1mg chitobiose (dif stds) Over 100 14-Oct exp12 150 .15mg Chitobiose (dif stds) Over 100 21-Oct exp13 150 Chitobiose Over 100 21-Oct exp14 310 FW Over 100 Date Name Sample weight (µg) Step altered Percent Digestion 4-Nov Chitin 1 150 Over 100 4-Nov Chitin 2 100 Over 100 4-Nov Fw1 150 Over 100 4-Nov FW2 100 Over 100 11-Nov Crab1 150 44.08 11-Nov Crab2 100 34.49 11-Nov Shrimp 1 150 46.13 11-Nov Shrimp 2 100 39.43 18-Nov FW1 300 0.02(.18) 18-Nov FW2 300 0.03 18-Nov Chitn 1 100 11.1 18-Nov Chitin 2 100 3.2 Fig. 4 Later experiments with consistent sample weights. Experiments that have a digestion over 100 revealed issues with the standards that likely contributed to higher digestions in earlier experiments Fig. 5 Examples of chromatograms produced by Enhanced Data Analysis, the program used to determine percent digestion after GC analysis. Peak area was determined via manual integration and compared to the inositol levels in standards to produce percent digestions. Fig. 7 Structure of Chitin and Chitosan. Chitosan is a partially deacetylated form of Chitin. Chitosan samples produced similar digestion rates to the chitin samples run with them. Fig. 8 Structure of N- Acetylglucosamine (GlcNAc). The final monosaccharide product of the experiment • Chitin’s polysaccharide chain is composed of 2-acetamido-2-deoxy-β-D- glucose, each unit is linked via a β-1,4 link. The additional amine group allows for better hydrogen bonding, this contributes to Chitins strength • These linkages are hydrolyzed to produce GlcNac • The dimer of a β-1,4 linked glucosamine units is known as Chitobiose was also tested in these experiments. Only one linkage needs to be broken it is a more sensitive indicator of successful changes to procedure. Discussion • Many steps of the procedure were changed yielding slightly better results, for example the changes to the acid hydrolysis step and the chitinase ratio • When Digestion levels are listed as over 100 It means that The GlcNAc standard peak was smaller than the sample GlcNAc as this is impossible it led to an examination of the procedures for the standards